Races in St. Clair Shores, Michigan (MI) Detailed Stats
Data:
Races - White alone (%)
Races - White alone (% change since 2000)
Races - Black alone (%)
Races - Black alone (% change since 2000)
Races - American Indian alone (%)
Races - American Indian alone (% change since 2000)
Races - Asian alone (%)
Races - Asian alone (% change since 2000)
Races - Hispanic (%)
Races - Hispanic (% change since 2000)
Races - Native Hawaiian and Other Pacific Islander alone (%)
Races - Native Hawaiian and Other Pacific Islander alone (% change since 2000)
Races - Two or more races(%)
Races - Two or more races(% change since 2000)
Races - Other race alone (%)
Races - Other race alone (% change since 2000)
Racial diversity
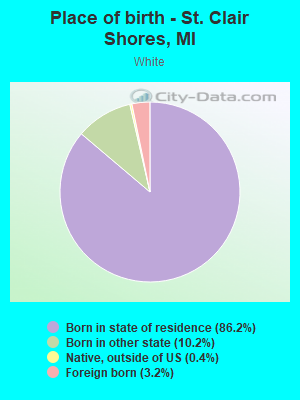
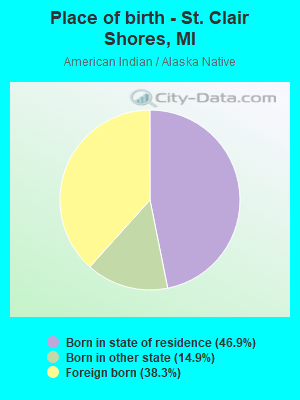
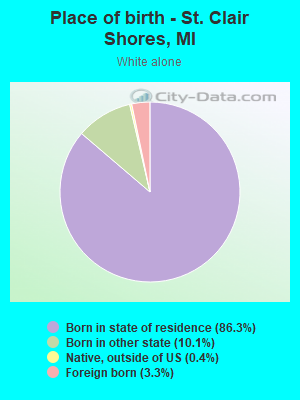
Place of birth - Born in state of residence (%)
Place of birth - Born in state of residence (%) - White
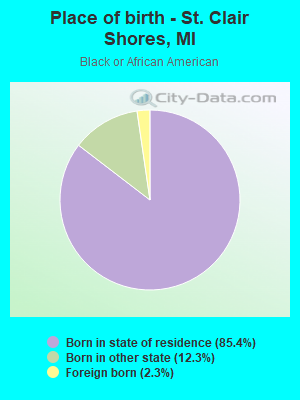
Place of birth - Born in state of residence (%) - Black or African American
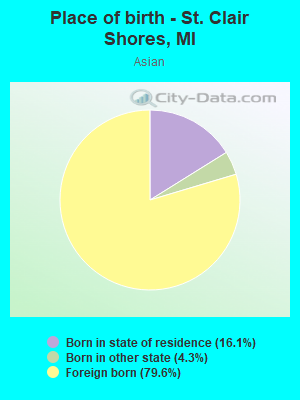
Place of birth - Born in state of residence (%) - Asian
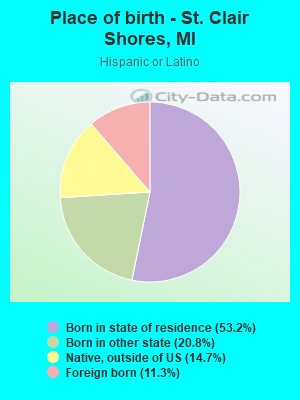
Place of birth - Born in state of residence (%) - Hispanic or Latino
Place of birth - Born in state of residence (%) - American Indian and Alaska Native
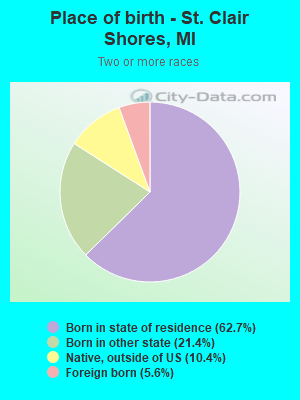
Place of birth - Born in state of residence (%) - Multirace
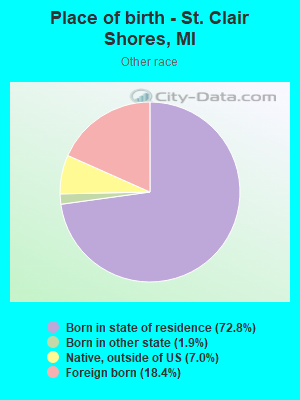
Place of birth - Born in state of residence (%) - Other Race
Place of birth - Born in other state (%)
Place of birth - Born in other state (%) - White
Place of birth - Born in other state (%) - Black or African American
Place of birth - Born in other state (%) - Asian
Place of birth - Born in other state (%) - Hispanic or Latino
Place of birth - Born in other state (%) - American Indian and Alaska Native
Place of birth - Born in other state (%) - Multirace
Place of birth - Born in other state (%) - Other Race
Place of birth - Native, outside of US (%)
Place of birth - Native, outside of US (%) - White
Place of birth - Native, outside of US (%) - Black or African American
Place of birth - Native, outside of US (%) - Asian
Place of birth - Native, outside of US (%) - Hispanic or Latino
Place of birth - Native, outside of US (%) - American Indian and Alaska Native
Place of birth - Native, outside of US (%) - Multirace
Place of birth - Native, outside of US (%) - Other Race
Place of birth - Foreign born (%)
Place of birth - Foreign born (%) - White
Place of birth - Foreign born (%) - Black or African American
Place of birth - Foreign born (%) - Asian
Place of birth - Foreign born (%) - Hispanic or Latino
Place of birth - Foreign born (%) - American Indian and Alaska Native
Place of birth - Foreign born (%) - Multirace
Place of birth - Foreign born (%) - Other Race
Residents speaking English at home (%)
Residents speaking English at home - Born in the United States (%)
Residents speaking English at home - Native, born elsewhere (%)
Residents speaking English at home - Foreign born (%)
Residents speaking Spanish at home (%)
Residents speaking Spanish at home - Born in the United States (%)
Residents speaking Spanish at home - Native, born elsewhere (%)
Residents speaking Spanish at home - Foreign born (%)
Residents speaking other language at home (%)
Residents speaking other language at home - Born in the United States (%)
Residents speaking other language at home - Native, born elsewhere (%)
Residents speaking other language at home - Foreign born (%)
Marital status - Never married (%)
Marital status - Now married (%)
Marital status - Separated (%)
Marital status - Widowed (%)
Marital status - Divorced (%)
Ancestries Reported - Arab (%)
Ancestries Reported - Czech (%)
Ancestries Reported - Danish (%)
Ancestries Reported - Dutch (%)
Ancestries Reported - English (%)
Ancestries Reported - French (%)
Ancestries Reported - French Canadian (%)
Ancestries Reported - German (%)
Ancestries Reported - Greek (%)
Ancestries Reported - Hungarian (%)
Ancestries Reported - Irish (%)
Ancestries Reported - Italian (%)
Ancestries Reported - Lithuanian (%)
Ancestries Reported - Norwegian (%)
Ancestries Reported - Polish (%)
Ancestries Reported - Portuguese (%)
Ancestries Reported - Russian (%)
Ancestries Reported - Scotch-Irish (%)
Ancestries Reported - Scottish (%)
Ancestries Reported - Slovak (%)
Ancestries Reported - Subsaharan African (%)
Ancestries Reported - Swedish (%)
Ancestries Reported - Swiss (%)
Ancestries Reported - Ukrainian (%)
Ancestries Reported - United States (%)
Ancestries Reported - Welsh (%)
Ancestries Reported - West Indian (%)
Ancestries Reported - Other (%)
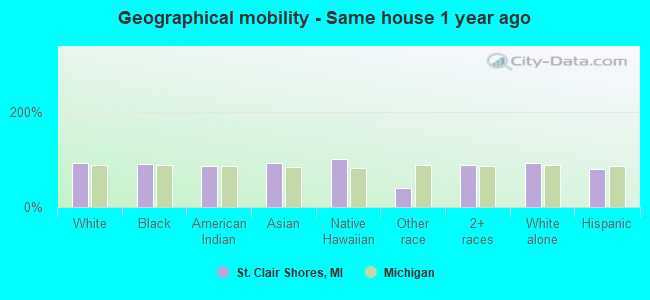
Geographical mobility - Same house 1 year ago (%)
Geographical mobility - Same house 1 year ago (%) - White
Geographical mobility - Same house 1 year ago (%) - Black or African American
Geographical mobility - Same house 1 year ago (%) - Asian
Geographical mobility - Same house 1 year ago (%) - Hispanic or Latino
Geographical mobility - Same house 1 year ago (%) - American Indian and Alaska Native
Geographical mobility - Same house 1 year ago (%) - Multirace
Geographical mobility - Same house 1 year ago (%) - Other Race
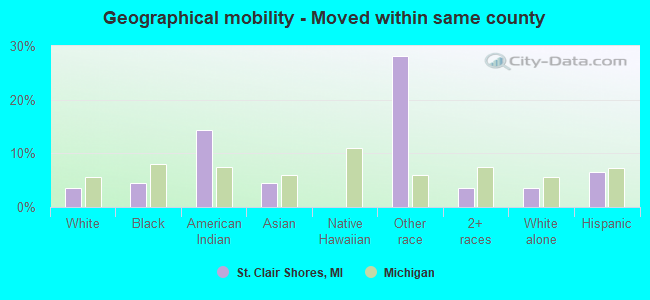
Geographical mobility - Moved within same county (%)
Geographical mobility - Moved within same county (%) - White
Geographical mobility - Moved within same county (%) - Black or African American
Geographical mobility - Moved within same county (%) - Asian
Geographical mobility - Moved within same county (%) - Hispanic or Latino
Geographical mobility - Moved within same county (%) - American Indian and Alaska Native
Geographical mobility - Moved within same county (%) - Multirace
Geographical mobility - Moved within same county (%) - Other Race
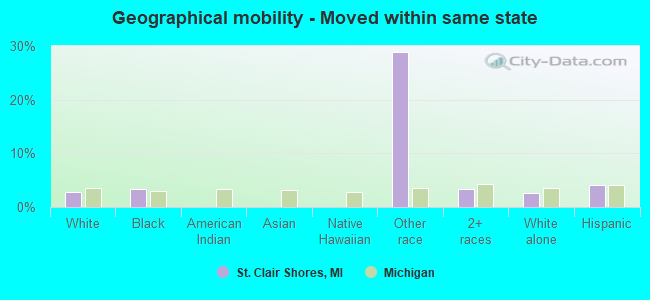
Geographical mobility - Moved from different county within same state (%)
Geographical mobility - Moved from different county within same state (%) - White
Geographical mobility - Moved from different county within same state (%) - Black or African American
Geographical mobility - Moved from different county within same state (%) - Asian
Geographical mobility - Moved from different county within same state (%) - Hispanic or Latino
Geographical mobility - Moved from different county within same state (%) - American Indian and Alaska Native
Geographical mobility - Moved from different county within same state (%) - Multirace
Geographical mobility - Moved from different county within same state (%) - Other Race
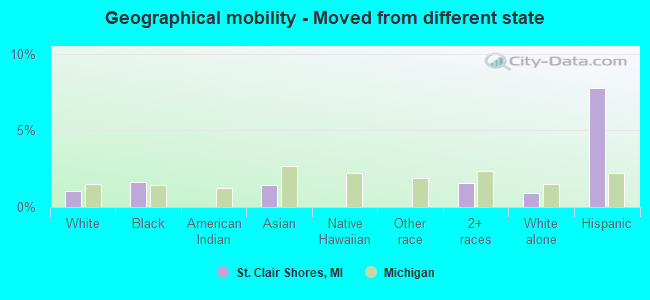
Geographical mobility - Moved from different state (%)
Geographical mobility - Moved from different state (%) - White
Geographical mobility - Moved from different state (%) - Black or African American
Geographical mobility - Moved from different state (%) - Asian
Geographical mobility - Moved from different state (%) - Hispanic or Latino
Geographical mobility - Moved from different state (%) - American Indian and Alaska Native
Geographical mobility - Moved from different state (%) - Multirace
Geographical mobility - Moved from different state (%) - Other Race
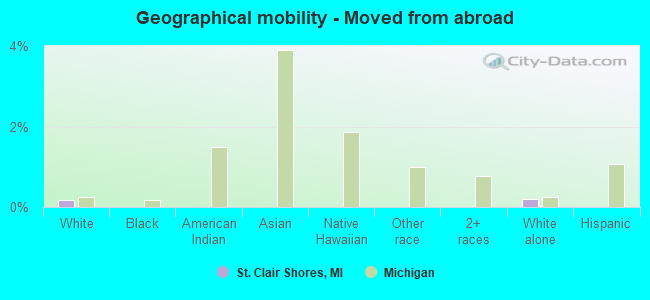
Geographical mobility - Moved from abroad (%)
Geographical mobility - Moved from abroad (%) - White
Geographical mobility - Moved from abroad (%) - Black or African American
Geographical mobility - Moved from abroad (%) - Asian
Geographical mobility - Moved from abroad (%) - Hispanic or Latino
Geographical mobility - Moved from abroad (%) - American Indian and Alaska Native
Geographical mobility - Moved from abroad (%) - Multirace
Geographical mobility - Moved from abroad (%) - Other Race
Place of birth for the foreign-born population - Ireland (%)
Place of birth for the foreign-born population - Denmark (%)
Place of birth for the foreign-born population - Norway (%)
Place of birth for the foreign-born population - Sweden (%)
Place of birth for the foreign-born population - United Kingdom (%)
Place of birth for the foreign-born population - England (%)
Place of birth for the foreign-born population - Scotland (%)
Place of birth for the foreign-born population - Other Northern Europe (%)
Place of birth for the foreign-born population - Austria (%)
Place of birth for the foreign-born population - Belgium (%)
Place of birth for the foreign-born population - France (%)
Place of birth for the foreign-born population - Germany (%)
Place of birth for the foreign-born population - Netherlands (%)
Place of birth for the foreign-born population - Switzerland (%)
Place of birth for the foreign-born population - Other Western Europe (%)
Place of birth for the foreign-born population - Greece (%)
Place of birth for the foreign-born population - Italy (%)
Place of birth for the foreign-born population - Portugal (%)
Place of birth for the foreign-born population - Spain (%)
Place of birth for the foreign-born population - Other Southern Europe (%)
Place of birth for the foreign-born population - Albania (%)
Place of birth for the foreign-born population - Belarus (%)
Place of birth for the foreign-born population - Bosnia and Herzegovina (%)
Place of birth for the foreign-born population - Bulgaria (%)
Place of birth for the foreign-born population - Croatia (%)
Place of birth for the foreign-born population - Czechoslovakia (%)
Place of birth for the foreign-born population - Hungary (%)
Place of birth for the foreign-born population - Latvia (%)
Place of birth for the foreign-born population - Lithuania (%)
Place of birth for the foreign-born population - North Macedonia (Macedonia) (%)
Place of birth for the foreign-born population - Moldova (%)
Place of birth for the foreign-born population - Poland (%)
Place of birth for the foreign-born population - Romania (%)
Place of birth for the foreign-born population - Russia (%)
Place of birth for the foreign-born population - Serbia (%)
Place of birth for the foreign-born population - Ukraine (%)
Place of birth for the foreign-born population - Other Eastern Europe (%)
Place of birth for the foreign-born population - China (%)
Place of birth for the foreign-born population - Hong Kong (%)
Place of birth for the foreign-born population - Taiwan (%)
Place of birth for the foreign-born population - Japan (%)
Place of birth for the foreign-born population - Korea (%)
Place of birth for the foreign-born population - Other Eastern Asia (%)
Place of birth for the foreign-born population - Afghanistan (%)
Place of birth for the foreign-born population - Bangladesh (%)
Place of birth for the foreign-born population - India (%)
Place of birth for the foreign-born population - Iran (%)
Place of birth for the foreign-born population - Kazakhstan (%)
Place of birth for the foreign-born population - Nepal (%)
Place of birth for the foreign-born population - Pakistan (%)
Place of birth for the foreign-born population - Sri Lanka (%)
Place of birth for the foreign-born population - Uzbekistan (%)
Place of birth for the foreign-born population - Other South Central Asia (%)
Place of birth for the foreign-born population - Burma (%)
Place of birth for the foreign-born population - Cambodia (%)
Place of birth for the foreign-born population - Indonesia (%)
Place of birth for the foreign-born population - Laos (%)
Place of birth for the foreign-born population - Malaysia (%)
Place of birth for the foreign-born population - Philippines (%)
Place of birth for the foreign-born population - Singapore (%)
Place of birth for the foreign-born population - Thailand (%)
Place of birth for the foreign-born population - Vietnam (%)
Place of birth for the foreign-born population - Other South Eastern Asia (%)
Place of birth for the foreign-born population - Armenia (%)
Place of birth for the foreign-born population - Iraq (%)
Place of birth for the foreign-born population - Israel (%)
Place of birth for the foreign-born population - Jordan (%)
Place of birth for the foreign-born population - Kuwait (%)
Place of birth for the foreign-born population - Lebanon (%)
Place of birth for the foreign-born population - Saudi Arabia (%)
Place of birth for the foreign-born population - Syria (%)
Place of birth for the foreign-born population - Turkey (%)
Place of birth for the foreign-born population - Yemen (%)
Place of birth for the foreign-born population - Other Western Asia (%)
Place of birth for the foreign-born population - Eritrea (%)
Place of birth for the foreign-born population - Ethiopia (%)
Place of birth for the foreign-born population - Kenya (%)
Place of birth for the foreign-born population - Somalia (%)
Place of birth for the foreign-born population - Uganda (%)
Place of birth for the foreign-born population - Zimbabwe (%)
Place of birth for the foreign-born population - Other Eastern Africa (%)
Place of birth for the foreign-born population - Cameroon (%)
Place of birth for the foreign-born population - Congo (%)
Place of birth for the foreign-born population - Democratic Republic of Congo (Zaire) (%)
Place of birth for the foreign-born population - Other Middle Africa (%)
Place of birth for the foreign-born population - Egypt (%)
Place of birth for the foreign-born population - Morocco (%)
Place of birth for the foreign-born population - Sudan (%)
Place of birth for the foreign-born population - Other Northern Africa (%)
Place of birth for the foreign-born population - South Africa (%)
Place of birth for the foreign-born population - Other Southern Africa (%)
Place of birth for the foreign-born population - Cabo Verde (%)
Place of birth for the foreign-born population - Ghana (%)
Place of birth for the foreign-born population - Liberia (%)
Place of birth for the foreign-born population - Nigeria (%)
Place of birth for the foreign-born population - Senegal (%)
Place of birth for the foreign-born population - Sierra Leone (%)
Place of birth for the foreign-born population - Other Western Africa (%)
Place of birth for the foreign-born population - Australia (%)
Place of birth for the foreign-born population - New Zealand (%)
Place of birth for the foreign-born population - Fiji (%)
Place of birth for the foreign-born population - Micronesia (%)
Place of birth for the foreign-born population - Bahamas (%)
Place of birth for the foreign-born population - Barbados (%)
Place of birth for the foreign-born population - Cuba (%)
Place of birth for the foreign-born population - Dominica (%)
Place of birth for the foreign-born population - Dominican Republic (%)
Place of birth for the foreign-born population - Grenada (%)
Place of birth for the foreign-born population - Haiti (%)
Place of birth for the foreign-born population - Jamaica (%)
Place of birth for the foreign-born population - St. Vincent and the Grenadines (%)
Place of birth for the foreign-born population - Trinidad and Tobago (%)
Place of birth for the foreign-born population - West Indies (%)
Place of birth for the foreign-born population - Other Caribbean (%)
Place of birth for the foreign-born population - Belize (%)
Place of birth for the foreign-born population - Costa Rica (%)
Place of birth for the foreign-born population - El Salvador (%)
Place of birth for the foreign-born population - Guatemala (%)
Place of birth for the foreign-born population - Honduras (%)
Place of birth for the foreign-born population - Mexico (%)
Place of birth for the foreign-born population - Nicaragua (%)
Place of birth for the foreign-born population - Panama (%)
Place of birth for the foreign-born population - Other Central America (%)
Place of birth for the foreign-born population - Argentina (%)
Place of birth for the foreign-born population - Bolivia (%)
Place of birth for the foreign-born population - Brazil (%)
Place of birth for the foreign-born population - Chile (%)
Place of birth for the foreign-born population - Colombia (%)
Place of birth for the foreign-born population - Ecuador (%)
Place of birth for the foreign-born population - Guyana (%)
Place of birth for the foreign-born population - Peru (%)
Place of birth for the foreign-born population - Uruguay (%)
Place of birth for the foreign-born population - Venezuela (%)
Place of birth for the foreign-born population - Other South America (%)
Place of birth for the foreign-born population - Canada (%)
Place of birth for the foreign-born population - Other Northern America (%)
Place of birth for the foreign-born population - Other (%)
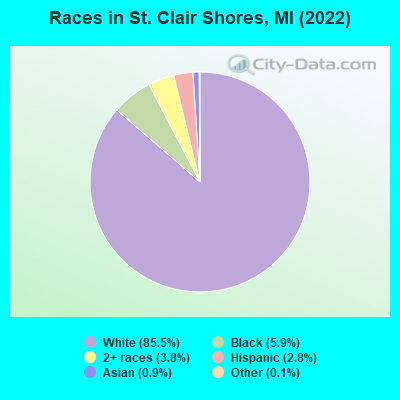
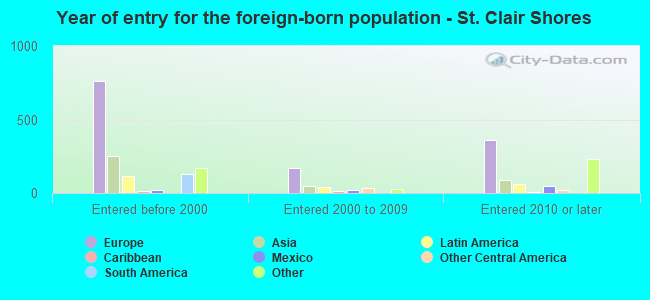
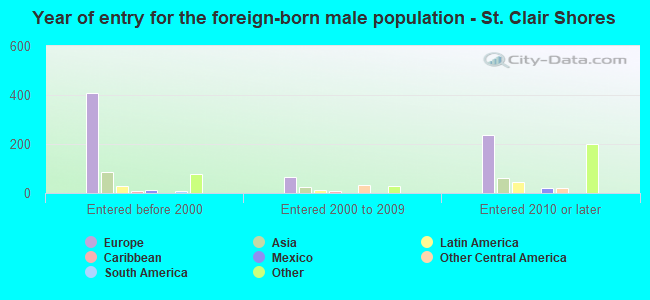
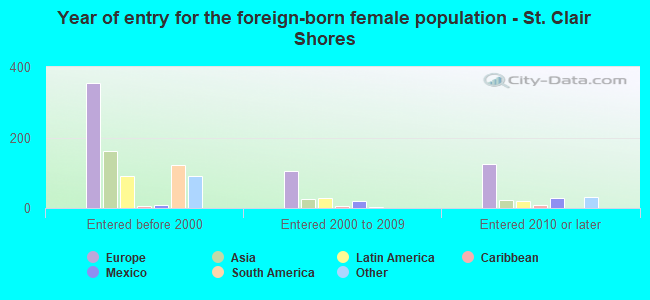
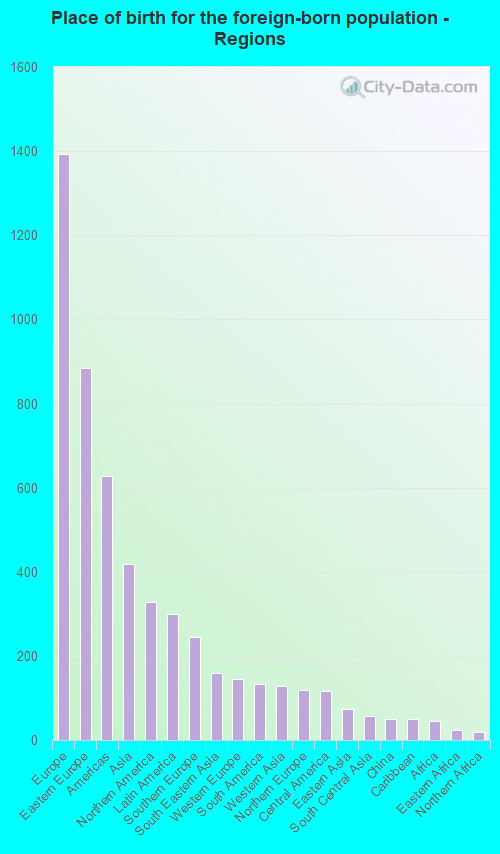
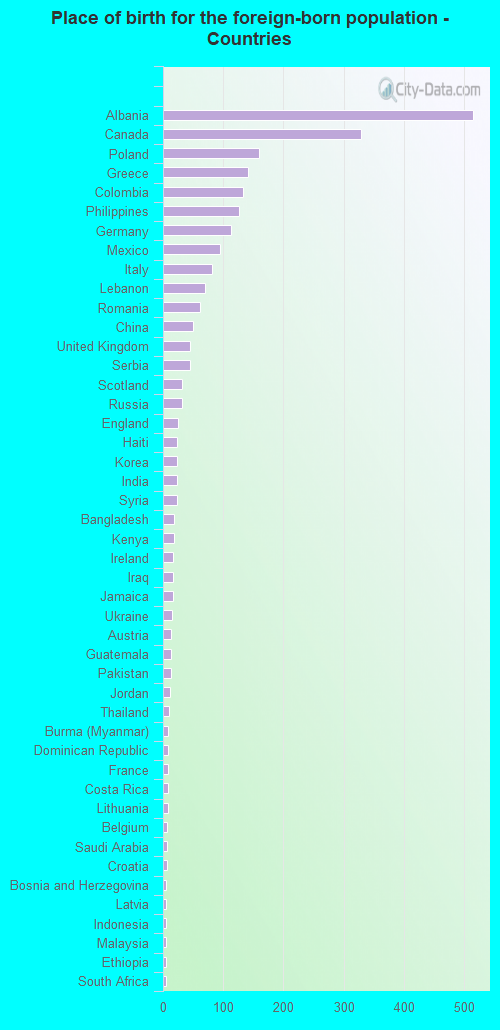
According to 2022 data, the most numerous races in St. Clair Shores, MI are White alone (49,899 residents), Black alone (3,415 residents), and Hispanic (1,646 residents). 95.0% of St. Clair Shores residents speak English at home. 4.3% of St. Clair Shores, MI residents are foreign-born (2.4% born in Europe, 0.7% born in Asia, 0.6% born in North America, 0.5% born in Latin America), which is 40.8% less than the foreign-born rate of 6.0% across the entire state of Michigan.
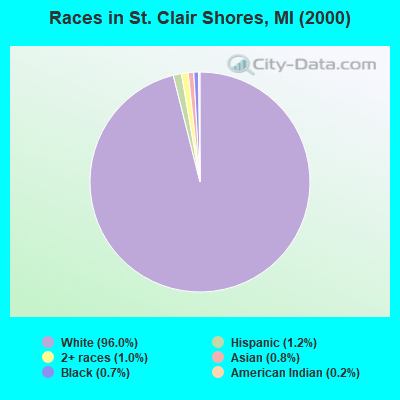
Race distribution in St. Clair Shores
2000 2022
7,806,691 78.6% White alone 1,402,047 14.1% Black alone 323,877 3.3% Hispanic 175,311 1.8% Asian alone 163,487 1.6% Two or more races 53,421 0.5% American Indian alone 11,465 0.1% Other race alone 2,145 0.02% Native Hawaiian and Other
7,289,051 72.6% White alone 1,310,464 13.1% Black alone 572,405 5.7% Hispanic 450,031 4.5% Two or more races 335,732 3.3% Asian alone 45,217 0.5% Other race alone 29,011 0.3% American Indian alone 2,207 0.02% Native Hawaiian and Other
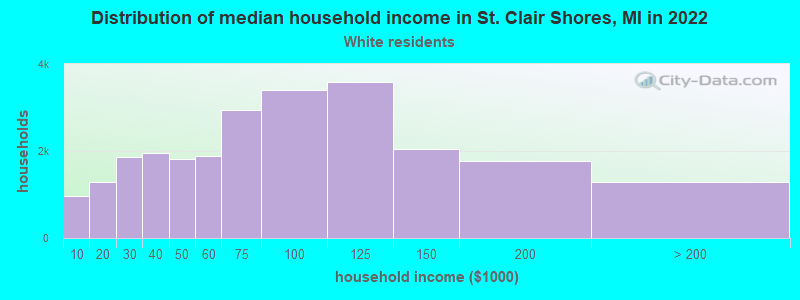
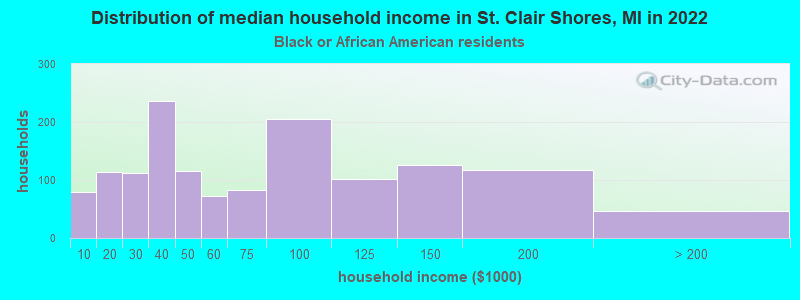
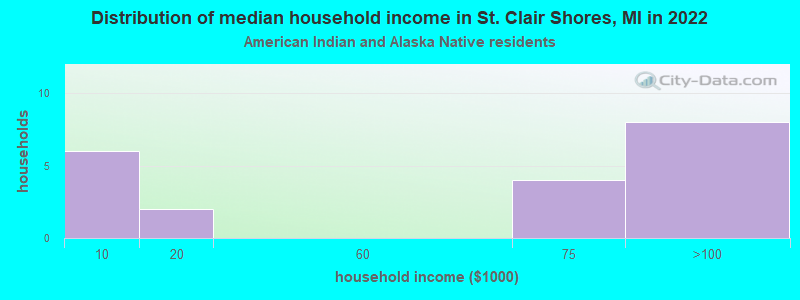
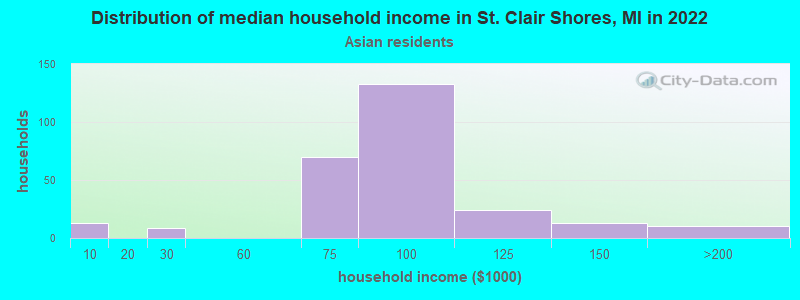
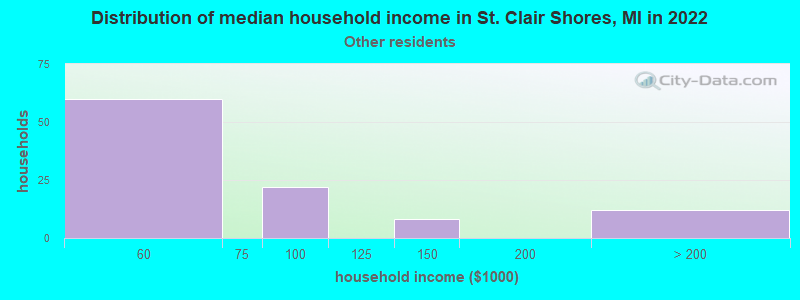
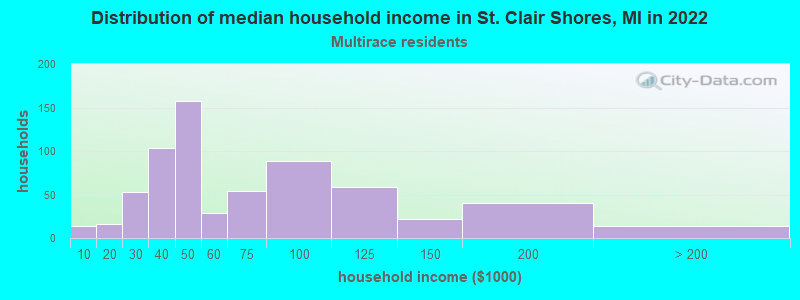
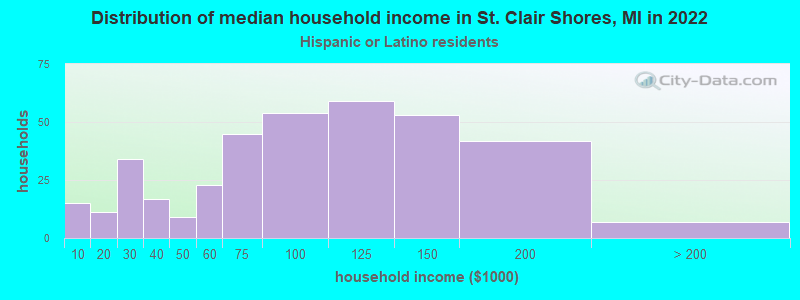
Income and house value in St. Clair Shores Median household income in 2022 $73,048 White non-Hispanic householders$51,886 Black householders$77,995 Asian householders$44,261 Two or more races householders$78,495 Hispanic or Latino race householdersMedian 2022 house value $203,403 White Non-Hispanic householders$250,634 Black or African American householders$201,593 American Indian or Alaska Native householders $205,707 Asian householders$232,531 Some other race householders$191,719 Two or more races householders$212,784 Hispanic or Latino householders
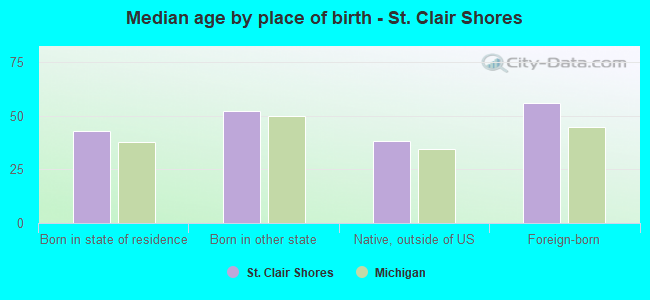
Median age by race in St. Clair Shores
46.2 Median age for White residents44.1 48.5 39.3 Median age for Black or African American residents35.4 43.9 68.4 Median age for American Indian / Alaska Native residents29.2 98.4 32.7 Median age for Asian residents28.1 53.8 -670,531,400.3 Median age for Native Hawaiian / Pacific Islander residents-674,772,035.8 -699,588,476.7 27.6 Median age for Other race residents27.3 36.5 30.2 Median age for Two or more races residents29.2 30.4 46.5 Median age for White alone residents44.2 49.0 25.6 Median age for Hispanic or Latino residents22.2 30.8
Owner/renter occupied households by race in St. Clair Shores
House owners and renters - White residents 21,189 85.8% Owner occupied3,501 14.2% Renter occupiedHouse owners and renters - Black or African American residents 721 50.7% Owner occupied702 49.3% Renter occupiedHouse owners and renters - American Indian / Alaska Native residents 20 90.9% Owner occupied2 9.1% Renter occupiedHouse owners and renters - Asian residents 173 59.1% Owner occupied120 40.9% Renter occupiedHouse owners and renters - Other race residents 116 76.1% Owner occupied37 23.9% Renter occupiedHouse owners and renters - Two or more races residents 516 70.8% Owner occupied213 29.2% Renter occupiedHouse owners and renters - White alone residents 21,154 86.1% Owner occupied3,418 13.9% Renter occupiedHouse owners and renters - Hispanic or Latino residents 259 67.3% Owner occupied126 32.7% Renter occupied
Language usage in St. Clair Shores
English speakers - Total 95.0% of residents of St. Clair Shores speak English at home.
0.7% of residents speak Spanish at home 282 73.2% Speak English very well103 26.8% Speak English less than very well4.1% of residents speak other language at home 1,711 76.2% Speak English very well535 23.8% Speak English less than very well
English speakers - Born in the United States 95.9% of residents of St. Clair Shores speak English at home.
0.8% of residents speak Spanish at home 21 40.4% Speak English very well31 59.6% Speak English less than very well3.2% of residents speak other language at home 190 95.0% Speak English very well10 5.0% Speak English less than very well
All residents speak only English at home
English speakers - Foreign-born 40.3% of residents of St. Clair Shores speak English at home.
7.8% of residents speak Spanish at home 156 82.1% Speak English very well34 17.9% Speak English less than very well49.7% of residents speak other language at home 714 58.8% Speak English very well500 41.2% Speak English less than very well
White (Caucasian) - Speak only English Native:
97.8% (45,247)Foreign-born:
40.5% (657)
White (Caucasian) - Speak another language Native:
2.2% (1,018)Foreign-born:
58.5% (949)
Black or African American - Speak only English Native:
99.8% (3,067)Foreign-born:
67.3% (52)
Black or African American - Speak another language Native:
0.4% (12)Foreign-born:
32.3% (25)
American Indian / Alaska Native - Speak only English Native:
70.5% (26)Foreign-born:
91.6% (21)
Asian - Speak only English Native:
56.7% (67)Foreign-born:
52.1% (233)
Asian - Speak another language Native:
38.9% (46)Foreign-born:
46.9% (210)
Other race - Speak only English Native:
98.3% (262)Foreign-born:
1.8% (2)
Other race - Speak another language Native:
6.2% (17)Foreign-born:
97.7% (86)
Two or more races - Speak only English Native:
96.0% (2,743)Foreign-born:
11.9% (22)
Two or more races - Speak another language Native:
3.4% (98)Foreign-born:
88.2% (163)
White alone - Speak only English Native:
97.6% (44,901)Foreign-born:
40.6% (660)
White alone - Speak another language Native:
2.2% (1,020)Foreign-born:
58.1% (945)
Hispanic or Latino - Speak only English Native:
95.4% (1,271)Foreign-born:
9.6% (18)
Hispanic or Latino - Speak another language Native:
8.3% (111)Foreign-born:
90.4% (173)
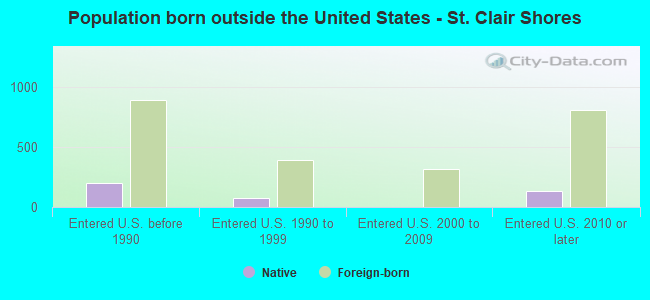
Foreign-born residents in St. Clair Shores 2,487 residents are foreign born (2.4% Europe , 0.7% Asia , 0.6% North America , 0.5% Latin America ).
This city:
4.3%Michigan:
6.9%
Marital status for residents in St. Clair Shores Marital status - White (Caucasian) population 15 years and over
Males 34.2% Never married49.3% Now married0.7% Separated3.2% Widowed12.6% DivorcedFemales 25.5% Never married46.7% Now married0.6% Separated11.5% Widowed15.7% DivorcedWomen who gave birth in the past 12 months Now married:
83.1% (458)Unmarried:
16.9% (93)
Women who did not give birth in the past 12 months Now married:
45.8% (4,329)Unmarried:
54.2% (5,127)
Marital status - Black or African American population 15 years and over
Males 50.7% Never married38.7% Now married3.7% Separated2.1% Widowed4.8% DivorcedFemales 43.9% Never married27.0% Now married0.3% Separated8.1% Widowed20.7% DivorcedWomen who gave birth in the past 12 months Now married:
67.1% (48)Unmarried:
32.9% (24)
Women who did not give birth in the past 12 months Now married:
26.3% (212)Unmarried:
73.7% (596)
Marital status - American Indian / Alaska Native population 15 years and over
Males 100.0% Never married0.0% Now married0.0% Separated0.0% Widowed0.0% DivorcedFemales 18.2% Never married77.3% Now married0.0% Separated0.0% Widowed4.5% DivorcedWomen who did not give birth in the past 12 months Now married:
100.0% (2)Unmarried:
0.0% (0)
Marital status - Asian population 15 years and over
Males 65.4% Never married30.4% Now married0.0% Separated0.0% Widowed4.3% DivorcedFemales 23.3% Never married51.4% Now married0.0% Separated10.2% Widowed15.1% DivorcedWomen who gave birth in the past 12 months Now married:
100.0% (9)Unmarried:
0.0% (0)
Women who did not give birth in the past 12 months Now married:
36.0% (42)Unmarried:
64.0% (74)
Marital status - Other race population 15 years and over
Males 41.5% Never married58.5% Now married0.0% Separated0.0% Widowed0.0% DivorcedFemales 14.7% Never married69.5% Now married0.0% Separated0.0% Widowed15.8% DivorcedWomen who gave birth in the past 12 months Now married:
0.0% (0)Unmarried:
100.0% (12)
Women who did not give birth in the past 12 months Now married:
92.5% (59)Unmarried:
7.5% (5)
Marital status - Two or more races population 15 years and over
Males 54.3% Never married39.0% Now married0.8% Separated0.0% Widowed5.8% DivorcedFemales 39.8% Never married47.5% Now married0.0% Separated2.9% Widowed9.8% DivorcedWomen who did not give birth in the past 12 months Now married:
39.2% (278)Unmarried:
60.8% (431)
Marital status - White alone, not Hispanic / Latino population 15 years and over
Males 34.2% Never married49.2% Now married0.7% Separated3.2% Widowed12.7% DivorcedFemales 25.4% Never married46.7% Now married0.6% Separated11.6% Widowed15.7% DivorcedWomen who gave birth in the past 12 months Now married:
83.1% (458)Unmarried:
16.9% (93)
Women who did not give birth in the past 12 months Now married:
45.8% (4,269)Unmarried:
54.2% (5,047)
Marital status - Hispanic or Latino population 15 years and over
Males 56.0% Never married39.4% Now married0.8% Separated0.0% Widowed3.7% DivorcedFemales 31.5% Never married58.5% Now married0.0% Separated0.6% Widowed9.4% DivorcedWomen who gave birth in the past 12 months Now married:
0.0% (0)Unmarried:
100.0% (11)
Women who did not give birth in the past 12 months Now married:
45.3% (157)Unmarried:
54.7% (189)
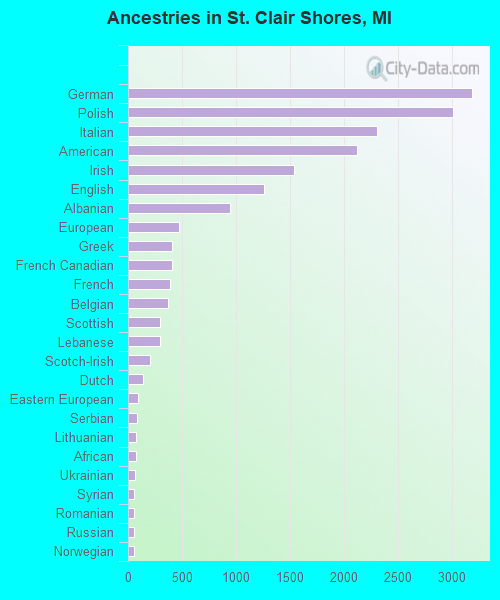
Ancestries in St. Clair Shores
3,185 13.8% German3,008 13.1% Polish2,311 10.0% Italian2,126 9.2% American1,542 6.7% Irish1,258 5.5% English948 4.1% Albanian468 2.0% European410 1.8% Greek404 1.8% French Canadian385 1.7% French367 1.6% Belgian299 1.3% Scottish294 1.3% Lebanese206 0.9% Scotch-Irish139 0.6% Dutch97 0.4% Eastern European83 0.4% Serbian73 0.3% Lithuanian72 0.3% African68 0.3% Ukrainian60 0.3% Syrian56 0.2% Romanian53 0.2% Russian52 0.2% Norwegian44 0.2% Scandinavian43 0.2% Canadian37 0.2% Hungarian34 0.1% British29 0.1% Macedonian28 0.1% Haitian26 0.1% Maltese26 0.1% Kenyan23 0.10% Slovak20 0.09% Austrian19 0.08% Finnish18 0.08% Czech17 0.07% Portuguese17 0.07% Arab16 0.07% Egyptian16 0.07% Swedish15 0.07% Croatian13 0.06% Armenian13 0.06% Welsh12 0.05% Slovene12 0.05% Yugoslavian9 0.04% Swiss9 0.04% Jordanian8 0.03% Danish8 0.03% Jamaican7 0.03% Assyrian6 0.03% Northern European6 0.03% Pennsylvania German5 0.02% Celtic5 0.02% Ethiopian
Geographical mobility in St. Clair Shores Same house 1 year ago 45,857 92.5% White (Caucasian)3,017 91.2% Black or African American45 84.8% American Indian / Alaska Native521 93.0% Asian20 100.0% Native Hawaiian / Pacific Islander154 40.4% Other race2,815 89.3% Two or more races45,719 92.7% White alone, not Hispanic / Latino1,308 79.7% Hispanic or LatinoMoved within same county 1,747 3.5% White / Caucasian149 4.5% Black or African American8 14.3% American Indian / Alaska Native25 4.5% Asian107 28.1% Other race114 3.6% Two or more races1,750 3.5% White alone, not Hispanic / Latino106 6.5% Hispanic or LatinoMoved within same state 1,355 2.7% White / Caucasian113 3.4% Black or African American110 28.9% Other race105 3.3% Two or more races1,315 2.7% White alone, not Hispanic / Latino68 4.2% Hispanic or LatinoMoved from different state 517 1.0% White / Caucasian54 1.6% Black or African American8 1.4% Asian50 1.6% Two or more races450 0.9% White alone, not Hispanic / Latino127 7.7% Hispanic or LatinoMoved from abroad 91 0.2% White96 0.2% White alone, not Hispanic / Latino
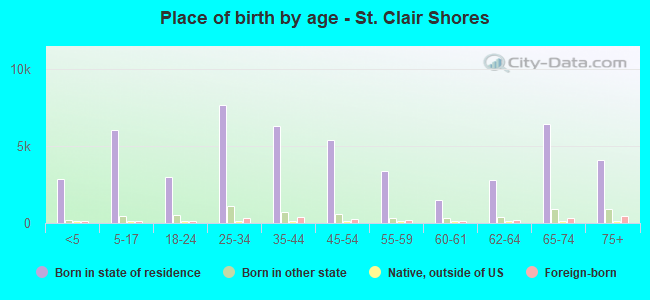
Children Nativity (place of birth) in St. Clair Shores
Children under 6 years - Living with two parents Both parents native 2,556 100.0% NativeBoth parents foreign-born 65 100.0% NativeOne native, one foreign-born parent 87 100.0% NativeChildren under 6 years - Living with one parent Native parent 910 100.0% NativeChildren 6 to 17 years - Living with two parents Both parents native 3,237 99.3% Native24 0.7% Foreign-bornBoth parents foreign-born 111 60.4% Native73 39.6% Foreign-bornOne native, one foreign-born parent 66 100.0% NativeChildren 6 to 17 years - Living with one parent Native parent 1,967 100.0% NativeForeign-born parent 78 48.2% Native84 51.8% Foreign-born
Grandparents responsible for own grandchildren in St. Clair Shores
Grandparents (30 to 59 years) White / Caucasian 113 61.6% Responsible for grandchildren71 38.4% Not responsible for grandchildrenBlack or African American 50 34.4% Responsible for grandchildren96 65.6% Not responsible for grandchildrenOther race 10 100.0% Responsible for grandchildrenWhite alone, not Hispanic / Latino 113 60.5% Responsible for grandchildren74 39.5% Not responsible for grandchildrenHispanic or Latino 6 100.0% Responsible for grandchildrenGrandparents (60 years and over) White / Caucasian 121 30.6% Responsible for grandchildren274 69.4% Not responsible for grandchildrenBlack or African American 27 59.3% Responsible for grandchildren19 40.7% Not responsible for grandchildrenWhite alone, not Hispanic / Latino 121 30.3% Responsible for grandchildren278 69.7% Not responsible for grandchildren