Races in St. Helena, South Carolina (SC) Detailed Stats
Ancestries, Foreign-born residents, place of birth
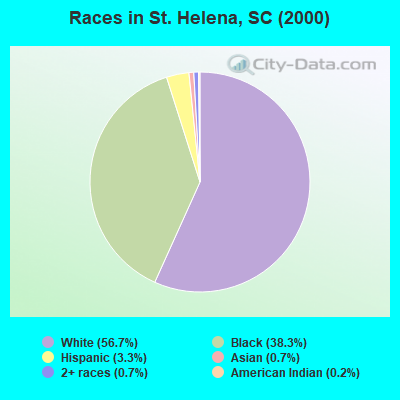
Race distribution in St. Helena

- 10,67156.7%White alone
- 7,19838.3%Black alone
- 6243.3%Hispanic
- 1240.7%Two or more races
- 1250.7%Asian alone
- 420.2%American Indian alone
- 120.06%Other race alone
- 110.06%Native Hawaiian and Other
Pacific Islander alone
2000
2022
-
- 2,652,29166.1%White alone
- 1,178,48629.4%Black alone
- 95,0762.4%Hispanic
- 35,5680.9%Asian alone
- 33,2900.8%Two or more races
- 12,7650.3%American Indian alone
- 3,2660.08%Other race alone
- 1,2700.03%Native Hawaiian and Other
Pacific Islander alone

-
- 3,301,73962.5%White alone
- 1,313,29024.9%Black alone
- 343,7836.5%Hispanic
- 190,5083.6%Two or more races
- 89,8881.7%Asian alone
- 29,3900.6%Other race alone
- 12,1120.2%American Indian alone
- 1,9240.04%Native Hawaiian and Other
Pacific Islander alone

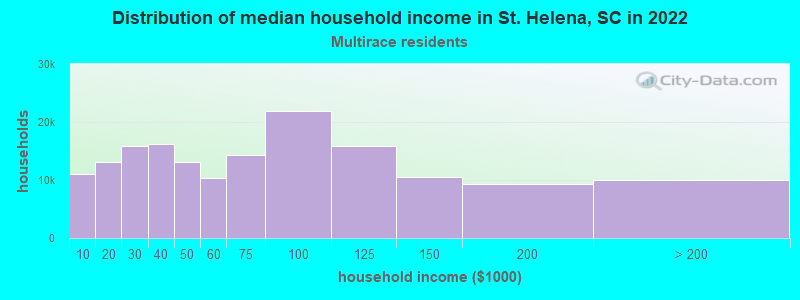
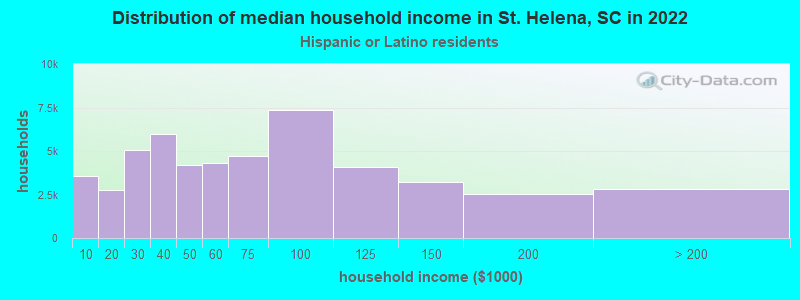
Income and house value in St. Helena
- Median household income in 2022
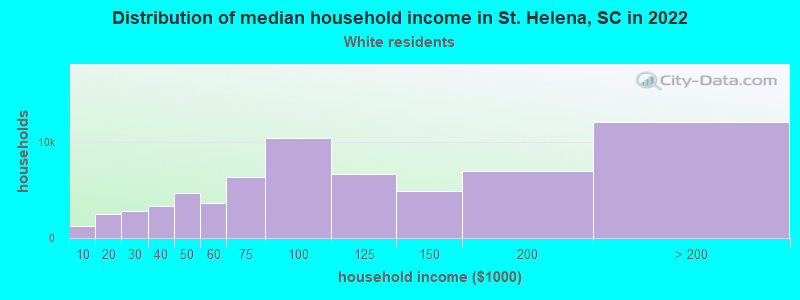
- $102,492White non-Hispanic householders
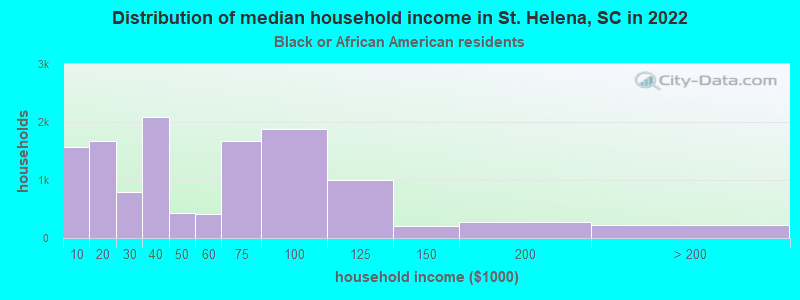
- $38,599Black householders
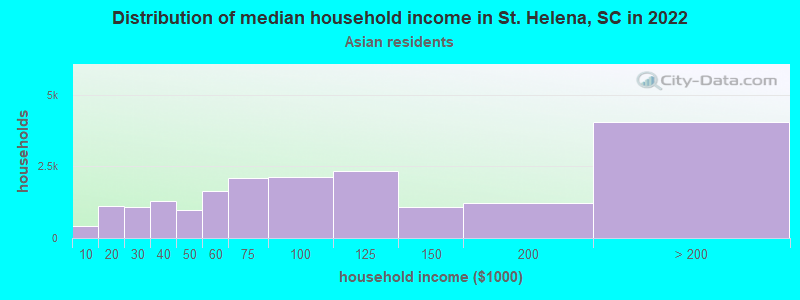
- $60,561Asian householders
- $56,912Some other race householders
- over $200,000Two or more races householders
- $70,636Hispanic or Latino race householders
- Median 2022 house value
- $551,927White Non-Hispanic householders
- $251,026Black or African American householders
- $364,553Asian householders
- $309,994Some other race householders
- $447,769Two or more races householders
- $417,734Hispanic or Latino householders
Household income for White non-Hispanic householders
Household income for Black householders
Household income for Asian householders
Household income for Two or more races householders
Household income for Hispanic or Latino race householders
Zip code: 29920