Races in St. Joseph, Michigan (MI) Detailed Stats
Data:
Races - White alone (%)
Races - White alone (% change since 2000)
Races - Black alone (%)
Races - Black alone (% change since 2000)
Races - American Indian alone (%)
Races - American Indian alone (% change since 2000)
Races - Asian alone (%)
Races - Asian alone (% change since 2000)
Races - Hispanic (%)
Races - Hispanic (% change since 2000)
Races - Native Hawaiian and Other Pacific Islander alone (%)
Races - Native Hawaiian and Other Pacific Islander alone (% change since 2000)
Races - Two or more races(%)
Races - Two or more races(% change since 2000)
Races - Other race alone (%)
Races - Other race alone (% change since 2000)
Racial diversity
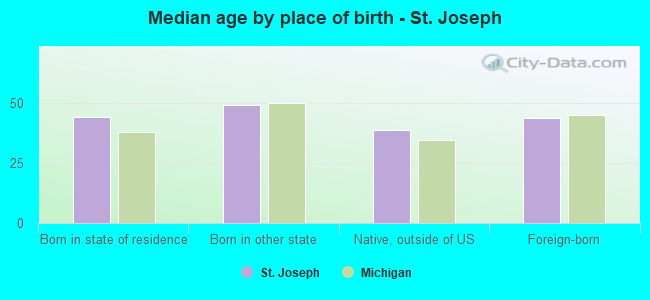
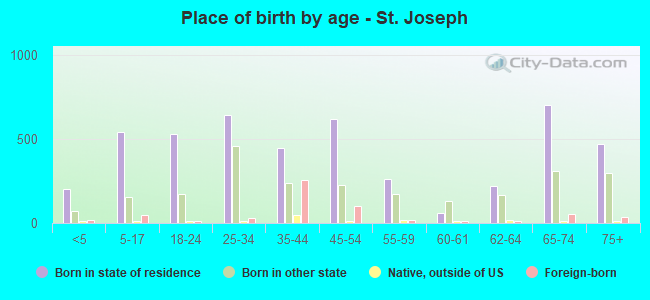
Place of birth - Born in state of residence (%)
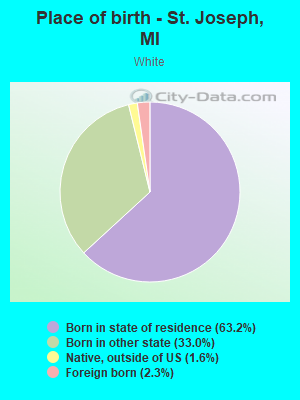
Place of birth - Born in state of residence (%) - White
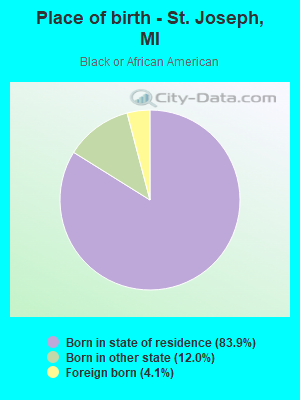
Place of birth - Born in state of residence (%) - Black or African American
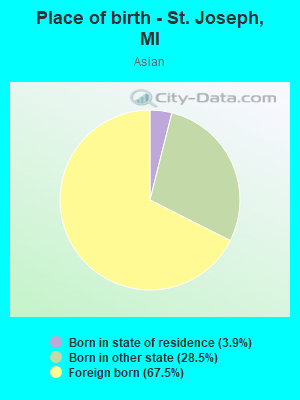
Place of birth - Born in state of residence (%) - Asian
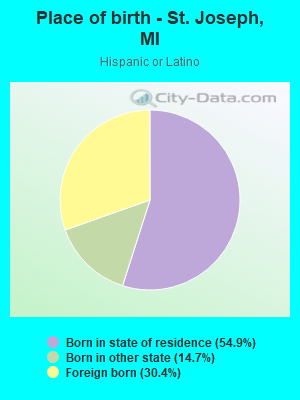
Place of birth - Born in state of residence (%) - Hispanic or Latino
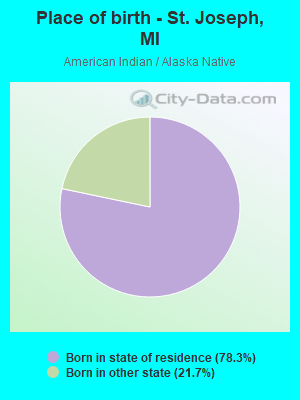
Place of birth - Born in state of residence (%) - American Indian and Alaska Native
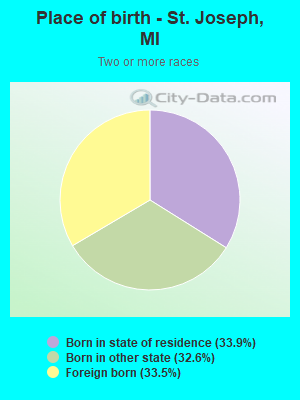
Place of birth - Born in state of residence (%) - Multirace
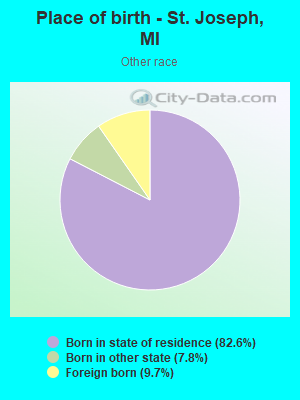
Place of birth - Born in state of residence (%) - Other Race
Place of birth - Born in other state (%)
Place of birth - Born in other state (%) - White
Place of birth - Born in other state (%) - Black or African American
Place of birth - Born in other state (%) - Asian
Place of birth - Born in other state (%) - Hispanic or Latino
Place of birth - Born in other state (%) - American Indian and Alaska Native
Place of birth - Born in other state (%) - Multirace
Place of birth - Born in other state (%) - Other Race
Place of birth - Native, outside of US (%)
Place of birth - Native, outside of US (%) - White
Place of birth - Native, outside of US (%) - Black or African American
Place of birth - Native, outside of US (%) - Asian
Place of birth - Native, outside of US (%) - Hispanic or Latino
Place of birth - Native, outside of US (%) - American Indian and Alaska Native
Place of birth - Native, outside of US (%) - Multirace
Place of birth - Native, outside of US (%) - Other Race
Place of birth - Foreign born (%)
Place of birth - Foreign born (%) - White
Place of birth - Foreign born (%) - Black or African American
Place of birth - Foreign born (%) - Asian
Place of birth - Foreign born (%) - Hispanic or Latino
Place of birth - Foreign born (%) - American Indian and Alaska Native
Place of birth - Foreign born (%) - Multirace
Place of birth - Foreign born (%) - Other Race
Residents speaking English at home (%)
Residents speaking English at home - Born in the United States (%)
Residents speaking English at home - Native, born elsewhere (%)
Residents speaking English at home - Foreign born (%)
Residents speaking Spanish at home (%)
Residents speaking Spanish at home - Born in the United States (%)
Residents speaking Spanish at home - Native, born elsewhere (%)
Residents speaking Spanish at home - Foreign born (%)
Residents speaking other language at home (%)
Residents speaking other language at home - Born in the United States (%)
Residents speaking other language at home - Native, born elsewhere (%)
Residents speaking other language at home - Foreign born (%)
Marital status - Never married (%)
Marital status - Now married (%)
Marital status - Separated (%)
Marital status - Widowed (%)
Marital status - Divorced (%)
Ancestries Reported - Arab (%)
Ancestries Reported - Czech (%)
Ancestries Reported - Danish (%)
Ancestries Reported - Dutch (%)
Ancestries Reported - English (%)
Ancestries Reported - French (%)
Ancestries Reported - French Canadian (%)
Ancestries Reported - German (%)
Ancestries Reported - Greek (%)
Ancestries Reported - Hungarian (%)
Ancestries Reported - Irish (%)
Ancestries Reported - Italian (%)
Ancestries Reported - Lithuanian (%)
Ancestries Reported - Norwegian (%)
Ancestries Reported - Polish (%)
Ancestries Reported - Portuguese (%)
Ancestries Reported - Russian (%)
Ancestries Reported - Scotch-Irish (%)
Ancestries Reported - Scottish (%)
Ancestries Reported - Slovak (%)
Ancestries Reported - Subsaharan African (%)
Ancestries Reported - Swedish (%)
Ancestries Reported - Swiss (%)
Ancestries Reported - Ukrainian (%)
Ancestries Reported - United States (%)
Ancestries Reported - Welsh (%)
Ancestries Reported - West Indian (%)
Ancestries Reported - Other (%)
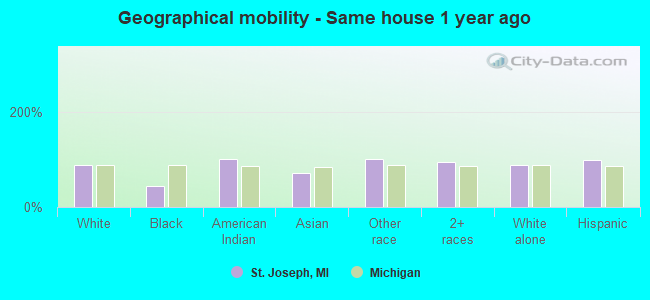
Geographical mobility - Same house 1 year ago (%)
Geographical mobility - Same house 1 year ago (%) - White
Geographical mobility - Same house 1 year ago (%) - Black or African American
Geographical mobility - Same house 1 year ago (%) - Asian
Geographical mobility - Same house 1 year ago (%) - Hispanic or Latino
Geographical mobility - Same house 1 year ago (%) - American Indian and Alaska Native
Geographical mobility - Same house 1 year ago (%) - Multirace
Geographical mobility - Same house 1 year ago (%) - Other Race
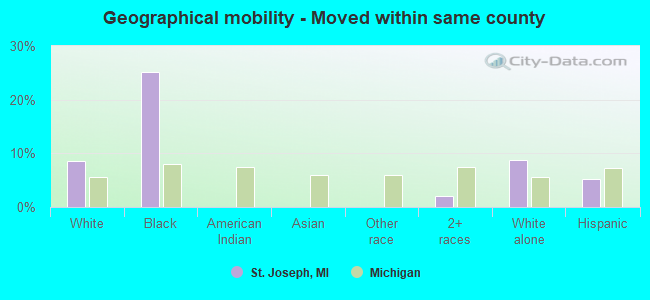
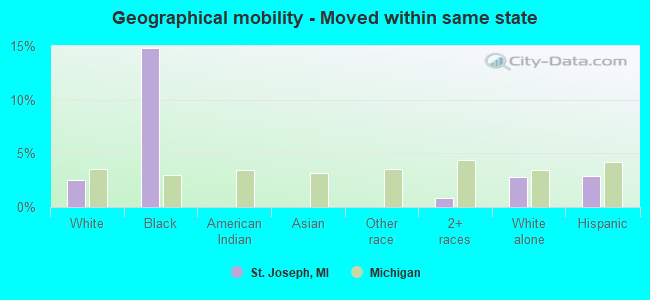
Geographical mobility - Moved within same county (%)
Geographical mobility - Moved within same county (%) - White
Geographical mobility - Moved within same county (%) - Black or African American
Geographical mobility - Moved within same county (%) - Asian
Geographical mobility - Moved within same county (%) - Hispanic or Latino
Geographical mobility - Moved within same county (%) - American Indian and Alaska Native
Geographical mobility - Moved within same county (%) - Multirace
Geographical mobility - Moved within same county (%) - Other Race
Geographical mobility - Moved from different county within same state (%)
Geographical mobility - Moved from different county within same state (%) - White
Geographical mobility - Moved from different county within same state (%) - Black or African American
Geographical mobility - Moved from different county within same state (%) - Asian
Geographical mobility - Moved from different county within same state (%) - Hispanic or Latino
Geographical mobility - Moved from different county within same state (%) - American Indian and Alaska Native
Geographical mobility - Moved from different county within same state (%) - Multirace
Geographical mobility - Moved from different county within same state (%) - Other Race
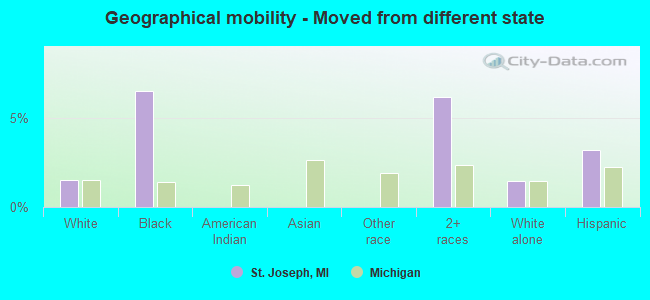
Geographical mobility - Moved from different state (%)
Geographical mobility - Moved from different state (%) - White
Geographical mobility - Moved from different state (%) - Black or African American
Geographical mobility - Moved from different state (%) - Asian
Geographical mobility - Moved from different state (%) - Hispanic or Latino
Geographical mobility - Moved from different state (%) - American Indian and Alaska Native
Geographical mobility - Moved from different state (%) - Multirace
Geographical mobility - Moved from different state (%) - Other Race
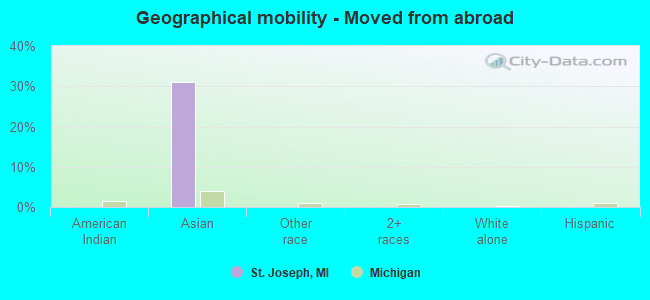
Geographical mobility - Moved from abroad (%)
Geographical mobility - Moved from abroad (%) - White
Geographical mobility - Moved from abroad (%) - Black or African American
Geographical mobility - Moved from abroad (%) - Asian
Geographical mobility - Moved from abroad (%) - Hispanic or Latino
Geographical mobility - Moved from abroad (%) - American Indian and Alaska Native
Geographical mobility - Moved from abroad (%) - Multirace
Geographical mobility - Moved from abroad (%) - Other Race
Place of birth for the foreign-born population - Ireland (%)
Place of birth for the foreign-born population - Denmark (%)
Place of birth for the foreign-born population - Norway (%)
Place of birth for the foreign-born population - Sweden (%)
Place of birth for the foreign-born population - United Kingdom (%)
Place of birth for the foreign-born population - England (%)
Place of birth for the foreign-born population - Scotland (%)
Place of birth for the foreign-born population - Other Northern Europe (%)
Place of birth for the foreign-born population - Austria (%)
Place of birth for the foreign-born population - Belgium (%)
Place of birth for the foreign-born population - France (%)
Place of birth for the foreign-born population - Germany (%)
Place of birth for the foreign-born population - Netherlands (%)
Place of birth for the foreign-born population - Switzerland (%)
Place of birth for the foreign-born population - Other Western Europe (%)
Place of birth for the foreign-born population - Greece (%)
Place of birth for the foreign-born population - Italy (%)
Place of birth for the foreign-born population - Portugal (%)
Place of birth for the foreign-born population - Spain (%)
Place of birth for the foreign-born population - Other Southern Europe (%)
Place of birth for the foreign-born population - Albania (%)
Place of birth for the foreign-born population - Belarus (%)
Place of birth for the foreign-born population - Bosnia and Herzegovina (%)
Place of birth for the foreign-born population - Bulgaria (%)
Place of birth for the foreign-born population - Croatia (%)
Place of birth for the foreign-born population - Czechoslovakia (%)
Place of birth for the foreign-born population - Hungary (%)
Place of birth for the foreign-born population - Latvia (%)
Place of birth for the foreign-born population - Lithuania (%)
Place of birth for the foreign-born population - North Macedonia (Macedonia) (%)
Place of birth for the foreign-born population - Moldova (%)
Place of birth for the foreign-born population - Poland (%)
Place of birth for the foreign-born population - Romania (%)
Place of birth for the foreign-born population - Russia (%)
Place of birth for the foreign-born population - Serbia (%)
Place of birth for the foreign-born population - Ukraine (%)
Place of birth for the foreign-born population - Other Eastern Europe (%)
Place of birth for the foreign-born population - China (%)
Place of birth for the foreign-born population - Hong Kong (%)
Place of birth for the foreign-born population - Taiwan (%)
Place of birth for the foreign-born population - Japan (%)
Place of birth for the foreign-born population - Korea (%)
Place of birth for the foreign-born population - Other Eastern Asia (%)
Place of birth for the foreign-born population - Afghanistan (%)
Place of birth for the foreign-born population - Bangladesh (%)
Place of birth for the foreign-born population - India (%)
Place of birth for the foreign-born population - Iran (%)
Place of birth for the foreign-born population - Kazakhstan (%)
Place of birth for the foreign-born population - Nepal (%)
Place of birth for the foreign-born population - Pakistan (%)
Place of birth for the foreign-born population - Sri Lanka (%)
Place of birth for the foreign-born population - Uzbekistan (%)
Place of birth for the foreign-born population - Other South Central Asia (%)
Place of birth for the foreign-born population - Burma (%)
Place of birth for the foreign-born population - Cambodia (%)
Place of birth for the foreign-born population - Indonesia (%)
Place of birth for the foreign-born population - Laos (%)
Place of birth for the foreign-born population - Malaysia (%)
Place of birth for the foreign-born population - Philippines (%)
Place of birth for the foreign-born population - Singapore (%)
Place of birth for the foreign-born population - Thailand (%)
Place of birth for the foreign-born population - Vietnam (%)
Place of birth for the foreign-born population - Other South Eastern Asia (%)
Place of birth for the foreign-born population - Armenia (%)
Place of birth for the foreign-born population - Iraq (%)
Place of birth for the foreign-born population - Israel (%)
Place of birth for the foreign-born population - Jordan (%)
Place of birth for the foreign-born population - Kuwait (%)
Place of birth for the foreign-born population - Lebanon (%)
Place of birth for the foreign-born population - Saudi Arabia (%)
Place of birth for the foreign-born population - Syria (%)
Place of birth for the foreign-born population - Turkey (%)
Place of birth for the foreign-born population - Yemen (%)
Place of birth for the foreign-born population - Other Western Asia (%)
Place of birth for the foreign-born population - Eritrea (%)
Place of birth for the foreign-born population - Ethiopia (%)
Place of birth for the foreign-born population - Kenya (%)
Place of birth for the foreign-born population - Somalia (%)
Place of birth for the foreign-born population - Uganda (%)
Place of birth for the foreign-born population - Zimbabwe (%)
Place of birth for the foreign-born population - Other Eastern Africa (%)
Place of birth for the foreign-born population - Cameroon (%)
Place of birth for the foreign-born population - Congo (%)
Place of birth for the foreign-born population - Democratic Republic of Congo (Zaire) (%)
Place of birth for the foreign-born population - Other Middle Africa (%)
Place of birth for the foreign-born population - Egypt (%)
Place of birth for the foreign-born population - Morocco (%)
Place of birth for the foreign-born population - Sudan (%)
Place of birth for the foreign-born population - Other Northern Africa (%)
Place of birth for the foreign-born population - South Africa (%)
Place of birth for the foreign-born population - Other Southern Africa (%)
Place of birth for the foreign-born population - Cabo Verde (%)
Place of birth for the foreign-born population - Ghana (%)
Place of birth for the foreign-born population - Liberia (%)
Place of birth for the foreign-born population - Nigeria (%)
Place of birth for the foreign-born population - Senegal (%)
Place of birth for the foreign-born population - Sierra Leone (%)
Place of birth for the foreign-born population - Other Western Africa (%)
Place of birth for the foreign-born population - Australia (%)
Place of birth for the foreign-born population - New Zealand (%)
Place of birth for the foreign-born population - Fiji (%)
Place of birth for the foreign-born population - Micronesia (%)
Place of birth for the foreign-born population - Bahamas (%)
Place of birth for the foreign-born population - Barbados (%)
Place of birth for the foreign-born population - Cuba (%)
Place of birth for the foreign-born population - Dominica (%)
Place of birth for the foreign-born population - Dominican Republic (%)
Place of birth for the foreign-born population - Grenada (%)
Place of birth for the foreign-born population - Haiti (%)
Place of birth for the foreign-born population - Jamaica (%)
Place of birth for the foreign-born population - St. Vincent and the Grenadines (%)
Place of birth for the foreign-born population - Trinidad and Tobago (%)
Place of birth for the foreign-born population - West Indies (%)
Place of birth for the foreign-born population - Other Caribbean (%)
Place of birth for the foreign-born population - Belize (%)
Place of birth for the foreign-born population - Costa Rica (%)
Place of birth for the foreign-born population - El Salvador (%)
Place of birth for the foreign-born population - Guatemala (%)
Place of birth for the foreign-born population - Honduras (%)
Place of birth for the foreign-born population - Mexico (%)
Place of birth for the foreign-born population - Nicaragua (%)
Place of birth for the foreign-born population - Panama (%)
Place of birth for the foreign-born population - Other Central America (%)
Place of birth for the foreign-born population - Argentina (%)
Place of birth for the foreign-born population - Bolivia (%)
Place of birth for the foreign-born population - Brazil (%)
Place of birth for the foreign-born population - Chile (%)
Place of birth for the foreign-born population - Colombia (%)
Place of birth for the foreign-born population - Ecuador (%)
Place of birth for the foreign-born population - Guyana (%)
Place of birth for the foreign-born population - Peru (%)
Place of birth for the foreign-born population - Uruguay (%)
Place of birth for the foreign-born population - Venezuela (%)
Place of birth for the foreign-born population - Other South America (%)
Place of birth for the foreign-born population - Canada (%)
Place of birth for the foreign-born population - Other Northern America (%)
Place of birth for the foreign-born population - Other (%)
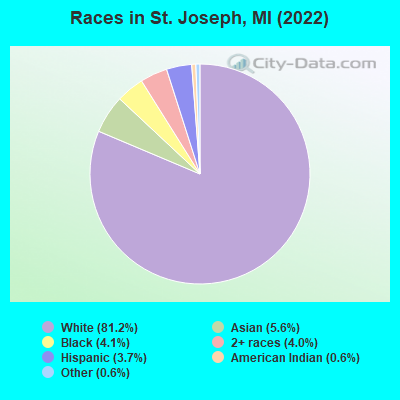
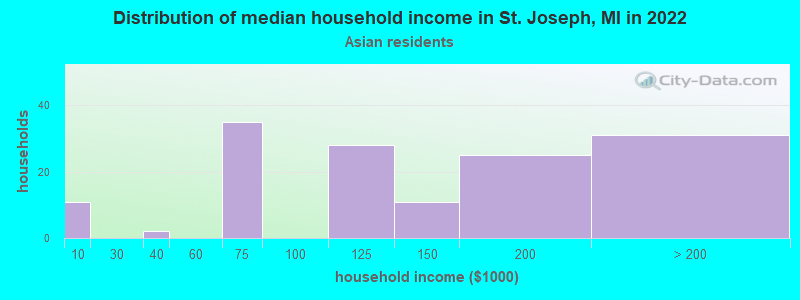
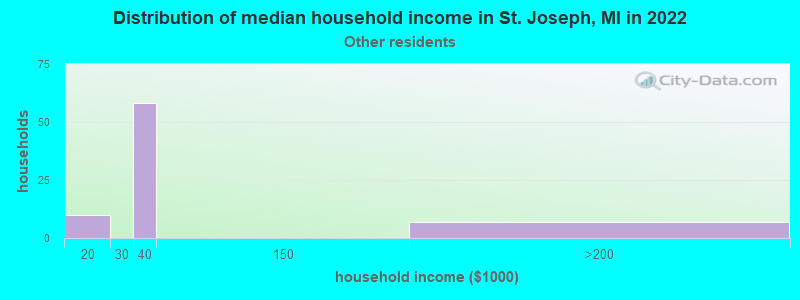
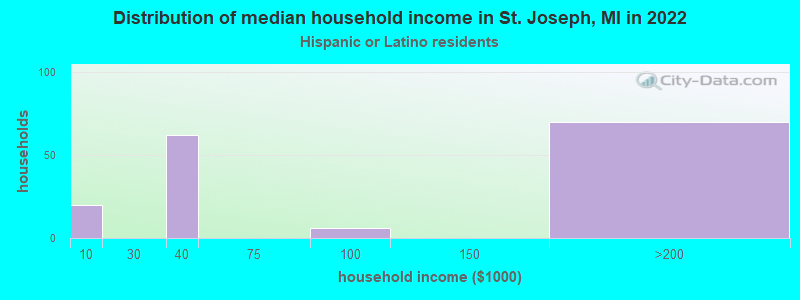
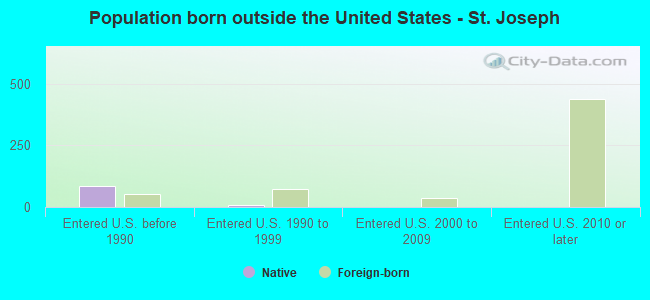
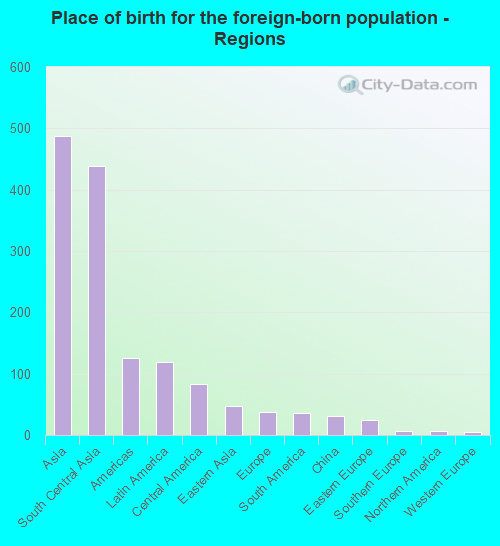
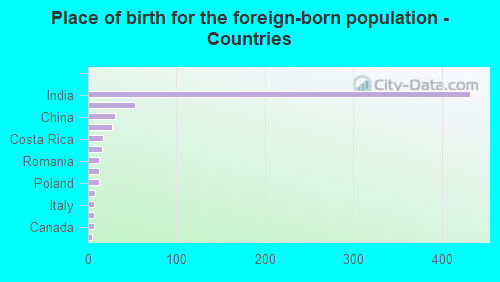
According to 2022 data, the most numerous races in St. Joseph, MI are White alone (6,329 residents), Black alone (322 residents), and Hispanic (290 residents). 90.7% of St. Joseph residents speak English at home. 8.3% of St. Joseph, MI residents are foreign-born (6.2% born in Asia, 1.5% born in Latin America), which is 28.0% greater than the foreign-born rate of 6.0% across the entire state of Michigan.
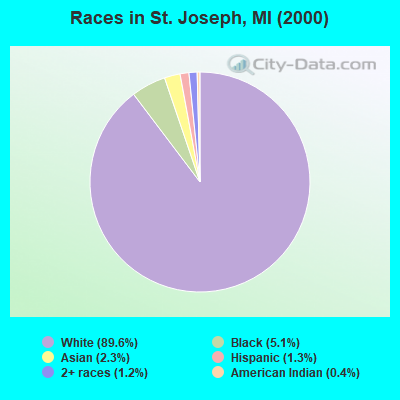
Race distribution in St. Joseph
2000 2022
7,806,691 78.6% White alone 1,402,047 14.1% Black alone 323,877 3.3% Hispanic 175,311 1.8% Asian alone 163,487 1.6% Two or more races 53,421 0.5% American Indian alone 11,465 0.1% Other race alone 2,145 0.02% Native Hawaiian and Other
7,289,051 72.6% White alone 1,310,464 13.1% Black alone 572,405 5.7% Hispanic 450,031 4.5% Two or more races 335,732 3.3% Asian alone 45,217 0.5% Other race alone 29,011 0.3% American Indian alone 2,207 0.02% Native Hawaiian and Other
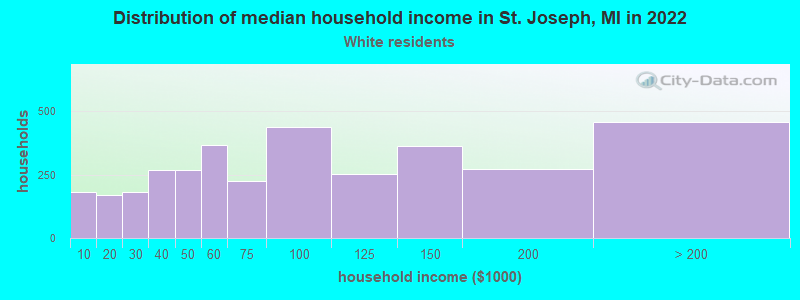
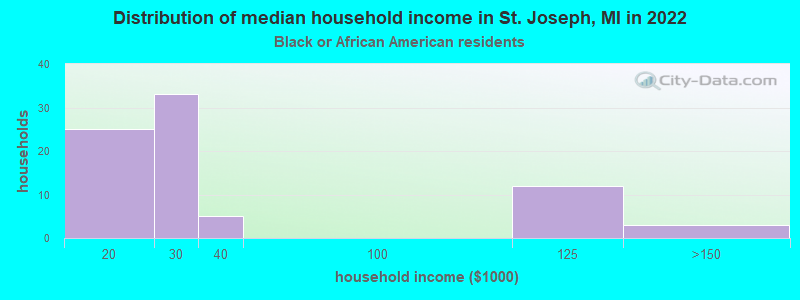
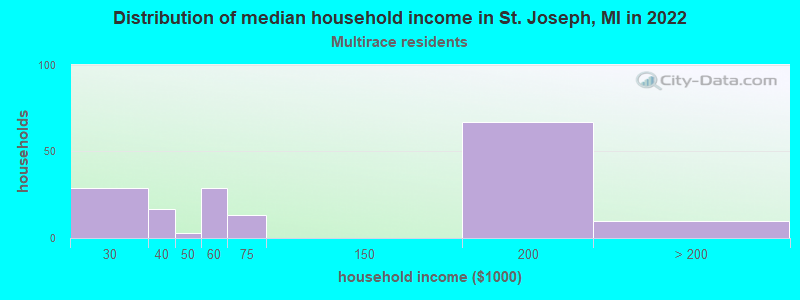
Income and house value in St. Joseph Median household income in 2022 $78,795 White non-Hispanic householders$20,708 Black householders$182,564 Asian householders$35,290 Some other race householdersMedian 2022 house value $282,246 White Non-Hispanic householders$633,787 Black or African American householders$263,655 Two or more races householders
Median age by race in St. Joseph
48.1 Median age for White residents46.3 49.7 45.4 Median age for Black or African American residents46.6 44.9 7.5 Median age for American Indian / Alaska Native residents10.6 -519,262,981.1 38.3 Median age for Asian residents36.4 38.3 -670,531,400.3 Median age for Native Hawaiian / Pacific Islander residents-666,666,666.0 -666,666,666.0 20.1 Median age for Other race residents-609,053,497.3 18.8 49.2 Median age for Two or more races residents19.5 48.4 47.8 Median age for White alone residents46.3 49.6 23.5 Median age for Hispanic or Latino residents8.1 29.4
Owner/renter occupied households by race in St. Joseph
House owners and renters - White residents 2,316 68.1% Owner occupied1,083 31.9% Renter occupiedHouse owners and renters - Black or African American residents 7 6.9% Owner occupied89 93.1% Renter occupiedHouse owners and renters - American Indian / Alaska Native residents 16 100.0% Owner occupiedHouse owners and renters - Asian residents 74 65.6% Owner occupied38 34.4% Renter occupiedHouse owners and renters - Other race residents 32 21.1% Owner occupied119 78.9% Renter occupiedHouse owners and renters - Two or more races residents 140 77.2% Owner occupied41 22.8% Renter occupiedHouse owners and renters - White alone residents 2,342 68.3% Owner occupied1,087 31.7% Renter occupiedHouse owners and renters - Hispanic or Latino residents 45 32.2% Owner occupied95 67.8% Renter occupied
Language usage in St. Joseph
English speakers - Total 90.7% of residents of St. Joseph speak English at home.
1.6% of residents speak Spanish at home 115 94.3% Speak English very well7 5.7% Speak English less than very well6.5% of residents speak other language at home 398 81.9% Speak English very well88 18.1% Speak English less than very well
English speakers - Born in the United States 97.3% of residents of St. Joseph speak English at home.
0.6% of residents speak Spanish at home 13 100.0% Speak English very well1.5% of residents speak other language at home 34 100.0% Speak English very well
English speakers - Native, born elsewhere 88.8% of residents of St. Joseph speak English at home.
English speakers - Foreign-born 8.9% of residents of St. Joseph speak English at home.
6.5% of residents speak Spanish at home 38 100.0% Speak English very well72.9% of residents speak other language at home 328 77.4% Speak English very well96 22.6% Speak English less than very well
White (Caucasian) - Speak only English Native:
99.3% (5,904)Foreign-born:
10.9% (15)
White (Caucasian) - Speak another language Native:
0.9% (56)Foreign-born:
69.7% (98)
Asian - Speak only English Native:
42.4% (48)Foreign-born:
4.3% (11)
Asian - Speak another language Native:
65.3% (74)Foreign-born:
100.0% (258)
Other race - Speak another language Native:
9.9% (12)Foreign-born:
58.7% (12)
Two or more races - Speak only English Native:
97.8% (238)Foreign-born:
12.4% (19)
Two or more races - Speak another language Native:
2.9% (7)Foreign-born:
88.7% (135)
White alone - Speak only English Native:
99.0% (5,919)Foreign-born:
11.2% (18)
White alone - Speak another language Native:
1.0% (59)Foreign-born:
70.0% (110)
Hispanic or Latino - Speak another language Native:
19.4% (34)Foreign-born:
97.5% (78)
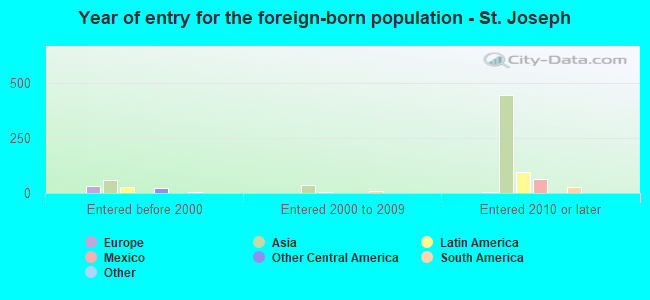
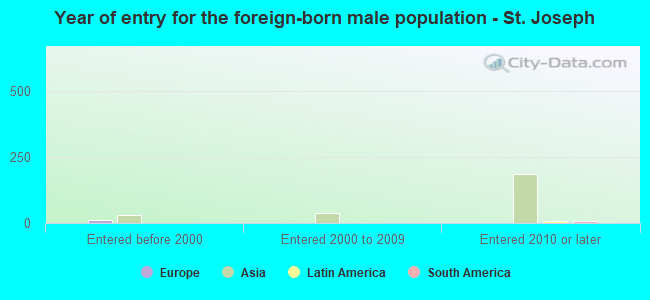
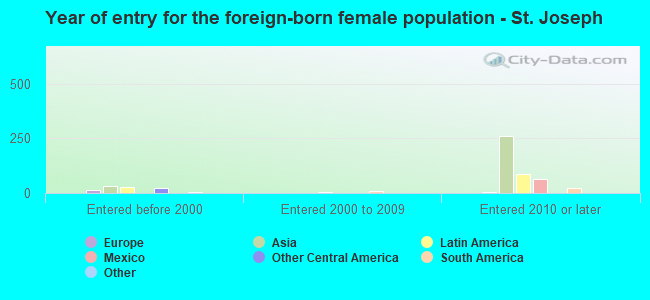
Foreign-born residents in St. Joseph 650 residents are foreign born (6.2% Asia , 1.5% Latin America ).
This city:
8.3%Michigan:
6.9%
Marital status for residents in St. Joseph Marital status - White (Caucasian) population 15 years and over
Males 35.2% Never married48.7% Now married0.3% Separated3.6% Widowed12.2% DivorcedFemales 27.8% Never married43.5% Now married0.8% Separated11.9% Widowed16.0% DivorcedWomen who gave birth in the past 12 months Now married:
44.2% (21)Unmarried:
55.8% (27)
Women who did not give birth in the past 12 months Now married:
39.3% (459)Unmarried:
60.7% (707)
Marital status - Black or African American population 15 years and over
Males 45.6% Never married26.7% Now married3.4% Separated0.0% Widowed24.3% DivorcedFemales 60.3% Never married20.7% Now married9.9% Separated0.0% Widowed9.1% DivorcedWomen who did not give birth in the past 12 months Now married:
14.5% (12)Unmarried:
85.5% (71)
Marital status - American Indian / Alaska Native population 15 years and over
Males 0.0% Never married100.0% Now married0.0% Separated0.0% Widowed0.0% DivorcedFemales 0.0% Never married100.0% Now married0.0% Separated0.0% Widowed0.0% DivorcedWomen who did not give birth in the past 12 months Now married:
100.0% (17)Unmarried:
0.0% (0)
Marital status - Asian population 15 years and over
Males 15.4% Never married84.6% Now married0.0% Separated0.0% Widowed0.0% DivorcedFemales 0.0% Never married68.5% Now married0.0% Separated29.6% Widowed1.9% DivorcedWomen who gave birth in the past 12 months Now married:
100.0% (14)Unmarried:
0.0% (0)
Women who did not give birth in the past 12 months Now married:
100.0% (47)Unmarried:
0.0% (0)
Marital status - Other race population 15 years and over
Males 0.0% Never married63.6% Now married0.0% Separated0.0% Widowed36.4% DivorcedFemales 78.2% Never married14.9% Now married0.0% Separated0.0% Widowed6.9% DivorcedWomen who gave birth in the past 12 months Now married:
100.0% (6)Unmarried:
0.0% (0)
Women who did not give birth in the past 12 months Now married:
0.0% (0)Unmarried:
100.0% (88)
Marital status - Two or more races population 15 years and over
Males 59.7% Never married32.3% Now married0.0% Separated8.1% Widowed0.0% DivorcedFemales 10.4% Never married83.2% Now married0.0% Separated0.0% Widowed6.4% DivorcedWomen who gave birth in the past 12 months Now married:
100.0% (6)Unmarried:
0.0% (0)
Women who did not give birth in the past 12 months Now married:
88.1% (200)Unmarried:
11.9% (27)
Marital status - White alone, not Hispanic / Latino population 15 years and over
Males 35.4% Never married48.4% Now married0.3% Separated3.6% Widowed12.3% DivorcedFemales 28.1% Never married43.6% Now married0.2% Separated12.0% Widowed16.2% DivorcedWomen who gave birth in the past 12 months Now married:
37.0% (16)Unmarried:
63.0% (27)
Women who did not give birth in the past 12 months Now married:
38.3% (447)Unmarried:
61.7% (721)
Marital status - Hispanic or Latino population 15 years and over
Males 44.8% Never married55.2% Now married0.0% Separated0.0% Widowed0.0% DivorcedFemales 40.5% Never married45.8% Now married10.1% Separated0.0% Widowed3.6% DivorcedWomen who gave birth in the past 12 months Now married:
100.0% (12)Unmarried:
0.0% (0)
Women who did not give birth in the past 12 months Now married:
50.3% (83)Unmarried:
49.7% (82)
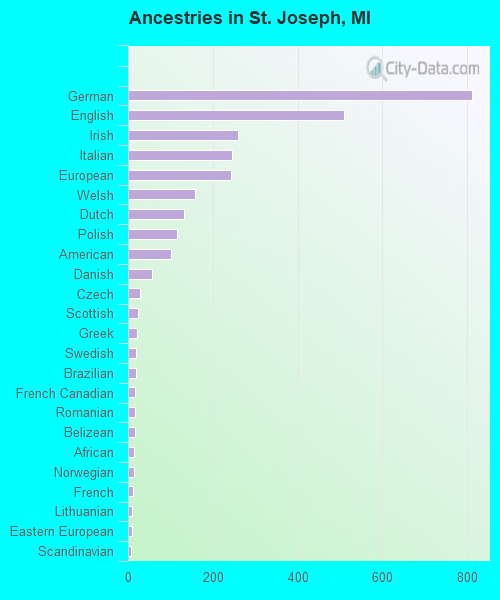
Ancestries in St. Joseph
811 20.1% German510 12.6% English260 6.4% Irish246 6.1% Italian242 6.0% European159 3.9% Welsh133 3.3% Dutch115 2.9% Polish102 2.5% American56 1.4% Danish29 0.7% Czech24 0.6% Scottish21 0.5% Greek19 0.5% Swedish18 0.4% Brazilian17 0.4% French Canadian16 0.4% Romanian16 0.4% Belizean15 0.4% African13 0.3% Norwegian11 0.3% French10 0.2% Lithuanian9 0.2% Eastern European8 0.2% Scandinavian6 0.1% Serbian4 0.10% Russian3 0.07% Scotch-Irish
Children Nativity (place of birth) in St. Joseph
Children under 6 years - Living with two parents Both parents native 381 100.0% Native0 0.0% Foreign-bornBoth parents foreign-born 30 66.0% Native16 34.0% Foreign-bornOne native, one foreign-born parent 6 100.0% NativeChildren under 6 years - Living with one parent Native parent 15 100.0% Native
Children 6 to 17 years - Living with two parents Both parents native 418 100.0% NativeBoth parents foreign-born 112 100.0% Foreign-bornOne native, one foreign-born parent 56 100.0% NativeChildren 6 to 17 years - Living with one parent Native parent 57 100.0% Native