Races in St. Robert, Missouri (MO) Detailed Stats
Data:
Races - White alone (%)
Races - White alone (% change since 2000)
Races - Black alone (%)
Races - Black alone (% change since 2000)
Races - American Indian alone (%)
Races - American Indian alone (% change since 2000)
Races - Asian alone (%)
Races - Asian alone (% change since 2000)
Races - Hispanic (%)
Races - Hispanic (% change since 2000)
Races - Native Hawaiian and Other Pacific Islander alone (%)
Races - Native Hawaiian and Other Pacific Islander alone (% change since 2000)
Races - Two or more races(%)
Races - Two or more races(% change since 2000)
Races - Other race alone (%)
Races - Other race alone (% change since 2000)
Racial diversity
Place of birth - Born in state of residence (%)
Place of birth - Born in state of residence (%) - White
Place of birth - Born in state of residence (%) - Black or African American
Place of birth - Born in state of residence (%) - Asian
Place of birth - Born in state of residence (%) - Hispanic or Latino
Place of birth - Born in state of residence (%) - American Indian and Alaska Native
Place of birth - Born in state of residence (%) - Multirace
Place of birth - Born in state of residence (%) - Other Race
Place of birth - Born in other state (%)
Place of birth - Born in other state (%) - White
Place of birth - Born in other state (%) - Black or African American
Place of birth - Born in other state (%) - Asian
Place of birth - Born in other state (%) - Hispanic or Latino
Place of birth - Born in other state (%) - American Indian and Alaska Native
Place of birth - Born in other state (%) - Multirace
Place of birth - Born in other state (%) - Other Race
Place of birth - Native, outside of US (%)
Place of birth - Native, outside of US (%) - White
Place of birth - Native, outside of US (%) - Black or African American
Place of birth - Native, outside of US (%) - Asian
Place of birth - Native, outside of US (%) - Hispanic or Latino
Place of birth - Native, outside of US (%) - American Indian and Alaska Native
Place of birth - Native, outside of US (%) - Multirace
Place of birth - Native, outside of US (%) - Other Race
Place of birth - Foreign born (%)
Place of birth - Foreign born (%) - White
Place of birth - Foreign born (%) - Black or African American
Place of birth - Foreign born (%) - Asian
Place of birth - Foreign born (%) - Hispanic or Latino
Place of birth - Foreign born (%) - American Indian and Alaska Native
Place of birth - Foreign born (%) - Multirace
Place of birth - Foreign born (%) - Other Race
Residents speaking English at home (%)
Residents speaking English at home - Born in the United States (%)
Residents speaking English at home - Native, born elsewhere (%)
Residents speaking English at home - Foreign born (%)
Residents speaking Spanish at home (%)
Residents speaking Spanish at home - Born in the United States (%)
Residents speaking Spanish at home - Native, born elsewhere (%)
Residents speaking Spanish at home - Foreign born (%)
Residents speaking other language at home (%)
Residents speaking other language at home - Born in the United States (%)
Residents speaking other language at home - Native, born elsewhere (%)
Residents speaking other language at home - Foreign born (%)
Marital status - Never married (%)
Marital status - Now married (%)
Marital status - Separated (%)
Marital status - Widowed (%)
Marital status - Divorced (%)
Ancestries Reported - Arab (%)
Ancestries Reported - Czech (%)
Ancestries Reported - Danish (%)
Ancestries Reported - Dutch (%)
Ancestries Reported - English (%)
Ancestries Reported - French (%)
Ancestries Reported - French Canadian (%)
Ancestries Reported - German (%)
Ancestries Reported - Greek (%)
Ancestries Reported - Hungarian (%)
Ancestries Reported - Irish (%)
Ancestries Reported - Italian (%)
Ancestries Reported - Lithuanian (%)
Ancestries Reported - Norwegian (%)
Ancestries Reported - Polish (%)
Ancestries Reported - Portuguese (%)
Ancestries Reported - Russian (%)
Ancestries Reported - Scotch-Irish (%)
Ancestries Reported - Scottish (%)
Ancestries Reported - Slovak (%)
Ancestries Reported - Subsaharan African (%)
Ancestries Reported - Swedish (%)
Ancestries Reported - Swiss (%)
Ancestries Reported - Ukrainian (%)
Ancestries Reported - United States (%)
Ancestries Reported - Welsh (%)
Ancestries Reported - West Indian (%)
Ancestries Reported - Other (%)
Geographical mobility - Same house 1 year ago (%)
Geographical mobility - Same house 1 year ago (%) - White
Geographical mobility - Same house 1 year ago (%) - Black or African American
Geographical mobility - Same house 1 year ago (%) - Asian
Geographical mobility - Same house 1 year ago (%) - Hispanic or Latino
Geographical mobility - Same house 1 year ago (%) - American Indian and Alaska Native
Geographical mobility - Same house 1 year ago (%) - Multirace
Geographical mobility - Same house 1 year ago (%) - Other Race
Geographical mobility - Moved within same county (%)
Geographical mobility - Moved within same county (%) - White
Geographical mobility - Moved within same county (%) - Black or African American
Geographical mobility - Moved within same county (%) - Asian
Geographical mobility - Moved within same county (%) - Hispanic or Latino
Geographical mobility - Moved within same county (%) - American Indian and Alaska Native
Geographical mobility - Moved within same county (%) - Multirace
Geographical mobility - Moved within same county (%) - Other Race
Geographical mobility - Moved from different county within same state (%)
Geographical mobility - Moved from different county within same state (%) - White
Geographical mobility - Moved from different county within same state (%) - Black or African American
Geographical mobility - Moved from different county within same state (%) - Asian
Geographical mobility - Moved from different county within same state (%) - Hispanic or Latino
Geographical mobility - Moved from different county within same state (%) - American Indian and Alaska Native
Geographical mobility - Moved from different county within same state (%) - Multirace
Geographical mobility - Moved from different county within same state (%) - Other Race
Geographical mobility - Moved from different state (%)
Geographical mobility - Moved from different state (%) - White
Geographical mobility - Moved from different state (%) - Black or African American
Geographical mobility - Moved from different state (%) - Asian
Geographical mobility - Moved from different state (%) - Hispanic or Latino
Geographical mobility - Moved from different state (%) - American Indian and Alaska Native
Geographical mobility - Moved from different state (%) - Multirace
Geographical mobility - Moved from different state (%) - Other Race
Geographical mobility - Moved from abroad (%)
Geographical mobility - Moved from abroad (%) - White
Geographical mobility - Moved from abroad (%) - Black or African American
Geographical mobility - Moved from abroad (%) - Asian
Geographical mobility - Moved from abroad (%) - Hispanic or Latino
Geographical mobility - Moved from abroad (%) - American Indian and Alaska Native
Geographical mobility - Moved from abroad (%) - Multirace
Geographical mobility - Moved from abroad (%) - Other Race
Place of birth for the foreign-born population - Ireland (%)
Place of birth for the foreign-born population - Denmark (%)
Place of birth for the foreign-born population - Norway (%)
Place of birth for the foreign-born population - Sweden (%)
Place of birth for the foreign-born population - United Kingdom (%)
Place of birth for the foreign-born population - England (%)
Place of birth for the foreign-born population - Scotland (%)
Place of birth for the foreign-born population - Other Northern Europe (%)
Place of birth for the foreign-born population - Austria (%)
Place of birth for the foreign-born population - Belgium (%)
Place of birth for the foreign-born population - France (%)
Place of birth for the foreign-born population - Germany (%)
Place of birth for the foreign-born population - Netherlands (%)
Place of birth for the foreign-born population - Switzerland (%)
Place of birth for the foreign-born population - Other Western Europe (%)
Place of birth for the foreign-born population - Greece (%)
Place of birth for the foreign-born population - Italy (%)
Place of birth for the foreign-born population - Portugal (%)
Place of birth for the foreign-born population - Spain (%)
Place of birth for the foreign-born population - Other Southern Europe (%)
Place of birth for the foreign-born population - Albania (%)
Place of birth for the foreign-born population - Belarus (%)
Place of birth for the foreign-born population - Bosnia and Herzegovina (%)
Place of birth for the foreign-born population - Bulgaria (%)
Place of birth for the foreign-born population - Croatia (%)
Place of birth for the foreign-born population - Czechoslovakia (%)
Place of birth for the foreign-born population - Hungary (%)
Place of birth for the foreign-born population - Latvia (%)
Place of birth for the foreign-born population - Lithuania (%)
Place of birth for the foreign-born population - North Macedonia (Macedonia) (%)
Place of birth for the foreign-born population - Moldova (%)
Place of birth for the foreign-born population - Poland (%)
Place of birth for the foreign-born population - Romania (%)
Place of birth for the foreign-born population - Russia (%)
Place of birth for the foreign-born population - Serbia (%)
Place of birth for the foreign-born population - Ukraine (%)
Place of birth for the foreign-born population - Other Eastern Europe (%)
Place of birth for the foreign-born population - China (%)
Place of birth for the foreign-born population - Hong Kong (%)
Place of birth for the foreign-born population - Taiwan (%)
Place of birth for the foreign-born population - Japan (%)
Place of birth for the foreign-born population - Korea (%)
Place of birth for the foreign-born population - Other Eastern Asia (%)
Place of birth for the foreign-born population - Afghanistan (%)
Place of birth for the foreign-born population - Bangladesh (%)
Place of birth for the foreign-born population - India (%)
Place of birth for the foreign-born population - Iran (%)
Place of birth for the foreign-born population - Kazakhstan (%)
Place of birth for the foreign-born population - Nepal (%)
Place of birth for the foreign-born population - Pakistan (%)
Place of birth for the foreign-born population - Sri Lanka (%)
Place of birth for the foreign-born population - Uzbekistan (%)
Place of birth for the foreign-born population - Other South Central Asia (%)
Place of birth for the foreign-born population - Burma (%)
Place of birth for the foreign-born population - Cambodia (%)
Place of birth for the foreign-born population - Indonesia (%)
Place of birth for the foreign-born population - Laos (%)
Place of birth for the foreign-born population - Malaysia (%)
Place of birth for the foreign-born population - Philippines (%)
Place of birth for the foreign-born population - Singapore (%)
Place of birth for the foreign-born population - Thailand (%)
Place of birth for the foreign-born population - Vietnam (%)
Place of birth for the foreign-born population - Other South Eastern Asia (%)
Place of birth for the foreign-born population - Armenia (%)
Place of birth for the foreign-born population - Iraq (%)
Place of birth for the foreign-born population - Israel (%)
Place of birth for the foreign-born population - Jordan (%)
Place of birth for the foreign-born population - Kuwait (%)
Place of birth for the foreign-born population - Lebanon (%)
Place of birth for the foreign-born population - Saudi Arabia (%)
Place of birth for the foreign-born population - Syria (%)
Place of birth for the foreign-born population - Turkey (%)
Place of birth for the foreign-born population - Yemen (%)
Place of birth for the foreign-born population - Other Western Asia (%)
Place of birth for the foreign-born population - Eritrea (%)
Place of birth for the foreign-born population - Ethiopia (%)
Place of birth for the foreign-born population - Kenya (%)
Place of birth for the foreign-born population - Somalia (%)
Place of birth for the foreign-born population - Uganda (%)
Place of birth for the foreign-born population - Zimbabwe (%)
Place of birth for the foreign-born population - Other Eastern Africa (%)
Place of birth for the foreign-born population - Cameroon (%)
Place of birth for the foreign-born population - Congo (%)
Place of birth for the foreign-born population - Democratic Republic of Congo (Zaire) (%)
Place of birth for the foreign-born population - Other Middle Africa (%)
Place of birth for the foreign-born population - Egypt (%)
Place of birth for the foreign-born population - Morocco (%)
Place of birth for the foreign-born population - Sudan (%)
Place of birth for the foreign-born population - Other Northern Africa (%)
Place of birth for the foreign-born population - South Africa (%)
Place of birth for the foreign-born population - Other Southern Africa (%)
Place of birth for the foreign-born population - Cabo Verde (%)
Place of birth for the foreign-born population - Ghana (%)
Place of birth for the foreign-born population - Liberia (%)
Place of birth for the foreign-born population - Nigeria (%)
Place of birth for the foreign-born population - Senegal (%)
Place of birth for the foreign-born population - Sierra Leone (%)
Place of birth for the foreign-born population - Other Western Africa (%)
Place of birth for the foreign-born population - Australia (%)
Place of birth for the foreign-born population - New Zealand (%)
Place of birth for the foreign-born population - Fiji (%)
Place of birth for the foreign-born population - Micronesia (%)
Place of birth for the foreign-born population - Bahamas (%)
Place of birth for the foreign-born population - Barbados (%)
Place of birth for the foreign-born population - Cuba (%)
Place of birth for the foreign-born population - Dominica (%)
Place of birth for the foreign-born population - Dominican Republic (%)
Place of birth for the foreign-born population - Grenada (%)
Place of birth for the foreign-born population - Haiti (%)
Place of birth for the foreign-born population - Jamaica (%)
Place of birth for the foreign-born population - St. Vincent and the Grenadines (%)
Place of birth for the foreign-born population - Trinidad and Tobago (%)
Place of birth for the foreign-born population - West Indies (%)
Place of birth for the foreign-born population - Other Caribbean (%)
Place of birth for the foreign-born population - Belize (%)
Place of birth for the foreign-born population - Costa Rica (%)
Place of birth for the foreign-born population - El Salvador (%)
Place of birth for the foreign-born population - Guatemala (%)
Place of birth for the foreign-born population - Honduras (%)
Place of birth for the foreign-born population - Mexico (%)
Place of birth for the foreign-born population - Nicaragua (%)
Place of birth for the foreign-born population - Panama (%)
Place of birth for the foreign-born population - Other Central America (%)
Place of birth for the foreign-born population - Argentina (%)
Place of birth for the foreign-born population - Bolivia (%)
Place of birth for the foreign-born population - Brazil (%)
Place of birth for the foreign-born population - Chile (%)
Place of birth for the foreign-born population - Colombia (%)
Place of birth for the foreign-born population - Ecuador (%)
Place of birth for the foreign-born population - Guyana (%)
Place of birth for the foreign-born population - Peru (%)
Place of birth for the foreign-born population - Uruguay (%)
Place of birth for the foreign-born population - Venezuela (%)
Place of birth for the foreign-born population - Other South America (%)
Place of birth for the foreign-born population - Canada (%)
Place of birth for the foreign-born population - Other Northern America (%)
Place of birth for the foreign-born population - Other (%)
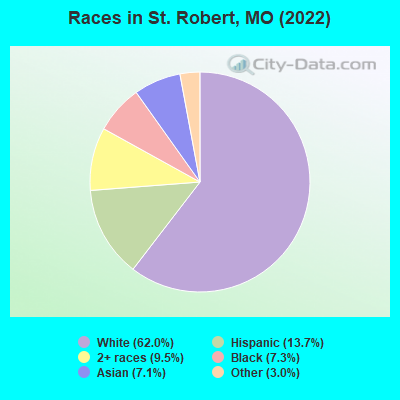
According to 2022 data, the most numerous races in St. Robert, MO are White alone (3,264 residents), Black alone (382 residents), and Two or more races (499 residents). 87.4% of St. Robert residents speak English at home. 9.8% of St. Robert, MO residents are foreign-born (6.1% born in Asia, 2.5% born in Europe), which is 59.4% greater than the foreign-born rate of 4.0% across the entire state of Missouri.
Race distribution in St. Robert
2000 2022
4,686,474 83.8% White alone 625,667 11.2% Black alone 118,592 2.1% Hispanic 71,905 1.3% Two or more races 61,041 1.1% Asian alone 23,302 0.4% American Indian alone 5,291 0.09% Other race alone 2,939 0.05% Native Hawaiian and Other
4,733,411 76.6% White alone 656,739 10.6% Black alone 316,300 5.1% Two or more races 291,763 4.7% Hispanic 132,436 2.1% Asian alone 27,467 0.4% Other race alone 12,313 0.2% American Indian alone 7,528 0.1% Native Hawaiian and Other
Income and house value in St. Robert Median household income in 2022 $75,358 White non-Hispanic householders$75,226 Asian householders$21,231 Hispanic or Latino race householdersMedian 2022 house value $291,021 White Non-Hispanic householders$296,164 Black or African American householders$680,663 American Indian or Alaska Native householders $257,139 Asian householders$347,894 Some other race householders$415,961 Two or more races householders$240,198 Hispanic or Latino householders
Median age by race in St. Robert
31.1 Median age for White residents30.9 36.6 38.3 Median age for Black or African American residents39.7 32.3 -605,424,321.4 Median age for American Indian / Alaska Native residents-652,291,104.5 -576,856,648.8 50.5 Median age for Asian residents27.2 50.5 -693,430,656.2 Median age for Native Hawaiian / Pacific Islander residents-683,513,838.1 -752,136,751.4 24.1 Median age for Other race residents21.9 41.2 14.1 Median age for Two or more races residents13.5 34.9 32.4 Median age for White alone residents31.1 36.8 23.4 Median age for Hispanic or Latino residents24.3 18.1
Owner/renter occupied households by race in St. Robert
House owners and renters - White residents 835 65.5% Owner occupied439 34.5% Renter occupiedHouse owners and renters - Black or African American residents 163 60.0% Owner occupied108 40.0% Renter occupiedHouse owners and renters - Asian residents 161 68.7% Owner occupied74 31.3% Renter occupiedHouse owners and renters - Other race residents 41 62.4% Owner occupied24 37.6% Renter occupiedHouse owners and renters - Two or more races residents 81 21.9% Owner occupied288 78.1% Renter occupiedHouse owners and renters - White alone residents 824 65.3% Owner occupied437 34.7% Renter occupiedHouse owners and renters - Hispanic or Latino residents 78 29.0% Owner occupied192 71.0% Renter occupied
Language usage in St. Robert
English speakers - Total 87.4% of residents of St. Robert speak English at home.
2.0% of residents speak Spanish at home 52 55.9% Speak English very well41 44.1% Speak English less than very well10.8% of residents speak other language at home 439 86.9% Speak English very well66 13.1% Speak English less than very well
English speakers - Born in the United States 94.5% of residents of St. Robert speak English at home.
3.3% of residents speak Spanish at home 39 50.0% Speak English very well39 50.0% Speak English less than very well2.3% of residents speak other language at home 45 81.8% Speak English very well10 18.2% Speak English less than very well
English speakers - Native, born elsewhere 90.5% of residents of St. Robert speak English at home.
10.6% of residents speak other language at home 41 100.0% Speak English very well
English speakers - Foreign-born 25.0% of residents of St. Robert speak English at home.
4.8% of residents speak Spanish at home 14 56.0% Speak English very well11 44.0% Speak English less than very well68.8% of residents speak other language at home 302 84.6% Speak English very well55 15.4% Speak English less than very well
White (Caucasian) - Speak only English Native:
97.7% (2,866)Foreign-born:
41.4% (41)
White (Caucasian) - Speak another language Native:
2.3% (66)Foreign-born:
59.0% (59)
Black or African American - Speak only English Native:
99.2% (352)Foreign-born:
100.0% (31)
Asian - Speak only English Native:
100.0% (77)Foreign-born:
10.6% (34)
Two or more races - Speak only English Native:
88.5% (681)Foreign-born:
30.4% (23)
Two or more races - Speak another language Native:
11.9% (92)Foreign-born:
55.0% (42)
White alone - Speak only English Native:
97.3% (2,796)Foreign-born:
35.4% (42)
White alone - Speak another language Native:
2.7% (79)Foreign-born:
63.7% (75)
Hispanic or Latino - Speak only English Native:
92.7% (381)Foreign-born:
50.4% (26)
Hispanic or Latino - Speak another language Native:
8.9% (37)Foreign-born:
51.7% (26)
Foreign-born residents in St. Robert 518 residents are foreign born (6.1% Asia , 2.5% Europe ).
This city:
9.8%Missouri:
4.2%
Marital status for residents in St. Robert Marital status - White (Caucasian) population 15 years and over
Males 28.5% Never married50.6% Now married5.2% Separated0.4% Widowed15.3% DivorcedFemales 20.8% Never married64.5% Now married3.4% Separated6.5% Widowed4.8% DivorcedWomen who gave birth in the past 12 months Now married:
100.0% (57)Unmarried:
0.0% (0)
Women who did not give birth in the past 12 months Now married:
67.4% (540)Unmarried:
32.6% (261)
Marital status - Black or African American population 15 years and over
Males 44.8% Never married21.8% Now married0.0% Separated27.0% Widowed6.3% DivorcedFemales 40.0% Never married60.0% Now married0.0% Separated0.0% Widowed0.0% DivorcedWomen who gave birth in the past 12 months Now married:
100.0% (34)Unmarried:
0.0% (0)
Women who did not give birth in the past 12 months Now married:
33.3% (26)Unmarried:
66.7% (53)
Marital status - Asian population 15 years and over
Males 56.1% Never married34.4% Now married0.0% Separated0.0% Widowed9.6% DivorcedFemales 0.0% Never married56.0% Now married0.0% Separated37.8% Widowed6.2% DivorcedWomen who did not give birth in the past 12 months Now married:
62.8% (87)Unmarried:
37.2% (52)
Marital status - Other race population 15 years and over
Males 61.1% Never married38.9% Now married0.0% Separated0.0% Widowed0.0% DivorcedFemales 41.5% Never married58.5% Now married0.0% Separated0.0% Widowed0.0% DivorcedWomen who did not give birth in the past 12 months Now married:
58.5% (38)Unmarried:
41.5% (27)
Marital status - Two or more races population 15 years and over
Males 14.1% Never married85.9% Now married0.0% Separated0.0% Widowed0.0% DivorcedFemales 43.0% Never married17.6% Now married0.0% Separated0.0% Widowed39.4% DivorcedWomen who did not give birth in the past 12 months Now married:
14.5% (25)Unmarried:
85.5% (146)
Marital status - White alone, not Hispanic / Latino population 15 years and over
Males 29.3% Never married49.2% Now married5.3% Separated0.4% Widowed15.7% DivorcedFemales 20.4% Never married64.8% Now married3.4% Separated6.6% Widowed4.8% DivorcedWomen who gave birth in the past 12 months Now married:
100.0% (57)Unmarried:
0.0% (0)
Women who did not give birth in the past 12 months Now married:
67.9% (545)Unmarried:
32.1% (257)
Marital status - Hispanic or Latino population 15 years and over
Males 17.7% Never married77.5% Now married0.0% Separated0.0% Widowed4.8% DivorcedFemales 33.3% Never married25.0% Now married0.0% Separated0.0% Widowed41.7% DivorcedWomen who did not give birth in the past 12 months Now married:
19.0% (9)Unmarried:
81.0% (37)
Ancestries in St. Robert
453 21.7% German296 14.1% American141 6.7% Irish107 5.1% Ghanaian82 3.9% Polish63 3.0% Italian53 2.5% English26 1.2% European12 0.6% Brazilian9 0.4% Greek8 0.4% Scottish5 0.2% Scotch-Irish
Children Nativity (place of birth) in St. Robert
Children under 6 years - Living with two parents Both parents native 521 100.0% NativeChildren under 6 years - Living with one parent Native parent 105 100.0% NativeChildren 6 to 17 years - Living with two parents Both parents native 470 100.0% NativeOne native, one foreign-born parent 70 60.6% Native45 39.4% Foreign-bornChildren 6 to 17 years - Living with one parent Native parent 131 100.0% Native