Races in Stafford, Texas (TX) Detailed Stats
Data:
Races - White alone (%)
Races - White alone (% change since 2000)
Races - Black alone (%)
Races - Black alone (% change since 2000)
Races - American Indian alone (%)
Races - American Indian alone (% change since 2000)
Races - Asian alone (%)
Races - Asian alone (% change since 2000)
Races - Hispanic (%)
Races - Hispanic (% change since 2000)
Races - Native Hawaiian and Other Pacific Islander alone (%)
Races - Native Hawaiian and Other Pacific Islander alone (% change since 2000)
Races - Two or more races(%)
Races - Two or more races(% change since 2000)
Races - Other race alone (%)
Races - Other race alone (% change since 2000)
Racial diversity
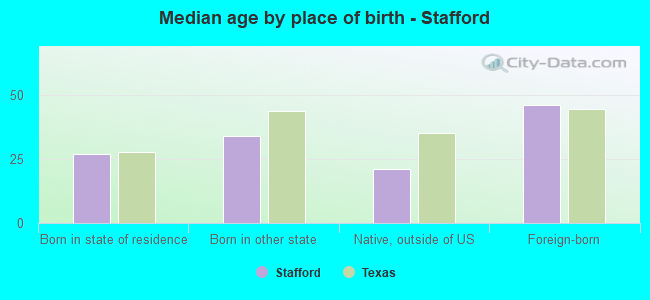
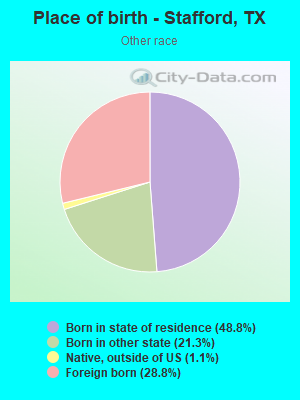
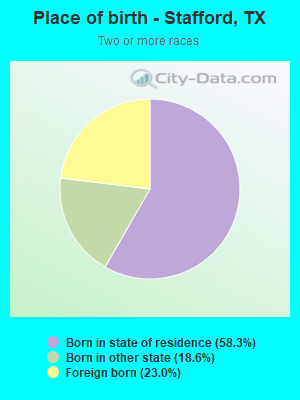
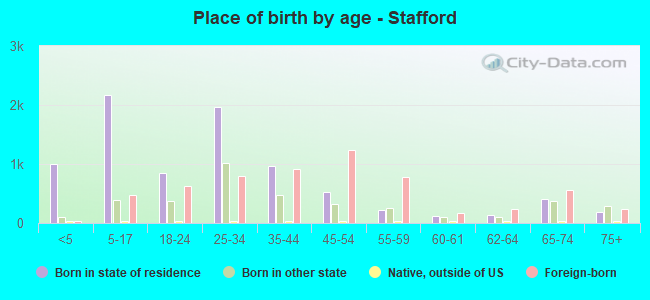
Place of birth - Born in state of residence (%)
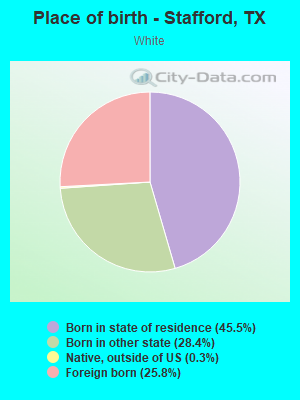
Place of birth - Born in state of residence (%) - White
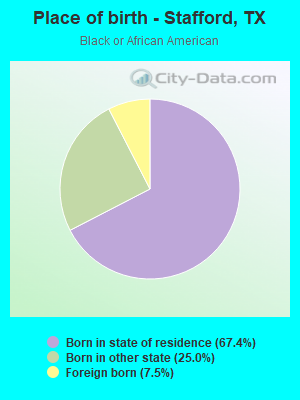
Place of birth - Born in state of residence (%) - Black or African American
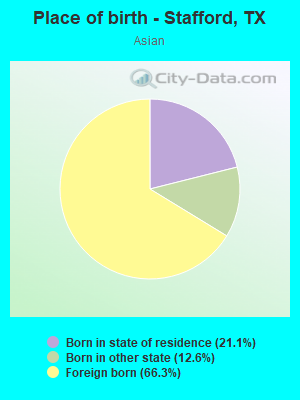
Place of birth - Born in state of residence (%) - Asian
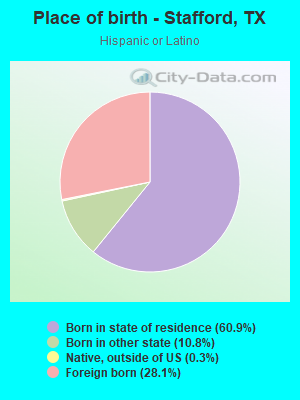
Place of birth - Born in state of residence (%) - Hispanic or Latino
Place of birth - Born in state of residence (%) - American Indian and Alaska Native
Place of birth - Born in state of residence (%) - Multirace
Place of birth - Born in state of residence (%) - Other Race
Place of birth - Born in other state (%)
Place of birth - Born in other state (%) - White
Place of birth - Born in other state (%) - Black or African American
Place of birth - Born in other state (%) - Asian
Place of birth - Born in other state (%) - Hispanic or Latino
Place of birth - Born in other state (%) - American Indian and Alaska Native
Place of birth - Born in other state (%) - Multirace
Place of birth - Born in other state (%) - Other Race
Place of birth - Native, outside of US (%)
Place of birth - Native, outside of US (%) - White
Place of birth - Native, outside of US (%) - Black or African American
Place of birth - Native, outside of US (%) - Asian
Place of birth - Native, outside of US (%) - Hispanic or Latino
Place of birth - Native, outside of US (%) - American Indian and Alaska Native
Place of birth - Native, outside of US (%) - Multirace
Place of birth - Native, outside of US (%) - Other Race
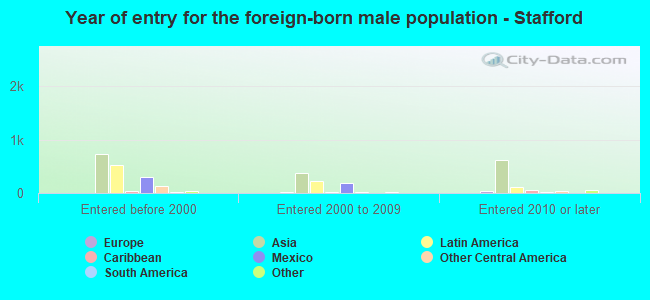
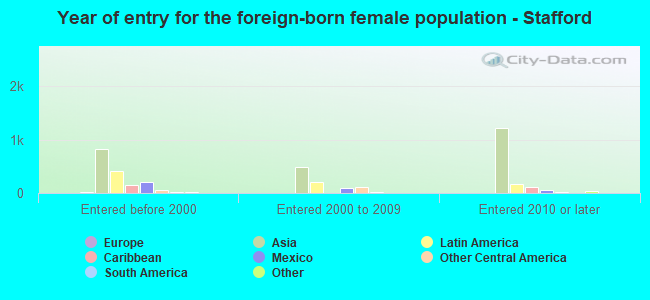
Place of birth - Foreign born (%)
Place of birth - Foreign born (%) - White
Place of birth - Foreign born (%) - Black or African American
Place of birth - Foreign born (%) - Asian
Place of birth - Foreign born (%) - Hispanic or Latino
Place of birth - Foreign born (%) - American Indian and Alaska Native
Place of birth - Foreign born (%) - Multirace
Place of birth - Foreign born (%) - Other Race
Residents speaking English at home (%)
Residents speaking English at home - Born in the United States (%)
Residents speaking English at home - Native, born elsewhere (%)
Residents speaking English at home - Foreign born (%)
Residents speaking Spanish at home (%)
Residents speaking Spanish at home - Born in the United States (%)
Residents speaking Spanish at home - Native, born elsewhere (%)
Residents speaking Spanish at home - Foreign born (%)
Residents speaking other language at home (%)
Residents speaking other language at home - Born in the United States (%)
Residents speaking other language at home - Native, born elsewhere (%)
Residents speaking other language at home - Foreign born (%)
Marital status - Never married (%)
Marital status - Now married (%)
Marital status - Separated (%)
Marital status - Widowed (%)
Marital status - Divorced (%)
Ancestries Reported - Arab (%)
Ancestries Reported - Czech (%)
Ancestries Reported - Danish (%)
Ancestries Reported - Dutch (%)
Ancestries Reported - English (%)
Ancestries Reported - French (%)
Ancestries Reported - French Canadian (%)
Ancestries Reported - German (%)
Ancestries Reported - Greek (%)
Ancestries Reported - Hungarian (%)
Ancestries Reported - Irish (%)
Ancestries Reported - Italian (%)
Ancestries Reported - Lithuanian (%)
Ancestries Reported - Norwegian (%)
Ancestries Reported - Polish (%)
Ancestries Reported - Portuguese (%)
Ancestries Reported - Russian (%)
Ancestries Reported - Scotch-Irish (%)
Ancestries Reported - Scottish (%)
Ancestries Reported - Slovak (%)
Ancestries Reported - Subsaharan African (%)
Ancestries Reported - Swedish (%)
Ancestries Reported - Swiss (%)
Ancestries Reported - Ukrainian (%)
Ancestries Reported - United States (%)
Ancestries Reported - Welsh (%)
Ancestries Reported - West Indian (%)
Ancestries Reported - Other (%)
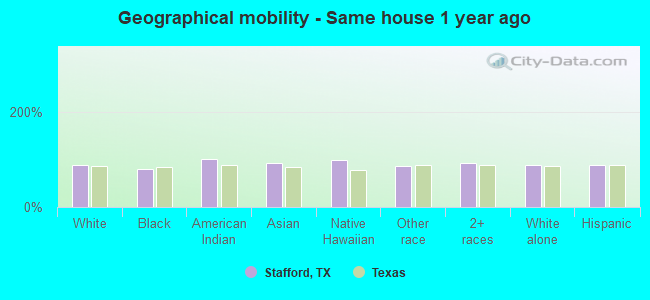
Geographical mobility - Same house 1 year ago (%)
Geographical mobility - Same house 1 year ago (%) - White
Geographical mobility - Same house 1 year ago (%) - Black or African American
Geographical mobility - Same house 1 year ago (%) - Asian
Geographical mobility - Same house 1 year ago (%) - Hispanic or Latino
Geographical mobility - Same house 1 year ago (%) - American Indian and Alaska Native
Geographical mobility - Same house 1 year ago (%) - Multirace
Geographical mobility - Same house 1 year ago (%) - Other Race
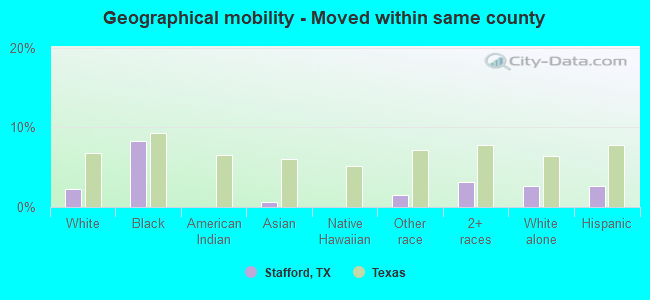
Geographical mobility - Moved within same county (%)
Geographical mobility - Moved within same county (%) - White
Geographical mobility - Moved within same county (%) - Black or African American
Geographical mobility - Moved within same county (%) - Asian
Geographical mobility - Moved within same county (%) - Hispanic or Latino
Geographical mobility - Moved within same county (%) - American Indian and Alaska Native
Geographical mobility - Moved within same county (%) - Multirace
Geographical mobility - Moved within same county (%) - Other Race
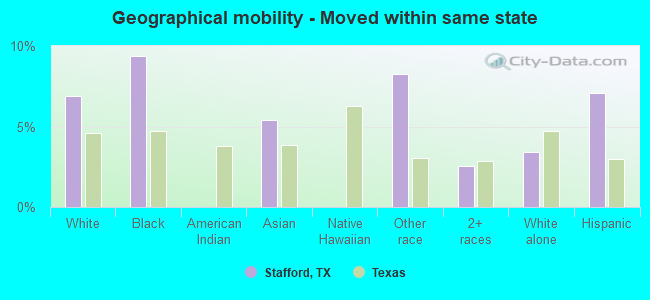
Geographical mobility - Moved from different county within same state (%)
Geographical mobility - Moved from different county within same state (%) - White
Geographical mobility - Moved from different county within same state (%) - Black or African American
Geographical mobility - Moved from different county within same state (%) - Asian
Geographical mobility - Moved from different county within same state (%) - Hispanic or Latino
Geographical mobility - Moved from different county within same state (%) - American Indian and Alaska Native
Geographical mobility - Moved from different county within same state (%) - Multirace
Geographical mobility - Moved from different county within same state (%) - Other Race
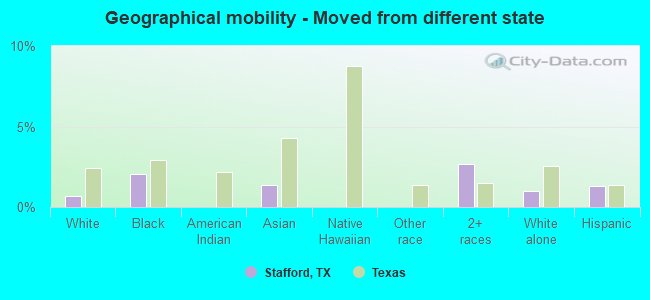
Geographical mobility - Moved from different state (%)
Geographical mobility - Moved from different state (%) - White
Geographical mobility - Moved from different state (%) - Black or African American
Geographical mobility - Moved from different state (%) - Asian
Geographical mobility - Moved from different state (%) - Hispanic or Latino
Geographical mobility - Moved from different state (%) - American Indian and Alaska Native
Geographical mobility - Moved from different state (%) - Multirace
Geographical mobility - Moved from different state (%) - Other Race
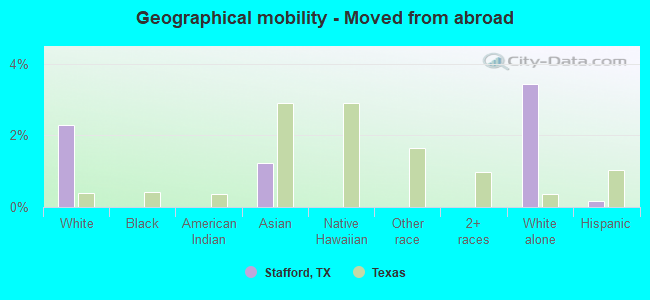
Geographical mobility - Moved from abroad (%)
Geographical mobility - Moved from abroad (%) - White
Geographical mobility - Moved from abroad (%) - Black or African American
Geographical mobility - Moved from abroad (%) - Asian
Geographical mobility - Moved from abroad (%) - Hispanic or Latino
Geographical mobility - Moved from abroad (%) - American Indian and Alaska Native
Geographical mobility - Moved from abroad (%) - Multirace
Geographical mobility - Moved from abroad (%) - Other Race
Place of birth for the foreign-born population - Ireland (%)
Place of birth for the foreign-born population - Denmark (%)
Place of birth for the foreign-born population - Norway (%)
Place of birth for the foreign-born population - Sweden (%)
Place of birth for the foreign-born population - United Kingdom (%)
Place of birth for the foreign-born population - England (%)
Place of birth for the foreign-born population - Scotland (%)
Place of birth for the foreign-born population - Other Northern Europe (%)
Place of birth for the foreign-born population - Austria (%)
Place of birth for the foreign-born population - Belgium (%)
Place of birth for the foreign-born population - France (%)
Place of birth for the foreign-born population - Germany (%)
Place of birth for the foreign-born population - Netherlands (%)
Place of birth for the foreign-born population - Switzerland (%)
Place of birth for the foreign-born population - Other Western Europe (%)
Place of birth for the foreign-born population - Greece (%)
Place of birth for the foreign-born population - Italy (%)
Place of birth for the foreign-born population - Portugal (%)
Place of birth for the foreign-born population - Spain (%)
Place of birth for the foreign-born population - Other Southern Europe (%)
Place of birth for the foreign-born population - Albania (%)
Place of birth for the foreign-born population - Belarus (%)
Place of birth for the foreign-born population - Bosnia and Herzegovina (%)
Place of birth for the foreign-born population - Bulgaria (%)
Place of birth for the foreign-born population - Croatia (%)
Place of birth for the foreign-born population - Czechoslovakia (%)
Place of birth for the foreign-born population - Hungary (%)
Place of birth for the foreign-born population - Latvia (%)
Place of birth for the foreign-born population - Lithuania (%)
Place of birth for the foreign-born population - North Macedonia (Macedonia) (%)
Place of birth for the foreign-born population - Moldova (%)
Place of birth for the foreign-born population - Poland (%)
Place of birth for the foreign-born population - Romania (%)
Place of birth for the foreign-born population - Russia (%)
Place of birth for the foreign-born population - Serbia (%)
Place of birth for the foreign-born population - Ukraine (%)
Place of birth for the foreign-born population - Other Eastern Europe (%)
Place of birth for the foreign-born population - China (%)
Place of birth for the foreign-born population - Hong Kong (%)
Place of birth for the foreign-born population - Taiwan (%)
Place of birth for the foreign-born population - Japan (%)
Place of birth for the foreign-born population - Korea (%)
Place of birth for the foreign-born population - Other Eastern Asia (%)
Place of birth for the foreign-born population - Afghanistan (%)
Place of birth for the foreign-born population - Bangladesh (%)
Place of birth for the foreign-born population - India (%)
Place of birth for the foreign-born population - Iran (%)
Place of birth for the foreign-born population - Kazakhstan (%)
Place of birth for the foreign-born population - Nepal (%)
Place of birth for the foreign-born population - Pakistan (%)
Place of birth for the foreign-born population - Sri Lanka (%)
Place of birth for the foreign-born population - Uzbekistan (%)
Place of birth for the foreign-born population - Other South Central Asia (%)
Place of birth for the foreign-born population - Burma (%)
Place of birth for the foreign-born population - Cambodia (%)
Place of birth for the foreign-born population - Indonesia (%)
Place of birth for the foreign-born population - Laos (%)
Place of birth for the foreign-born population - Malaysia (%)
Place of birth for the foreign-born population - Philippines (%)
Place of birth for the foreign-born population - Singapore (%)
Place of birth for the foreign-born population - Thailand (%)
Place of birth for the foreign-born population - Vietnam (%)
Place of birth for the foreign-born population - Other South Eastern Asia (%)
Place of birth for the foreign-born population - Armenia (%)
Place of birth for the foreign-born population - Iraq (%)
Place of birth for the foreign-born population - Israel (%)
Place of birth for the foreign-born population - Jordan (%)
Place of birth for the foreign-born population - Kuwait (%)
Place of birth for the foreign-born population - Lebanon (%)
Place of birth for the foreign-born population - Saudi Arabia (%)
Place of birth for the foreign-born population - Syria (%)
Place of birth for the foreign-born population - Turkey (%)
Place of birth for the foreign-born population - Yemen (%)
Place of birth for the foreign-born population - Other Western Asia (%)
Place of birth for the foreign-born population - Eritrea (%)
Place of birth for the foreign-born population - Ethiopia (%)
Place of birth for the foreign-born population - Kenya (%)
Place of birth for the foreign-born population - Somalia (%)
Place of birth for the foreign-born population - Uganda (%)
Place of birth for the foreign-born population - Zimbabwe (%)
Place of birth for the foreign-born population - Other Eastern Africa (%)
Place of birth for the foreign-born population - Cameroon (%)
Place of birth for the foreign-born population - Congo (%)
Place of birth for the foreign-born population - Democratic Republic of Congo (Zaire) (%)
Place of birth for the foreign-born population - Other Middle Africa (%)
Place of birth for the foreign-born population - Egypt (%)
Place of birth for the foreign-born population - Morocco (%)
Place of birth for the foreign-born population - Sudan (%)
Place of birth for the foreign-born population - Other Northern Africa (%)
Place of birth for the foreign-born population - South Africa (%)
Place of birth for the foreign-born population - Other Southern Africa (%)
Place of birth for the foreign-born population - Cabo Verde (%)
Place of birth for the foreign-born population - Ghana (%)
Place of birth for the foreign-born population - Liberia (%)
Place of birth for the foreign-born population - Nigeria (%)
Place of birth for the foreign-born population - Senegal (%)
Place of birth for the foreign-born population - Sierra Leone (%)
Place of birth for the foreign-born population - Other Western Africa (%)
Place of birth for the foreign-born population - Australia (%)
Place of birth for the foreign-born population - New Zealand (%)
Place of birth for the foreign-born population - Fiji (%)
Place of birth for the foreign-born population - Micronesia (%)
Place of birth for the foreign-born population - Bahamas (%)
Place of birth for the foreign-born population - Barbados (%)
Place of birth for the foreign-born population - Cuba (%)
Place of birth for the foreign-born population - Dominica (%)
Place of birth for the foreign-born population - Dominican Republic (%)
Place of birth for the foreign-born population - Grenada (%)
Place of birth for the foreign-born population - Haiti (%)
Place of birth for the foreign-born population - Jamaica (%)
Place of birth for the foreign-born population - St. Vincent and the Grenadines (%)
Place of birth for the foreign-born population - Trinidad and Tobago (%)
Place of birth for the foreign-born population - West Indies (%)
Place of birth for the foreign-born population - Other Caribbean (%)
Place of birth for the foreign-born population - Belize (%)
Place of birth for the foreign-born population - Costa Rica (%)
Place of birth for the foreign-born population - El Salvador (%)
Place of birth for the foreign-born population - Guatemala (%)
Place of birth for the foreign-born population - Honduras (%)
Place of birth for the foreign-born population - Mexico (%)
Place of birth for the foreign-born population - Nicaragua (%)
Place of birth for the foreign-born population - Panama (%)
Place of birth for the foreign-born population - Other Central America (%)
Place of birth for the foreign-born population - Argentina (%)
Place of birth for the foreign-born population - Bolivia (%)
Place of birth for the foreign-born population - Brazil (%)
Place of birth for the foreign-born population - Chile (%)
Place of birth for the foreign-born population - Colombia (%)
Place of birth for the foreign-born population - Ecuador (%)
Place of birth for the foreign-born population - Guyana (%)
Place of birth for the foreign-born population - Peru (%)
Place of birth for the foreign-born population - Uruguay (%)
Place of birth for the foreign-born population - Venezuela (%)
Place of birth for the foreign-born population - Other South America (%)
Place of birth for the foreign-born population - Canada (%)
Place of birth for the foreign-born population - Other Northern America (%)
Place of birth for the foreign-born population - Other (%)
Latest news about races in Stafford, TX collected exclusively by city-data.com from local newspapers, TV, and radio stations
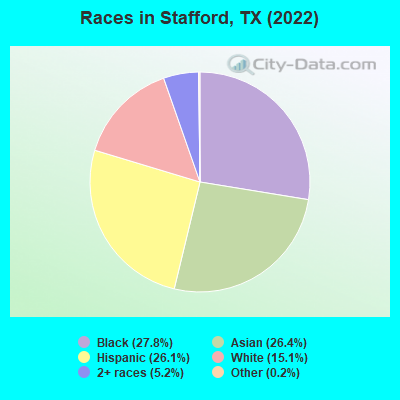
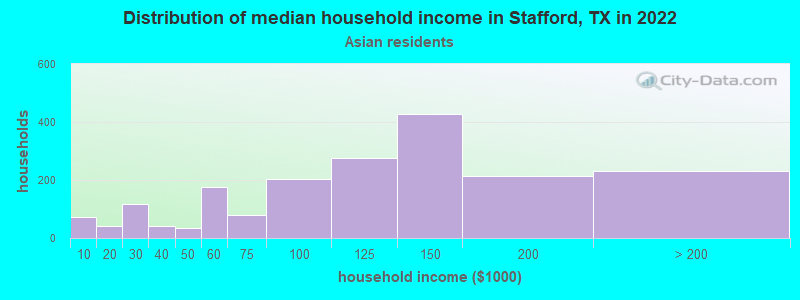
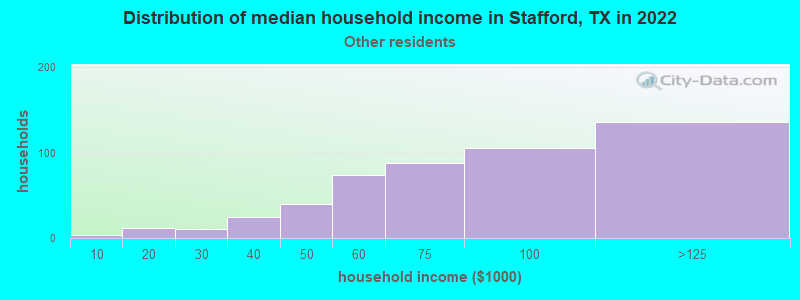
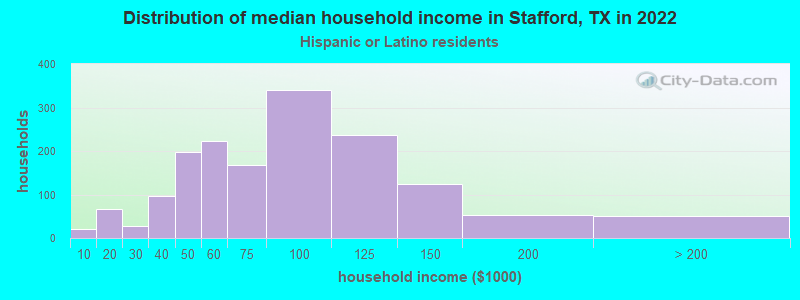
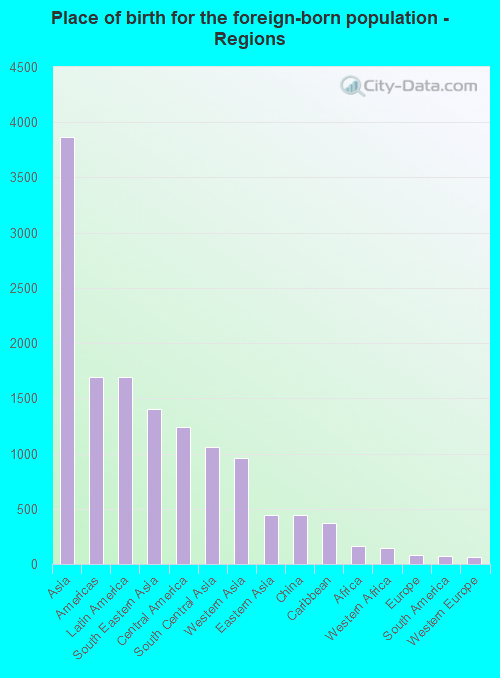
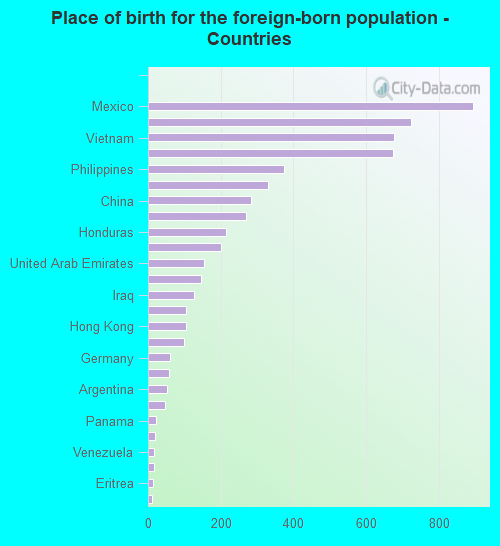
According to 2022 data, the most numerous races in Stafford, TX are Hispanic (4,812 residents), White alone (2,787 residents), and Black alone (5,109 residents). 51.9% of Stafford residents speak English at home. 31.5% of Stafford, TX residents are foreign-born (21.6% born in Asia, 9.5% born in Latin America), which is 46.0% greater than the foreign-born rate of 17.0% across the entire state of Texas.
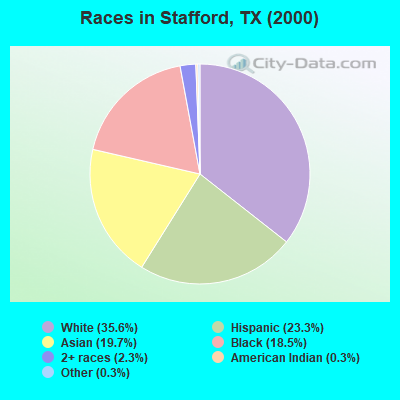
Race distribution in Stafford
2000 2022
10,933,313 52.4% White alone 6,669,666 32.0% Hispanic 2,364,255 11.3% Black alone 554,445 2.7% Asian alone 230,567 1.1% Two or more races 68,859 0.3% American Indian alone 19,958 0.10% Other race alone 10,757 0.05% Native Hawaiian and Other
12,070,642 40.2% Hispanic 11,683,430 38.9% White alone 3,508,706 11.7% Black alone 1,608,173 5.4% Asian alone 956,560 3.2% Two or more races 125,763 0.4% Other race alone 47,023 0.2% American Indian alone 29,275 0.10% Native Hawaiian and Other
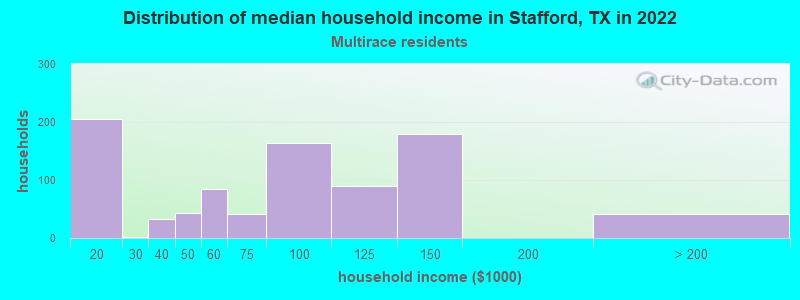
Income and house value in Stafford Median household income in 2022 $58,706 White non-Hispanic householders$80,537 Black householders$116,036 Asian householders$69,658 Some other race householders$91,546 Two or more races householders$78,563 Hispanic or Latino race householdersMedian 2022 house value $234,819 White Non-Hispanic householders$291,606 Black or African American householders $297,489 Asian householders$214,356 Some other race householders$415,666 Two or more races householders$212,821 Hispanic or Latino householders
Median age by race in Stafford
37.5 Median age for White residents38.0 36.9 31.2 Median age for Black or African American residents29.1 38.3 21.4 Median age for American Indian / Alaska Native residents16.9 19.9 34.8 Median age for Asian residents39.3 31.5 -581,560,283.1 Median age for Native Hawaiian / Pacific Islander residents-612,729,233.5 -577,777,777.2 38.0 Median age for Other race residents36.7 38.7 23.8 Median age for Two or more races residents11.1 24.9 37.5 Median age for White alone residents41.2 34.2 33.9 Median age for Hispanic or Latino residents33.4 34.4
Owner/renter occupied households by race in Stafford
House owners and renters - White residents 869 47.0% Owner occupied980 53.0% Renter occupiedHouse owners and renters - Black or African American residents 731 37.8% Owner occupied1,206 62.2% Renter occupiedHouse owners and renters - American Indian / Alaska Native residents 8 49.5% Owner occupied8 50.5% Renter occupiedHouse owners and renters - Asian residents 1,122 55.4% Owner occupied904 44.6% Renter occupiedHouse owners and renters - Other race residents 255 50.8% Owner occupied247 49.2% Renter occupiedHouse owners and renters - Two or more races residents 289 31.5% Owner occupied628 68.5% Renter occupiedHouse owners and renters - White alone residents 605 40.7% Owner occupied881 59.3% Renter occupiedHouse owners and renters - Hispanic or Latino residents 813 48.4% Owner occupied866 51.6% Renter occupied
Language usage in Stafford
English speakers - Total 51.9% of residents of Stafford speak English at home.
19.7% of residents speak Spanish at home 2,216 65.0% Speak English very well1,191 35.0% Speak English less than very well28.3% of residents speak other language at home 2,713 55.5% Speak English very well2,175 44.5% Speak English less than very well
English speakers - Born in the United States 79.9% of residents of Stafford speak English at home.
9.9% of residents speak Spanish at home 308 85.6% Speak English very well52 14.4% Speak English less than very well10.5% of residents speak other language at home 367 95.8% Speak English very well16 4.2% Speak English less than very well
English speakers - Native, born elsewhere 64.9% of residents of Stafford speak English at home.
27.0% of residents speak Spanish at home 6 60.0% Speak English very well4 40.0% Speak English less than very well
English speakers - Foreign-born 14.6% of residents of Stafford speak English at home.
21.2% of residents speak Spanish at home 418 32.7% Speak English very well862 67.3% Speak English less than very well64.0% of residents speak other language at home 1,996 51.8% Speak English very well1,857 48.2% Speak English less than very well
White (Caucasian) - Speak only English Native:
69.2% (1,955)Foreign-born:
11.2% (115)
White (Caucasian) - Speak another language Native:
20.9% (590)Foreign-born:
81.6% (842)
Black or African American - Speak only English Native:
100.0% (4,506)Foreign-born:
59.4% (240)
Black or African American - Speak another language Native:
0.4% (16)Foreign-born:
40.9% (165)
Asian - Speak only English Native:
42.0% (630)Foreign-born:
13.1% (414)
Asian - Speak another language Native:
57.9% (870)Foreign-born:
87.1% (2,762)
Other race - Speak only English Native:
29.2% (340)Foreign-born:
5.0% (25)
Other race - Speak another language Native:
71.5% (831)Foreign-born:
89.3% (455)
Two or more races - Speak another language Native:
42.8% (718)Foreign-born:
94.8% (626)
White alone - Speak only English Native:
91.8% (1,730)Foreign-born:
10.7% (100)
White alone - Speak another language Native:
7.9% (149)Foreign-born:
87.9% (822)
Hispanic or Latino - Speak only English Native:
30.7% (976)Foreign-born:
5.8% (79)
Hispanic or Latino - Speak another language Native:
71.4% (2,270)Foreign-born:
92.4% (1,256)
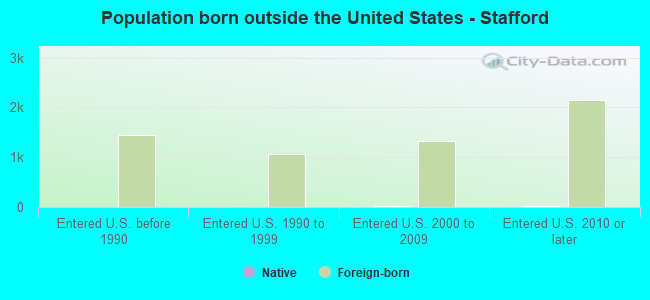
Foreign-born residents in Stafford 5,798 residents are foreign born (21.6% Asia , 9.5% Latin America ).
This city:
31.5%Texas:
17.1%
Marital status for residents in Stafford Marital status - White (Caucasian) population 15 years and over
Males 41.3% Never married47.4% Now married1.4% Separated1.2% Widowed8.7% DivorcedFemales 35.6% Never married38.1% Now married6.0% Separated8.4% Widowed11.8% DivorcedWomen who gave birth in the past 12 months Now married:
0.0% (0)Unmarried:
100.0% (9)
Women who did not give birth in the past 12 months Now married:
42.1% (434)Unmarried:
57.9% (596)
Marital status - Black or African American population 15 years and over
Males 57.6% Never married37.1% Now married0.3% Separated0.0% Widowed5.0% DivorcedFemales 31.2% Never married39.6% Now married1.0% Separated4.9% Widowed23.3% DivorcedWomen who gave birth in the past 12 months Now married:
100.0% (93)Unmarried:
0.0% (0)
Women who did not give birth in the past 12 months Now married:
27.7% (336)Unmarried:
72.3% (876)
Marital status - American Indian / Alaska Native population 15 years and over
Males 0.0% Never married53.8% Now married0.0% Separated0.0% Widowed46.2% DivorcedFemales 34.8% Never married65.2% Now married0.0% Separated0.0% Widowed0.0% DivorcedWomen who gave birth in the past 12 months Now married:
100.0% (11)Unmarried:
0.0% (0)
Women who did not give birth in the past 12 months Now married:
46.7% (10)Unmarried:
53.3% (11)
Marital status - Asian population 15 years and over
Males 23.4% Never married68.2% Now married1.8% Separated0.0% Widowed6.6% DivorcedFemales 44.4% Never married49.7% Now married0.0% Separated4.2% Widowed1.7% DivorcedWomen who gave birth in the past 12 months Now married:
100.0% (50)Unmarried:
0.0% (0)
Women who did not give birth in the past 12 months Now married:
30.1% (462)Unmarried:
69.9% (1,071)
Marital status - Other race population 15 years and over
Males 41.0% Never married46.0% Now married0.0% Separated3.8% Widowed9.2% DivorcedFemales 13.7% Never married59.7% Now married8.6% Separated16.4% Widowed1.6% DivorcedWomen who gave birth in the past 12 months Now married:
100.0% (23)Unmarried:
0.0% (0)
Women who did not give birth in the past 12 months Now married:
68.8% (373)Unmarried:
31.2% (169)
Marital status - Two or more races population 15 years and over
Males 54.6% Never married34.3% Now married9.6% Separated0.0% Widowed1.4% DivorcedFemales 53.6% Never married42.0% Now married0.0% Separated4.3% Widowed0.0% DivorcedWomen who gave birth in the past 12 months Now married:
100.0% (41)Unmarried:
0.0% (0)
Women who did not give birth in the past 12 months Now married:
24.8% (119)Unmarried:
75.2% (361)
Marital status - White alone, not Hispanic / Latino population 15 years and over
Males 41.2% Never married46.1% Now married1.1% Separated1.9% Widowed9.6% DivorcedFemales 42.7% Never married28.0% Now married2.0% Separated13.0% Widowed14.3% DivorcedWomen who gave birth in the past 12 months Now married:
0.0% (0)Unmarried:
100.0% (11)
Women who did not give birth in the past 12 months Now married:
26.1% (181)Unmarried:
73.9% (514)
Marital status - Hispanic or Latino population 15 years and over
Males 44.9% Never married44.2% Now married3.4% Separated1.2% Widowed6.3% DivorcedFemales 25.6% Never married54.6% Now married8.2% Separated6.6% Widowed5.0% DivorcedWomen who gave birth in the past 12 months Now married:
100.0% (52)Unmarried:
0.0% (0)
Women who did not give birth in the past 12 months Now married:
58.2% (694)Unmarried:
41.8% (498)
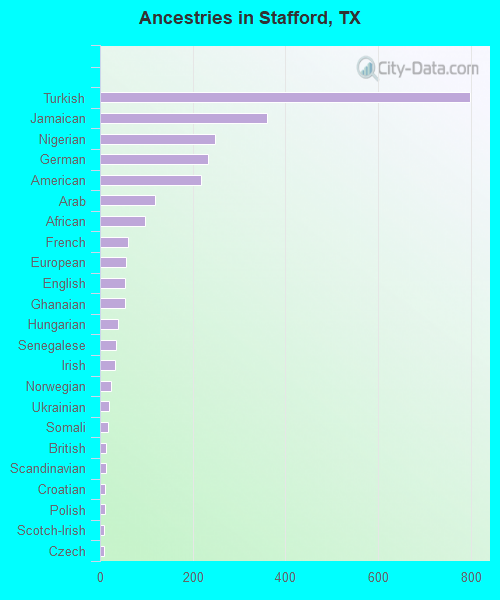
Ancestries in Stafford
799 6.7% Turkish361 3.0% Jamaican247 2.1% Nigerian233 2.0% German218 1.8% American119 1.0% Arab96 0.8% African60 0.5% French57 0.5% European53 0.4% English53 0.4% Ghanaian39 0.3% Hungarian34 0.3% Senegalese33 0.3% Irish23 0.2% Norwegian20 0.2% Ukrainian17 0.1% Somali13 0.1% British13 0.1% Scandinavian11 0.09% Croatian10 0.08% Polish9 0.08% Scotch-Irish8 0.07% Czech
Geographical mobility in Stafford Same house 1 year ago 3,591 88.3% White (Caucasian)4,108 79.0% Black or African American77 100.0% American Indian / Alaska Native4,429 92.0% Asian23 98.2% Native Hawaiian / Pacific Islander1,443 85.7% Other race2,567 92.1% Two or more races2,463 88.4% White alone, not Hispanic / Latino4,205 87.1% Hispanic or LatinoMoved within same county 92 2.3% White / Caucasian432 8.3% Black or African American28 0.6% Asian26 1.5% Other race86 3.1% Two or more races75 2.7% White alone, not Hispanic / Latino130 2.7% Hispanic or LatinoMoved within same state 280 6.9% White / Caucasian488 9.4% Black or African American261 5.4% Asian140 8.3% Other race71 2.5% Two or more races95 3.4% White alone, not Hispanic / Latino343 7.1% Hispanic or LatinoMoved from different state 28 0.7% White / Caucasian107 2.1% Black or African American64 1.3% Asian74 2.6% Two or more races28 1.0% White alone, not Hispanic / Latino62 1.3% Hispanic or LatinoMoved from abroad 93 2.3% White59 1.2% Asian96 3.4% White alone, not Hispanic / Latino8 0.2% Hispanic or Latino
Children Nativity (place of birth) in Stafford
Children under 6 years - Living with two parents Both parents native 240 100.0% NativeBoth parents foreign-born 202 95.7% Native9 4.3% Foreign-bornOne native, one foreign-born parent 108 100.0% NativeChildren under 6 years - Living with one parent Native parent 725 100.0% NativeForeign-born parent 55 100.0% NativeChildren 6 to 17 years - Living with two parents Both parents native 290 97.8% Native7 2.2% Foreign-bornBoth parents foreign-born 582 80.8% Native138 19.2% Foreign-bornOne native, one foreign-born parent 346 89.7% Native40 10.3% Foreign-bornChildren 6 to 17 years - Living with one parent Native parent 910 72.6% Native343 27.4% Foreign-bornForeign-born parent 313 94.5% Native18 5.5% Foreign-born
Grandparents responsible for own grandchildren in Stafford
Grandparents (30 to 59 years) White / Caucasian 10 100.0% Not responsible for grandchildrenBlack or African American 9 100.0% Not responsible for grandchildrenAsian 11 100.0% Not responsible for grandchildrenWhite alone, not Hispanic / Latino 9 100.0% Not responsible for grandchildren
Grandparents (60 years and over) White / Caucasian 47 100.0% Not responsible for grandchildrenBlack or African American 95 100.0% Not responsible for grandchildrenWhite alone, not Hispanic / Latino 49 100.0% Not responsible for grandchildren