Races in Stallings, North Carolina (NC) Detailed Stats
Data:
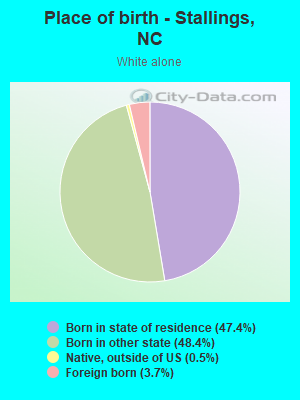
Races - White alone (%)
Races - White alone (% change since 2000)
Races - Black alone (%)
Races - Black alone (% change since 2000)
Races - American Indian alone (%)
Races - American Indian alone (% change since 2000)
Races - Asian alone (%)
Races - Asian alone (% change since 2000)
Races - Hispanic (%)
Races - Hispanic (% change since 2000)
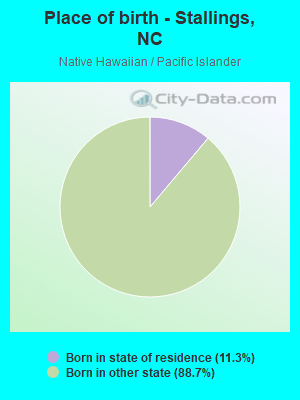
Races - Native Hawaiian and Other Pacific Islander alone (%)
Races - Native Hawaiian and Other Pacific Islander alone (% change since 2000)
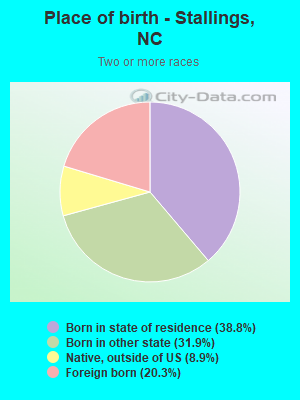
Races - Two or more races(%)
Races - Two or more races(% change since 2000)
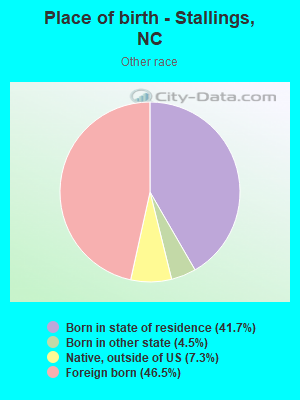
Races - Other race alone (%)
Races - Other race alone (% change since 2000)
Racial diversity
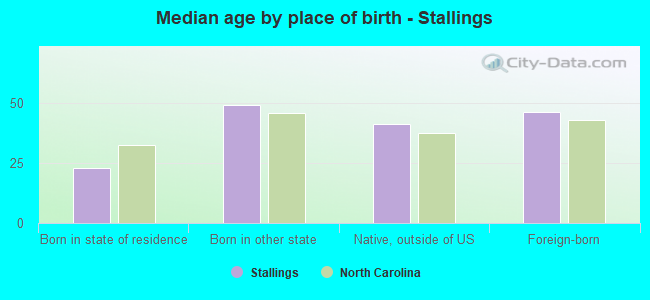
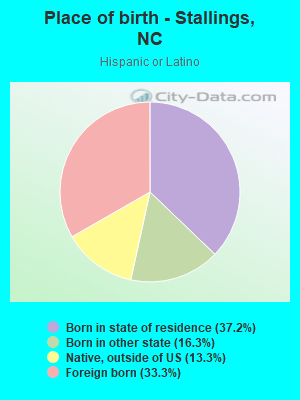
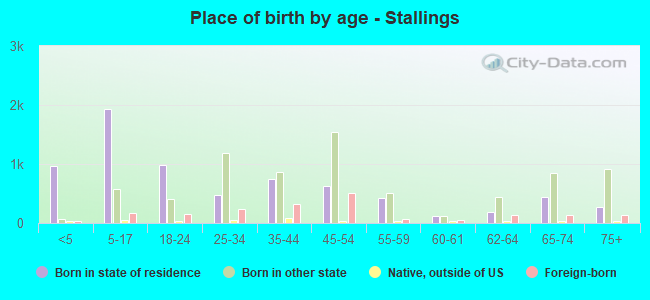
Place of birth - Born in state of residence (%)
Place of birth - Born in state of residence (%) - White
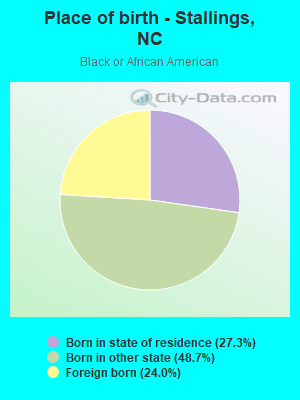
Place of birth - Born in state of residence (%) - Black or African American
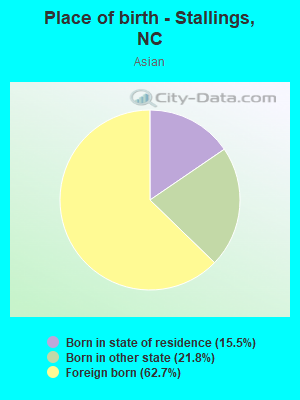
Place of birth - Born in state of residence (%) - Asian
Place of birth - Born in state of residence (%) - Hispanic or Latino
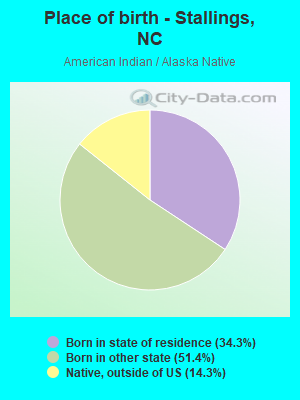
Place of birth - Born in state of residence (%) - American Indian and Alaska Native
Place of birth - Born in state of residence (%) - Multirace
Place of birth - Born in state of residence (%) - Other Race
Place of birth - Born in other state (%)
Place of birth - Born in other state (%) - White
Place of birth - Born in other state (%) - Black or African American
Place of birth - Born in other state (%) - Asian
Place of birth - Born in other state (%) - Hispanic or Latino
Place of birth - Born in other state (%) - American Indian and Alaska Native
Place of birth - Born in other state (%) - Multirace
Place of birth - Born in other state (%) - Other Race
Place of birth - Native, outside of US (%)
Place of birth - Native, outside of US (%) - White
Place of birth - Native, outside of US (%) - Black or African American
Place of birth - Native, outside of US (%) - Asian
Place of birth - Native, outside of US (%) - Hispanic or Latino
Place of birth - Native, outside of US (%) - American Indian and Alaska Native
Place of birth - Native, outside of US (%) - Multirace
Place of birth - Native, outside of US (%) - Other Race
Place of birth - Foreign born (%)
Place of birth - Foreign born (%) - White
Place of birth - Foreign born (%) - Black or African American
Place of birth - Foreign born (%) - Asian
Place of birth - Foreign born (%) - Hispanic or Latino
Place of birth - Foreign born (%) - American Indian and Alaska Native
Place of birth - Foreign born (%) - Multirace
Place of birth - Foreign born (%) - Other Race
Residents speaking English at home (%)
Residents speaking English at home - Born in the United States (%)
Residents speaking English at home - Native, born elsewhere (%)
Residents speaking English at home - Foreign born (%)
Residents speaking Spanish at home (%)
Residents speaking Spanish at home - Born in the United States (%)
Residents speaking Spanish at home - Native, born elsewhere (%)
Residents speaking Spanish at home - Foreign born (%)
Residents speaking other language at home (%)
Residents speaking other language at home - Born in the United States (%)
Residents speaking other language at home - Native, born elsewhere (%)
Residents speaking other language at home - Foreign born (%)
Marital status - Never married (%)
Marital status - Now married (%)
Marital status - Separated (%)
Marital status - Widowed (%)
Marital status - Divorced (%)
Ancestries Reported - Arab (%)
Ancestries Reported - Czech (%)
Ancestries Reported - Danish (%)
Ancestries Reported - Dutch (%)
Ancestries Reported - English (%)
Ancestries Reported - French (%)
Ancestries Reported - French Canadian (%)
Ancestries Reported - German (%)
Ancestries Reported - Greek (%)
Ancestries Reported - Hungarian (%)
Ancestries Reported - Irish (%)
Ancestries Reported - Italian (%)
Ancestries Reported - Lithuanian (%)
Ancestries Reported - Norwegian (%)
Ancestries Reported - Polish (%)
Ancestries Reported - Portuguese (%)
Ancestries Reported - Russian (%)
Ancestries Reported - Scotch-Irish (%)
Ancestries Reported - Scottish (%)
Ancestries Reported - Slovak (%)
Ancestries Reported - Subsaharan African (%)
Ancestries Reported - Swedish (%)
Ancestries Reported - Swiss (%)
Ancestries Reported - Ukrainian (%)
Ancestries Reported - United States (%)
Ancestries Reported - Welsh (%)
Ancestries Reported - West Indian (%)
Ancestries Reported - Other (%)
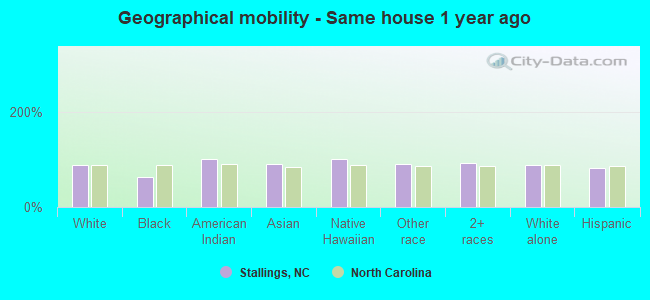
Geographical mobility - Same house 1 year ago (%)
Geographical mobility - Same house 1 year ago (%) - White
Geographical mobility - Same house 1 year ago (%) - Black or African American
Geographical mobility - Same house 1 year ago (%) - Asian
Geographical mobility - Same house 1 year ago (%) - Hispanic or Latino
Geographical mobility - Same house 1 year ago (%) - American Indian and Alaska Native
Geographical mobility - Same house 1 year ago (%) - Multirace
Geographical mobility - Same house 1 year ago (%) - Other Race
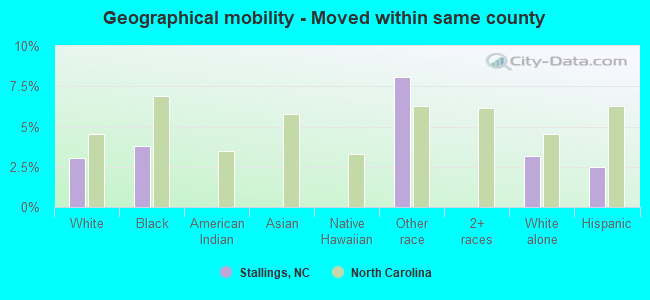
Geographical mobility - Moved within same county (%)
Geographical mobility - Moved within same county (%) - White
Geographical mobility - Moved within same county (%) - Black or African American
Geographical mobility - Moved within same county (%) - Asian
Geographical mobility - Moved within same county (%) - Hispanic or Latino
Geographical mobility - Moved within same county (%) - American Indian and Alaska Native
Geographical mobility - Moved within same county (%) - Multirace
Geographical mobility - Moved within same county (%) - Other Race
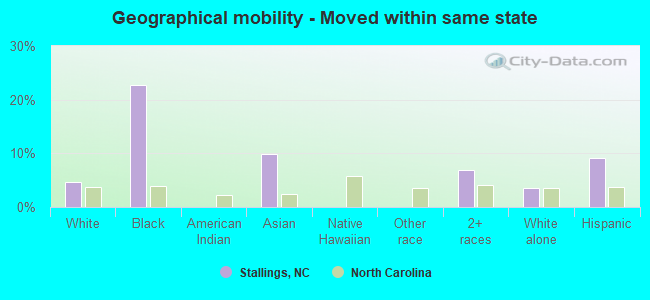
Geographical mobility - Moved from different county within same state (%)
Geographical mobility - Moved from different county within same state (%) - White
Geographical mobility - Moved from different county within same state (%) - Black or African American
Geographical mobility - Moved from different county within same state (%) - Asian
Geographical mobility - Moved from different county within same state (%) - Hispanic or Latino
Geographical mobility - Moved from different county within same state (%) - American Indian and Alaska Native
Geographical mobility - Moved from different county within same state (%) - Multirace
Geographical mobility - Moved from different county within same state (%) - Other Race
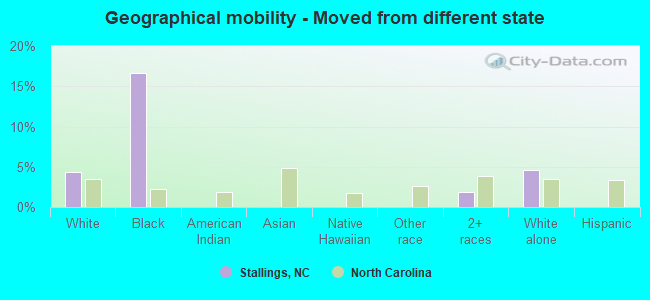
Geographical mobility - Moved from different state (%)
Geographical mobility - Moved from different state (%) - White
Geographical mobility - Moved from different state (%) - Black or African American
Geographical mobility - Moved from different state (%) - Asian
Geographical mobility - Moved from different state (%) - Hispanic or Latino
Geographical mobility - Moved from different state (%) - American Indian and Alaska Native
Geographical mobility - Moved from different state (%) - Multirace
Geographical mobility - Moved from different state (%) - Other Race
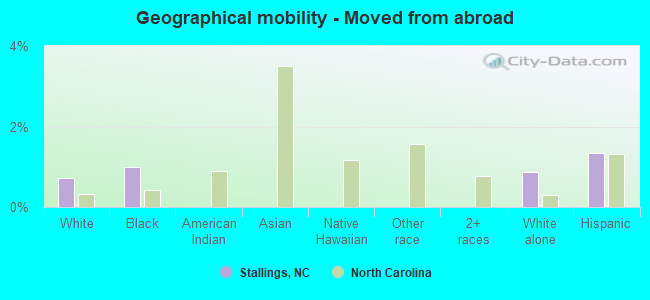
Geographical mobility - Moved from abroad (%)
Geographical mobility - Moved from abroad (%) - White
Geographical mobility - Moved from abroad (%) - Black or African American
Geographical mobility - Moved from abroad (%) - Asian
Geographical mobility - Moved from abroad (%) - Hispanic or Latino
Geographical mobility - Moved from abroad (%) - American Indian and Alaska Native
Geographical mobility - Moved from abroad (%) - Multirace
Geographical mobility - Moved from abroad (%) - Other Race
Place of birth for the foreign-born population - Ireland (%)
Place of birth for the foreign-born population - Denmark (%)
Place of birth for the foreign-born population - Norway (%)
Place of birth for the foreign-born population - Sweden (%)
Place of birth for the foreign-born population - United Kingdom (%)
Place of birth for the foreign-born population - England (%)
Place of birth for the foreign-born population - Scotland (%)
Place of birth for the foreign-born population - Other Northern Europe (%)
Place of birth for the foreign-born population - Austria (%)
Place of birth for the foreign-born population - Belgium (%)
Place of birth for the foreign-born population - France (%)
Place of birth for the foreign-born population - Germany (%)
Place of birth for the foreign-born population - Netherlands (%)
Place of birth for the foreign-born population - Switzerland (%)
Place of birth for the foreign-born population - Other Western Europe (%)
Place of birth for the foreign-born population - Greece (%)
Place of birth for the foreign-born population - Italy (%)
Place of birth for the foreign-born population - Portugal (%)
Place of birth for the foreign-born population - Spain (%)
Place of birth for the foreign-born population - Other Southern Europe (%)
Place of birth for the foreign-born population - Albania (%)
Place of birth for the foreign-born population - Belarus (%)
Place of birth for the foreign-born population - Bosnia and Herzegovina (%)
Place of birth for the foreign-born population - Bulgaria (%)
Place of birth for the foreign-born population - Croatia (%)
Place of birth for the foreign-born population - Czechoslovakia (%)
Place of birth for the foreign-born population - Hungary (%)
Place of birth for the foreign-born population - Latvia (%)
Place of birth for the foreign-born population - Lithuania (%)
Place of birth for the foreign-born population - North Macedonia (Macedonia) (%)
Place of birth for the foreign-born population - Moldova (%)
Place of birth for the foreign-born population - Poland (%)
Place of birth for the foreign-born population - Romania (%)
Place of birth for the foreign-born population - Russia (%)
Place of birth for the foreign-born population - Serbia (%)
Place of birth for the foreign-born population - Ukraine (%)
Place of birth for the foreign-born population - Other Eastern Europe (%)
Place of birth for the foreign-born population - China (%)
Place of birth for the foreign-born population - Hong Kong (%)
Place of birth for the foreign-born population - Taiwan (%)
Place of birth for the foreign-born population - Japan (%)
Place of birth for the foreign-born population - Korea (%)
Place of birth for the foreign-born population - Other Eastern Asia (%)
Place of birth for the foreign-born population - Afghanistan (%)
Place of birth for the foreign-born population - Bangladesh (%)
Place of birth for the foreign-born population - India (%)
Place of birth for the foreign-born population - Iran (%)
Place of birth for the foreign-born population - Kazakhstan (%)
Place of birth for the foreign-born population - Nepal (%)
Place of birth for the foreign-born population - Pakistan (%)
Place of birth for the foreign-born population - Sri Lanka (%)
Place of birth for the foreign-born population - Uzbekistan (%)
Place of birth for the foreign-born population - Other South Central Asia (%)
Place of birth for the foreign-born population - Burma (%)
Place of birth for the foreign-born population - Cambodia (%)
Place of birth for the foreign-born population - Indonesia (%)
Place of birth for the foreign-born population - Laos (%)
Place of birth for the foreign-born population - Malaysia (%)
Place of birth for the foreign-born population - Philippines (%)
Place of birth for the foreign-born population - Singapore (%)
Place of birth for the foreign-born population - Thailand (%)
Place of birth for the foreign-born population - Vietnam (%)
Place of birth for the foreign-born population - Other South Eastern Asia (%)
Place of birth for the foreign-born population - Armenia (%)
Place of birth for the foreign-born population - Iraq (%)
Place of birth for the foreign-born population - Israel (%)
Place of birth for the foreign-born population - Jordan (%)
Place of birth for the foreign-born population - Kuwait (%)
Place of birth for the foreign-born population - Lebanon (%)
Place of birth for the foreign-born population - Saudi Arabia (%)
Place of birth for the foreign-born population - Syria (%)
Place of birth for the foreign-born population - Turkey (%)
Place of birth for the foreign-born population - Yemen (%)
Place of birth for the foreign-born population - Other Western Asia (%)
Place of birth for the foreign-born population - Eritrea (%)
Place of birth for the foreign-born population - Ethiopia (%)
Place of birth for the foreign-born population - Kenya (%)
Place of birth for the foreign-born population - Somalia (%)
Place of birth for the foreign-born population - Uganda (%)
Place of birth for the foreign-born population - Zimbabwe (%)
Place of birth for the foreign-born population - Other Eastern Africa (%)
Place of birth for the foreign-born population - Cameroon (%)
Place of birth for the foreign-born population - Congo (%)
Place of birth for the foreign-born population - Democratic Republic of Congo (Zaire) (%)
Place of birth for the foreign-born population - Other Middle Africa (%)
Place of birth for the foreign-born population - Egypt (%)
Place of birth for the foreign-born population - Morocco (%)
Place of birth for the foreign-born population - Sudan (%)
Place of birth for the foreign-born population - Other Northern Africa (%)
Place of birth for the foreign-born population - South Africa (%)
Place of birth for the foreign-born population - Other Southern Africa (%)
Place of birth for the foreign-born population - Cabo Verde (%)
Place of birth for the foreign-born population - Ghana (%)
Place of birth for the foreign-born population - Liberia (%)
Place of birth for the foreign-born population - Nigeria (%)
Place of birth for the foreign-born population - Senegal (%)
Place of birth for the foreign-born population - Sierra Leone (%)
Place of birth for the foreign-born population - Other Western Africa (%)
Place of birth for the foreign-born population - Australia (%)
Place of birth for the foreign-born population - New Zealand (%)
Place of birth for the foreign-born population - Fiji (%)
Place of birth for the foreign-born population - Micronesia (%)
Place of birth for the foreign-born population - Bahamas (%)
Place of birth for the foreign-born population - Barbados (%)
Place of birth for the foreign-born population - Cuba (%)
Place of birth for the foreign-born population - Dominica (%)
Place of birth for the foreign-born population - Dominican Republic (%)
Place of birth for the foreign-born population - Grenada (%)
Place of birth for the foreign-born population - Haiti (%)
Place of birth for the foreign-born population - Jamaica (%)
Place of birth for the foreign-born population - St. Vincent and the Grenadines (%)
Place of birth for the foreign-born population - Trinidad and Tobago (%)
Place of birth for the foreign-born population - West Indies (%)
Place of birth for the foreign-born population - Other Caribbean (%)
Place of birth for the foreign-born population - Belize (%)
Place of birth for the foreign-born population - Costa Rica (%)
Place of birth for the foreign-born population - El Salvador (%)
Place of birth for the foreign-born population - Guatemala (%)
Place of birth for the foreign-born population - Honduras (%)
Place of birth for the foreign-born population - Mexico (%)
Place of birth for the foreign-born population - Nicaragua (%)
Place of birth for the foreign-born population - Panama (%)
Place of birth for the foreign-born population - Other Central America (%)
Place of birth for the foreign-born population - Argentina (%)
Place of birth for the foreign-born population - Bolivia (%)
Place of birth for the foreign-born population - Brazil (%)
Place of birth for the foreign-born population - Chile (%)
Place of birth for the foreign-born population - Colombia (%)
Place of birth for the foreign-born population - Ecuador (%)
Place of birth for the foreign-born population - Guyana (%)
Place of birth for the foreign-born population - Peru (%)
Place of birth for the foreign-born population - Uruguay (%)
Place of birth for the foreign-born population - Venezuela (%)
Place of birth for the foreign-born population - Other South America (%)
Place of birth for the foreign-born population - Canada (%)
Place of birth for the foreign-born population - Other Northern America (%)
Place of birth for the foreign-born population - Other (%)
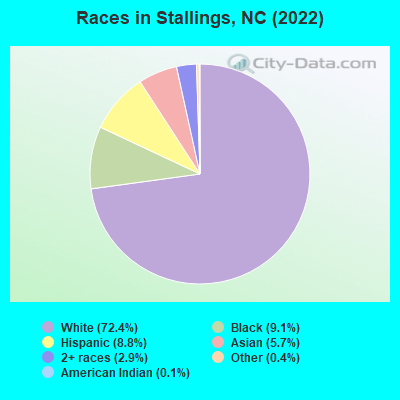
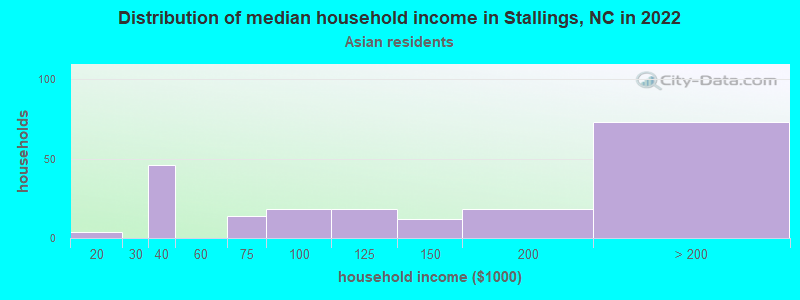
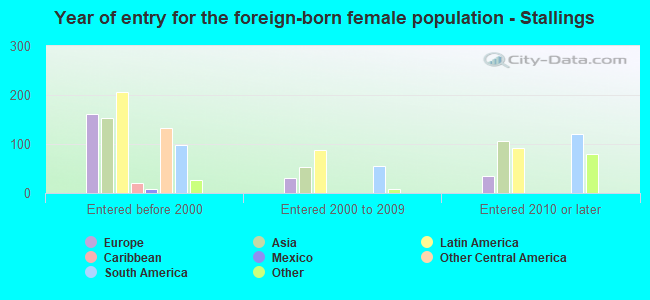
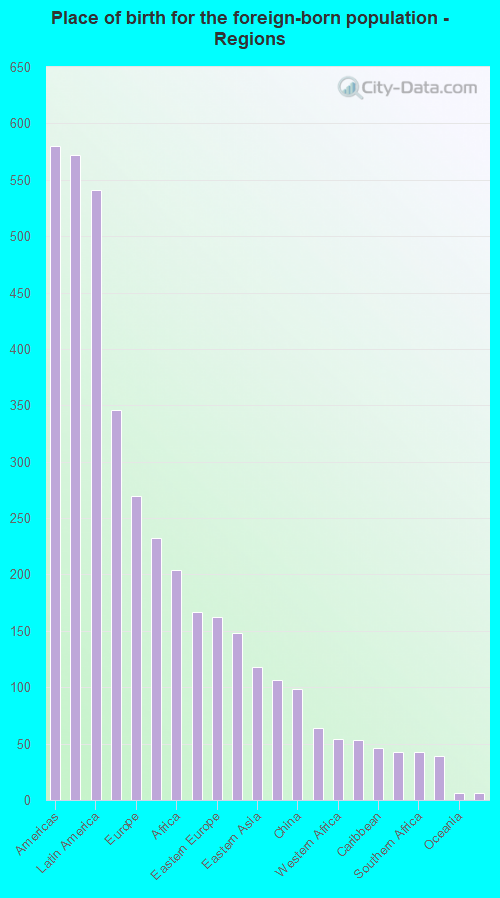
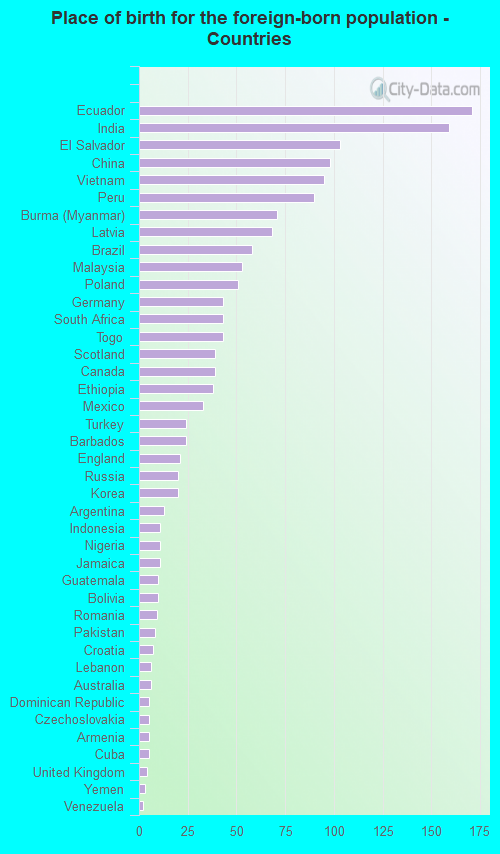
According to 2022 data, the most numerous races in Stallings, NC are White alone (12,159 residents), Black alone (1,528 residents), and Hispanic (1,474 residents). 84.6% of Stallings residents speak English at home. 9.7% of Stallings, NC residents are foreign-born (3.3% born in Asia, 3.2% born in Latin America, 1.6% born in Europe, 1.2% born in Africa), which is 17.8% greater than the foreign-born rate of 8.0% across the entire state of North Carolina.
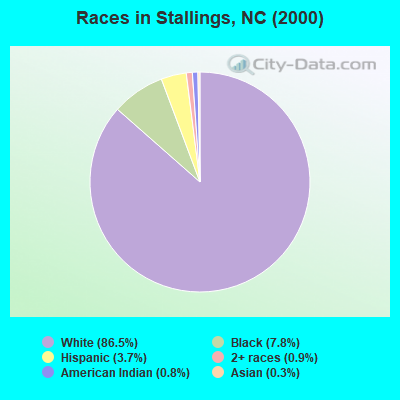
Race distribution in Stallings
2000 2022
5,647,155 70.2% White alone 1,723,301 21.4% Black alone 378,963 4.7% Hispanic 112,416 1.4% Asian alone 95,333 1.2% American Indian alone 79,965 1.0% Two or more races 9,015 0.1% Other race alone 3,165 0.04% Native Hawaiian and Other
6,497,519 60.7% White alone 2,155,650 20.1% Black alone 1,114,799 10.4% Hispanic 438,061 4.1% Two or more races 341,052 3.2% Asian alone 91,758 0.9% American Indian alone 50,180 0.5% Other race alone 9,954 0.09% Native Hawaiian and Other
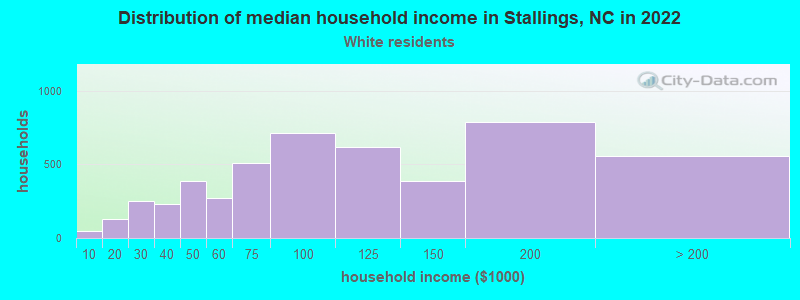
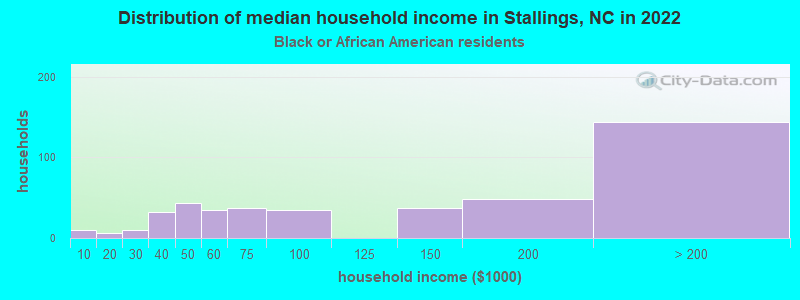
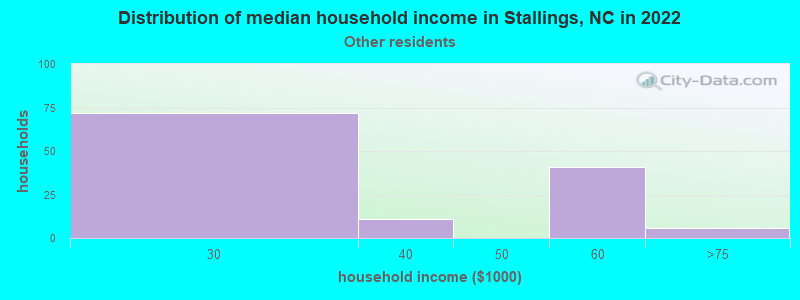
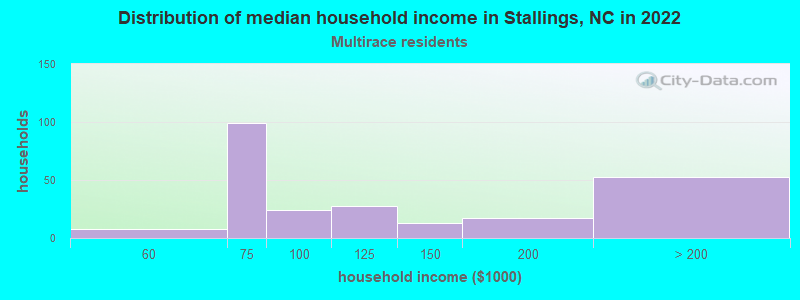
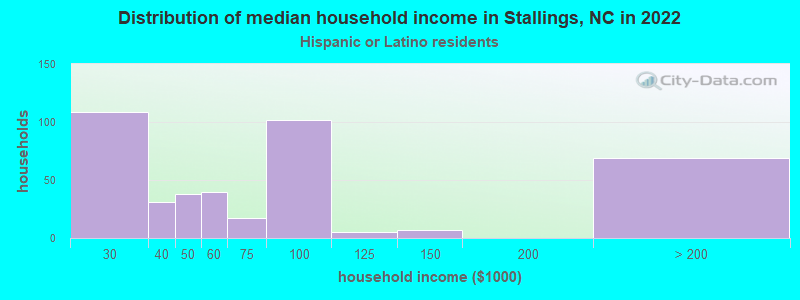
Income and house value in Stallings Median household income in 2022 $93,013 White non-Hispanic householders$94,493 Asian householders$29,705 Some other race householders$106,923 Two or more races householders$66,306 Hispanic or Latino race householdersMedian 2022 house value $441,524 White Non-Hispanic householders$378,149 Black or African American householders $481,440 Asian householders
Median age by race in Stallings
42.9 Median age for White residents41.7 44.6 34.6 Median age for Black or African American residents40.9 35.5 10.5 Median age for American Indian / Alaska Native residents30.8 9.4 33.6 Median age for Asian residents30.8 32.5 -560,606,060.0 Median age for Native Hawaiian / Pacific Islander residents-666,666,666.0 -559,017,940.9 32.9 Median age for Other race residents11.1 45.9 30.5 Median age for Two or more races residents27.9 33.2 43.3 Median age for White alone residents42.2 44.8 27.3 Median age for Hispanic or Latino residents22.5 31.9
Owner/renter occupied households by race in Stallings
House owners and renters - White residents 4,412 90.5% Owner occupied462 9.5% Renter occupiedHouse owners and renters - Black or African American residents 398 83.2% Owner occupied81 16.8% Renter occupiedHouse owners and renters - American Indian / Alaska Native residents 12 100.0% Owner occupiedHouse owners and renters - Asian residents 261 100.0% Owner occupiedHouse owners and renters - Other race residents 149 86.4% Owner occupied23 13.6% Renter occupiedHouse owners and renters - Two or more races residents 174 93.9% Owner occupied11 6.1% Renter occupiedHouse owners and renters - White alone residents 4,362 90.0% Owner occupied483 10.0% Renter occupiedHouse owners and renters - Hispanic or Latino residents 302 88.2% Owner occupied40 11.8% Renter occupied
Language usage in Stallings
English speakers - Total 84.6% of residents of Stallings speak English at home.
6.4% of residents speak Spanish at home 738 73.8% Speak English very well262 26.2% Speak English less than very well8.7% of residents speak other language at home 912 66.6% Speak English very well458 33.4% Speak English less than very well
English speakers - Born in the United States 96.3% of residents of Stallings speak English at home.
0.5% of residents speak Spanish at home 34 100.0% Speak English very well2.6% of residents speak other language at home 135 70.3% Speak English very well57 29.7% Speak English less than very well
English speakers - Native, born elsewhere 36.9% of residents of Stallings speak English at home.
97.9% of residents speak Spanish at home 229 80.6% Speak English very well55 19.4% Speak English less than very well
English speakers - Foreign-born 23.3% of residents of Stallings speak English at home.
21.4% of residents speak Spanish at home 247 59.8% Speak English very well166 40.2% Speak English less than very well55.3% of residents speak other language at home 679 63.6% Speak English very well388 36.4% Speak English less than very well
White (Caucasian) - Speak only English Native:
98.1% (10,837)Foreign-born:
50.2% (224)
White (Caucasian) - Speak another language Native:
2.3% (249)Foreign-born:
56.1% (250)
Black or African American - Speak only English Native:
97.4% (1,306)Foreign-born:
37.9% (81)
Black or African American - Speak another language Native:
2.6% (34)Foreign-born:
62.1% (133)
Asian - Speak only English Native:
47.8% (129)Foreign-born:
4.0% (25)
Asian - Speak another language Native:
49.0% (132)Foreign-born:
100.0% (613)
Other race - Speak only English Native:
25.4% (83)Foreign-born:
0.5% (2)
Other race - Speak another language Native:
72.6% (237)Foreign-born:
100.0% (297)
Two or more races - Speak only English Native:
79.8% (453)Foreign-born:
7.5% (13)
Two or more races - Speak another language Native:
19.0% (108)Foreign-born:
92.9% (160)
White alone - Speak only English Native:
97.5% (10,633)Foreign-born:
48.2% (216)
White alone - Speak another language Native:
2.5% (271)Foreign-born:
48.6% (218)
Hispanic or Latino - Speak only English Native:
58.1% (507)Foreign-born:
7.1% (35)
Hispanic or Latino - Speak another language Native:
43.8% (382)Foreign-born:
92.9% (461)
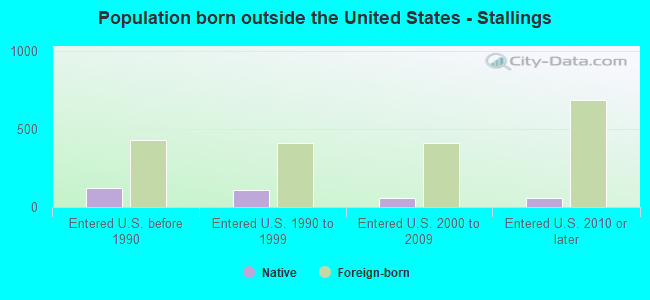
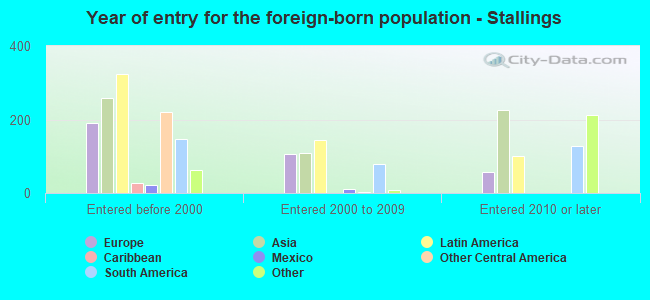
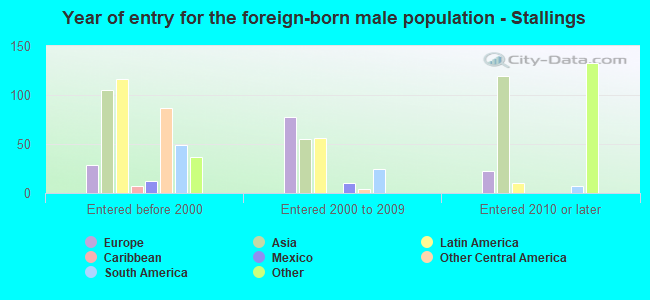
Foreign-born residents in Stallings 1,635 residents are foreign born (3.3% Asia , 3.2% Latin America , 1.6% Europe , 1.2% Africa ).
This city:
9.7%North Carolina:
8.3%
Marital status for residents in Stallings Marital status - White (Caucasian) population 15 years and over
Males 26.1% Never married65.7% Now married1.7% Separated2.4% Widowed4.1% DivorcedFemales 20.9% Never married58.1% Now married1.1% Separated8.3% Widowed11.6% DivorcedWomen who gave birth in the past 12 months Now married:
91.0% (169)Unmarried:
9.0% (17)
Women who did not give birth in the past 12 months Now married:
54.1% (1,279)Unmarried:
45.9% (1,086)
Marital status - Black or African American population 15 years and over
Males 46.5% Never married53.5% Now married0.0% Separated0.0% Widowed0.0% DivorcedFemales 47.4% Never married32.7% Now married0.9% Separated15.2% Widowed3.8% DivorcedWomen who gave birth in the past 12 months Now married:
100.0% (6)Unmarried:
0.0% (0)
Women who did not give birth in the past 12 months Now married:
17.9% (72)Unmarried:
82.1% (331)
Marital status - American Indian / Alaska Native population 15 years and over
Males 6.7% Never married86.7% Now married6.7% Separated0.0% Widowed0.0% DivorcedFemales 0.0% Never married100.0% Now married0.0% Separated0.0% Widowed0.0% DivorcedWomen who did not give birth in the past 12 months Now married:
100.0% (12)Unmarried:
0.0% (0)
Marital status - Asian population 15 years and over
Males 29.9% Never married63.5% Now married0.0% Separated0.0% Widowed6.6% DivorcedFemales 21.3% Never married70.4% Now married0.0% Separated3.6% Widowed4.7% DivorcedWomen who gave birth in the past 12 months Now married:
100.0% (21)Unmarried:
0.0% (0)
Women who did not give birth in the past 12 months Now married:
68.1% (148)Unmarried:
31.9% (69)
Marital status - Other race population 15 years and over
Males 0.0% Never married97.4% Now married0.0% Separated2.6% Widowed0.0% DivorcedFemales 40.1% Never married26.7% Now married26.2% Separated0.0% Widowed7.0% DivorcedWomen who did not give birth in the past 12 months Now married:
56.2% (69)Unmarried:
43.8% (53)
Marital status - Two or more races population 15 years and over
Males 58.8% Never married41.2% Now married0.0% Separated0.0% Widowed0.0% DivorcedFemales 31.0% Never married56.7% Now married0.0% Separated0.0% Widowed12.3% DivorcedWomen who gave birth in the past 12 months Now married:
100.0% (8)Unmarried:
0.0% (0)
Women who did not give birth in the past 12 months Now married:
58.2% (141)Unmarried:
41.8% (101)
Marital status - White alone, not Hispanic / Latino population 15 years and over
Males 25.1% Never married66.3% Now married1.8% Separated2.6% Widowed4.3% DivorcedFemales 20.2% Never married58.9% Now married1.1% Separated8.1% Widowed11.7% DivorcedWomen who gave birth in the past 12 months Now married:
91.0% (181)Unmarried:
9.0% (18)
Women who did not give birth in the past 12 months Now married:
55.1% (1,315)Unmarried:
44.9% (1,071)
Marital status - Hispanic or Latino population 15 years and over
Males 32.6% Never married67.1% Now married0.0% Separated0.3% Widowed0.0% DivorcedFemales 35.0% Never married41.0% Now married9.1% Separated5.0% Widowed9.9% DivorcedWomen who did not give birth in the past 12 months Now married:
50.5% (183)Unmarried:
49.5% (180)
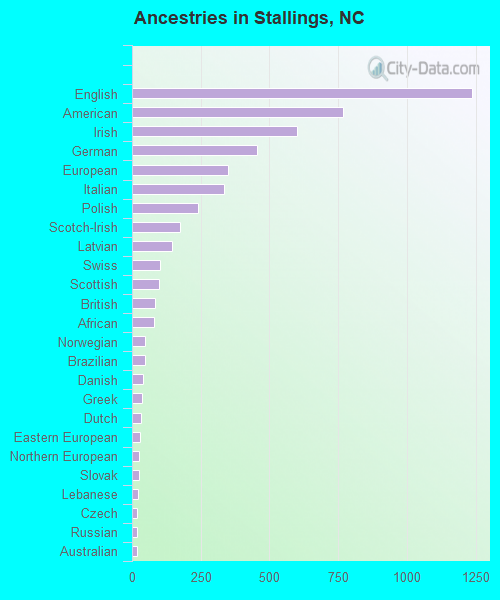
Ancestries in Stallings
1,237 16.4% English767 10.2% American599 8.0% Irish453 6.0% German348 4.6% European335 4.5% Italian239 3.2% Polish174 2.3% Scotch-Irish144 1.9% Latvian101 1.3% Swiss100 1.3% Scottish85 1.1% British81 1.1% African49 0.7% Norwegian46 0.6% Brazilian41 0.5% Danish35 0.5% Greek34 0.5% Dutch28 0.4% Eastern European26 0.3% Northern European26 0.3% Slovak23 0.3% Lebanese20 0.3% Czech20 0.3% Russian17 0.2% Australian17 0.2% Turkish16 0.2% Slavic16 0.2% Nigerian11 0.1% Hungarian10 0.1% Armenian10 0.1% Welsh7 0.09% Croatian6 0.08% Scandinavian4 0.05% Iranian1 0.01% Serbian
Children Nativity (place of birth) in Stallings
Children under 6 years - Living with two parents Both parents native 929 100.0% NativeBoth parents foreign-born 79 100.0% NativeOne native, one foreign-born parent 67 100.0% NativeChildren under 6 years - Living with one parent Native parent 200 100.0% NativeChildren 6 to 17 years - Living with two parents Both parents native 1,582 100.0% NativeBoth parents foreign-born 206 49.9% Native207 50.1% Foreign-bornOne native, one foreign-born parent 156 100.0% NativeChildren 6 to 17 years - Living with one parent Native parent 253 100.0% NativeForeign-born parent 126 59.7% Native85 40.3% Foreign-born
Grandparents responsible for own grandchildren in Stallings
Grandparents (30 to 59 years) White / Caucasian 14 12.2% Responsible for grandchildren102 87.8% Not responsible for grandchildrenTwo or more races 32 100.0% Responsible for grandchildrenWhite alone, not Hispanic / Latino 15 11.8% Responsible for grandchildren113 88.2% Not responsible for grandchildrenHispanic or Latino 19 100.0% Responsible for grandchildrenGrandparents (60 years and over) White / Caucasian 37 27.9% Responsible for grandchildren96 72.1% Not responsible for grandchildrenWhite alone, not Hispanic / Latino 37 50.8% Responsible for grandchildren36 49.2% Not responsible for grandchildrenHispanic or Latino 17 100.0% Not responsible for grandchildren