Races in Standish, Maine (ME) Detailed Stats
Ancestries, Foreign-born residents, place of birth

Data:
Latest news about races in Standish, ME collected exclusively by city-data.com from local newspapers, TV, and radio stations
1.6% of Standish, ME residents are foreign-born , which is 89.5% less than the foreign-born rate of 3.0% across the entire state of Maine.
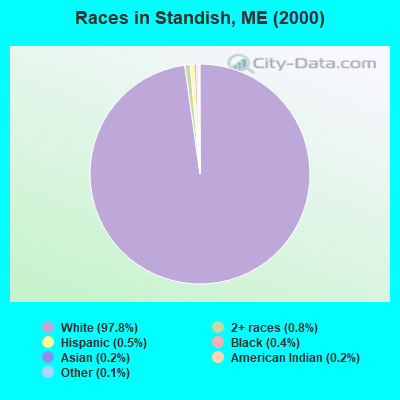
Race distribution in Standish

- 9,08197.8%White alone
- 700.8%Two or more races
- 430.5%Hispanic
- 360.4%Black alone
- 220.2%Asian alone
- 140.2%American Indian alone
- 120.1%Other race alone
- 70.08%Native Hawaiian and Other
Pacific Islander alone
2000
2022
-
- 1,230,29796.5%White alone
- 11,7310.9%Two or more races
- 9,3600.7%Hispanic
- 9,0140.7%Asian alone
- 6,4400.5%Black alone
- 6,9110.5%American Indian alone
- 8360.07%Other race alone
- 3340.03%Native Hawaiian and Other
Pacific Islander alone
-
- 1,249,23390.2%White alone
- 58,3574.2%Two or more races
- 28,7172.1%Hispanic
- 21,5831.6%Black alone
- 16,1511.2%Asian alone
- 5,8730.4%Other race alone
- 5,2050.4%American Indian alone
- 2210.02%Native Hawaiian and Other
Pacific Islander alone
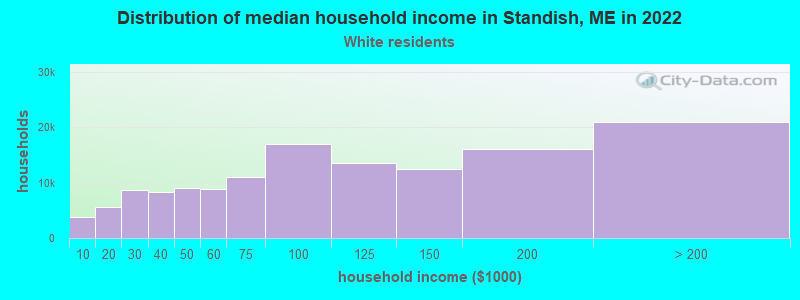
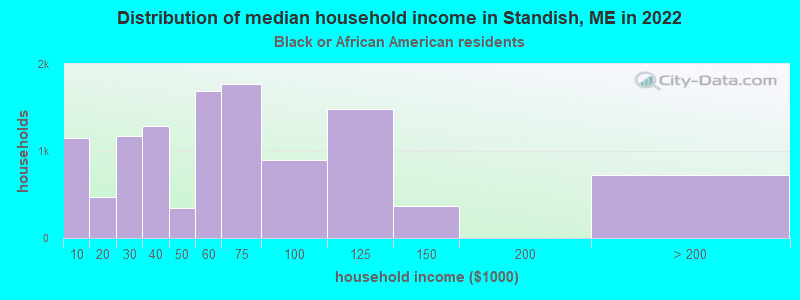
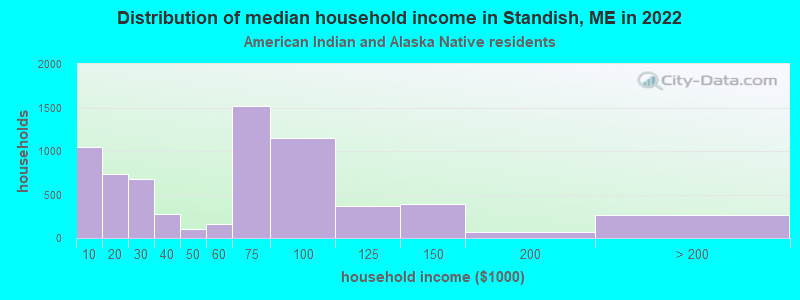
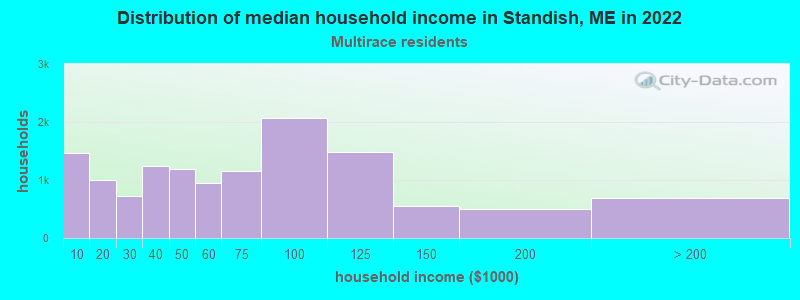
Income and house value in Standish
- Median household income in 2022
- $104,318White non-Hispanic householders
- $89,193Black householders
- $118,985American Indian and Alaska Native householders
- $69,071Two or more races householders
- Median 2022 house value
- $410,950White Non-Hispanic householders
- $468,538Black or African American householders
- $221,490American Indian or Alaska Native householders
- $411,632Two or more races householders
Foreign-born residents in Standish
147 residents are foreign born
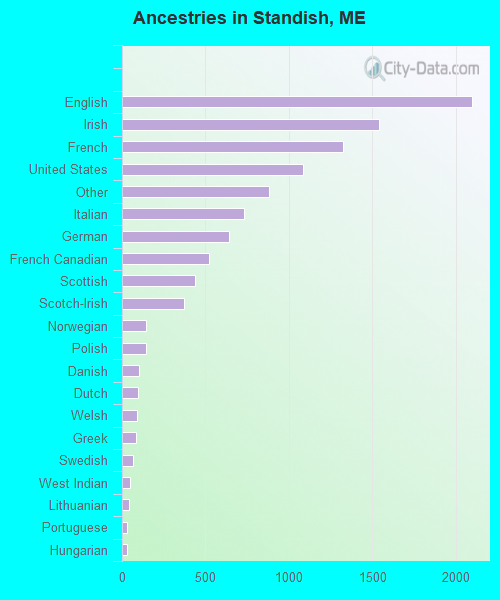
Ancestries in Standish

- 2,09319.9%English
- 1,53814.6%Irish
- 1,32612.6%French
- 1,08410.3%United States
- 8838.4%Other
- 7337.0%Italian
- 6396.1%German
- 5225.0%French Canadian
- 4374.1%Scottish
- 3703.5%Scotch-Irish
- 1451.4%Norwegian
- 1431.4%Polish
- 1021.0%Danish
- 970.9%Dutch
- 880.8%Welsh
- 850.8%Greek
- 640.6%Swedish
- 500.5%West Indian
- 420.4%Lithuanian
- 280.3%Portuguese
- 270.3%Hungarian
- 160.2%Ukrainian
- 150.1%Czech
- 150.1%Russian