Races in Statesboro, Georgia (GA) Detailed Stats
Data:
Races - White alone (%)
Races - White alone (% change since 2000)
Races - Black alone (%)
Races - Black alone (% change since 2000)
Races - American Indian alone (%)
Races - American Indian alone (% change since 2000)
Races - Asian alone (%)
Races - Asian alone (% change since 2000)
Races - Hispanic (%)
Races - Hispanic (% change since 2000)
Races - Native Hawaiian and Other Pacific Islander alone (%)
Races - Native Hawaiian and Other Pacific Islander alone (% change since 2000)
Races - Two or more races(%)
Races - Two or more races(% change since 2000)
Races - Other race alone (%)
Races - Other race alone (% change since 2000)
Racial diversity
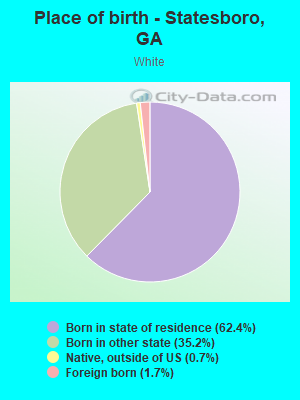
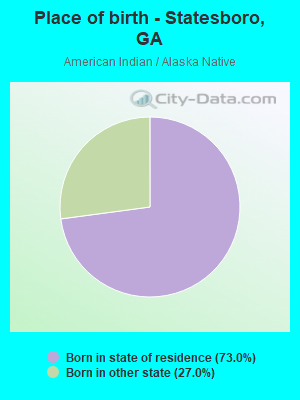
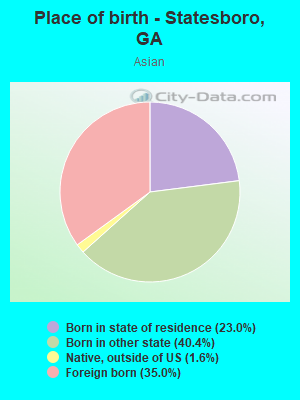
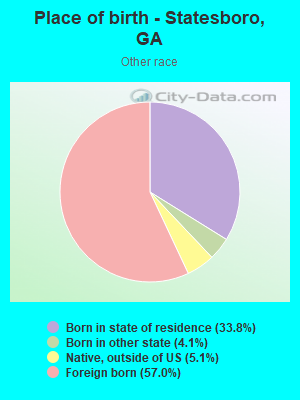
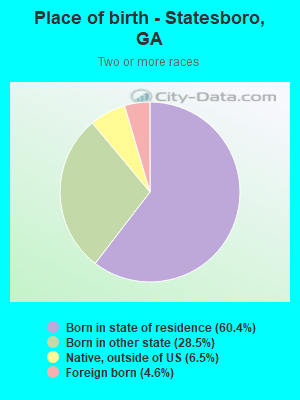
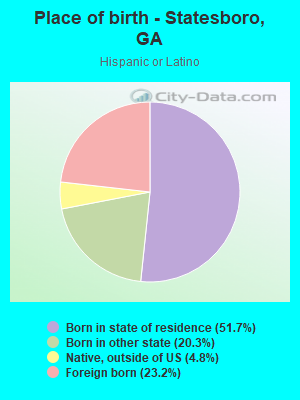
Place of birth - Born in state of residence (%)
Place of birth - Born in state of residence (%) - White
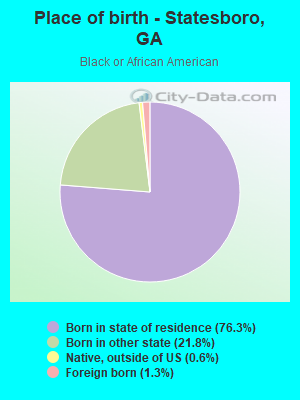
Place of birth - Born in state of residence (%) - Black or African American
Place of birth - Born in state of residence (%) - Asian
Place of birth - Born in state of residence (%) - Hispanic or Latino
Place of birth - Born in state of residence (%) - American Indian and Alaska Native
Place of birth - Born in state of residence (%) - Multirace
Place of birth - Born in state of residence (%) - Other Race
Place of birth - Born in other state (%)
Place of birth - Born in other state (%) - White
Place of birth - Born in other state (%) - Black or African American
Place of birth - Born in other state (%) - Asian
Place of birth - Born in other state (%) - Hispanic or Latino
Place of birth - Born in other state (%) - American Indian and Alaska Native
Place of birth - Born in other state (%) - Multirace
Place of birth - Born in other state (%) - Other Race
Place of birth - Native, outside of US (%)
Place of birth - Native, outside of US (%) - White
Place of birth - Native, outside of US (%) - Black or African American
Place of birth - Native, outside of US (%) - Asian
Place of birth - Native, outside of US (%) - Hispanic or Latino
Place of birth - Native, outside of US (%) - American Indian and Alaska Native
Place of birth - Native, outside of US (%) - Multirace
Place of birth - Native, outside of US (%) - Other Race
Place of birth - Foreign born (%)
Place of birth - Foreign born (%) - White
Place of birth - Foreign born (%) - Black or African American
Place of birth - Foreign born (%) - Asian
Place of birth - Foreign born (%) - Hispanic or Latino
Place of birth - Foreign born (%) - American Indian and Alaska Native
Place of birth - Foreign born (%) - Multirace
Place of birth - Foreign born (%) - Other Race
Residents speaking English at home (%)
Residents speaking English at home - Born in the United States (%)
Residents speaking English at home - Native, born elsewhere (%)
Residents speaking English at home - Foreign born (%)
Residents speaking Spanish at home (%)
Residents speaking Spanish at home - Born in the United States (%)
Residents speaking Spanish at home - Native, born elsewhere (%)
Residents speaking Spanish at home - Foreign born (%)
Residents speaking other language at home (%)
Residents speaking other language at home - Born in the United States (%)
Residents speaking other language at home - Native, born elsewhere (%)
Residents speaking other language at home - Foreign born (%)
Marital status - Never married (%)
Marital status - Now married (%)
Marital status - Separated (%)
Marital status - Widowed (%)
Marital status - Divorced (%)
Ancestries Reported - Arab (%)
Ancestries Reported - Czech (%)
Ancestries Reported - Danish (%)
Ancestries Reported - Dutch (%)
Ancestries Reported - English (%)
Ancestries Reported - French (%)
Ancestries Reported - French Canadian (%)
Ancestries Reported - German (%)
Ancestries Reported - Greek (%)
Ancestries Reported - Hungarian (%)
Ancestries Reported - Irish (%)
Ancestries Reported - Italian (%)
Ancestries Reported - Lithuanian (%)
Ancestries Reported - Norwegian (%)
Ancestries Reported - Polish (%)
Ancestries Reported - Portuguese (%)
Ancestries Reported - Russian (%)
Ancestries Reported - Scotch-Irish (%)
Ancestries Reported - Scottish (%)
Ancestries Reported - Slovak (%)
Ancestries Reported - Subsaharan African (%)
Ancestries Reported - Swedish (%)
Ancestries Reported - Swiss (%)
Ancestries Reported - Ukrainian (%)
Ancestries Reported - United States (%)
Ancestries Reported - Welsh (%)
Ancestries Reported - West Indian (%)
Ancestries Reported - Other (%)
Geographical mobility - Same house 1 year ago (%)
Geographical mobility - Same house 1 year ago (%) - White
Geographical mobility - Same house 1 year ago (%) - Black or African American
Geographical mobility - Same house 1 year ago (%) - Asian
Geographical mobility - Same house 1 year ago (%) - Hispanic or Latino
Geographical mobility - Same house 1 year ago (%) - American Indian and Alaska Native
Geographical mobility - Same house 1 year ago (%) - Multirace
Geographical mobility - Same house 1 year ago (%) - Other Race
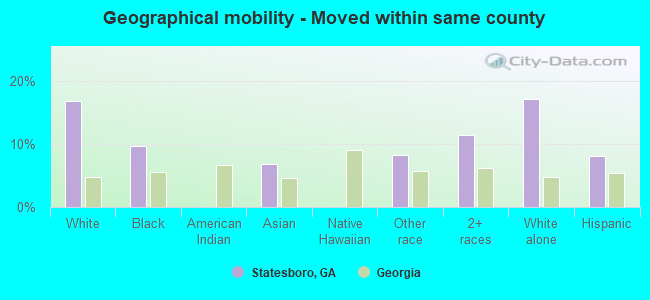
Geographical mobility - Moved within same county (%)
Geographical mobility - Moved within same county (%) - White
Geographical mobility - Moved within same county (%) - Black or African American
Geographical mobility - Moved within same county (%) - Asian
Geographical mobility - Moved within same county (%) - Hispanic or Latino
Geographical mobility - Moved within same county (%) - American Indian and Alaska Native
Geographical mobility - Moved within same county (%) - Multirace
Geographical mobility - Moved within same county (%) - Other Race
Geographical mobility - Moved from different county within same state (%)
Geographical mobility - Moved from different county within same state (%) - White
Geographical mobility - Moved from different county within same state (%) - Black or African American
Geographical mobility - Moved from different county within same state (%) - Asian
Geographical mobility - Moved from different county within same state (%) - Hispanic or Latino
Geographical mobility - Moved from different county within same state (%) - American Indian and Alaska Native
Geographical mobility - Moved from different county within same state (%) - Multirace
Geographical mobility - Moved from different county within same state (%) - Other Race
Geographical mobility - Moved from different state (%)
Geographical mobility - Moved from different state (%) - White
Geographical mobility - Moved from different state (%) - Black or African American
Geographical mobility - Moved from different state (%) - Asian
Geographical mobility - Moved from different state (%) - Hispanic or Latino
Geographical mobility - Moved from different state (%) - American Indian and Alaska Native
Geographical mobility - Moved from different state (%) - Multirace
Geographical mobility - Moved from different state (%) - Other Race
Geographical mobility - Moved from abroad (%)
Geographical mobility - Moved from abroad (%) - White
Geographical mobility - Moved from abroad (%) - Black or African American
Geographical mobility - Moved from abroad (%) - Asian
Geographical mobility - Moved from abroad (%) - Hispanic or Latino
Geographical mobility - Moved from abroad (%) - American Indian and Alaska Native
Geographical mobility - Moved from abroad (%) - Multirace
Geographical mobility - Moved from abroad (%) - Other Race
Place of birth for the foreign-born population - Ireland (%)
Place of birth for the foreign-born population - Denmark (%)
Place of birth for the foreign-born population - Norway (%)
Place of birth for the foreign-born population - Sweden (%)
Place of birth for the foreign-born population - United Kingdom (%)
Place of birth for the foreign-born population - England (%)
Place of birth for the foreign-born population - Scotland (%)
Place of birth for the foreign-born population - Other Northern Europe (%)
Place of birth for the foreign-born population - Austria (%)
Place of birth for the foreign-born population - Belgium (%)
Place of birth for the foreign-born population - France (%)
Place of birth for the foreign-born population - Germany (%)
Place of birth for the foreign-born population - Netherlands (%)
Place of birth for the foreign-born population - Switzerland (%)
Place of birth for the foreign-born population - Other Western Europe (%)
Place of birth for the foreign-born population - Greece (%)
Place of birth for the foreign-born population - Italy (%)
Place of birth for the foreign-born population - Portugal (%)
Place of birth for the foreign-born population - Spain (%)
Place of birth for the foreign-born population - Other Southern Europe (%)
Place of birth for the foreign-born population - Albania (%)
Place of birth for the foreign-born population - Belarus (%)
Place of birth for the foreign-born population - Bosnia and Herzegovina (%)
Place of birth for the foreign-born population - Bulgaria (%)
Place of birth for the foreign-born population - Croatia (%)
Place of birth for the foreign-born population - Czechoslovakia (%)
Place of birth for the foreign-born population - Hungary (%)
Place of birth for the foreign-born population - Latvia (%)
Place of birth for the foreign-born population - Lithuania (%)
Place of birth for the foreign-born population - North Macedonia (Macedonia) (%)
Place of birth for the foreign-born population - Moldova (%)
Place of birth for the foreign-born population - Poland (%)
Place of birth for the foreign-born population - Romania (%)
Place of birth for the foreign-born population - Russia (%)
Place of birth for the foreign-born population - Serbia (%)
Place of birth for the foreign-born population - Ukraine (%)
Place of birth for the foreign-born population - Other Eastern Europe (%)
Place of birth for the foreign-born population - China (%)
Place of birth for the foreign-born population - Hong Kong (%)
Place of birth for the foreign-born population - Taiwan (%)
Place of birth for the foreign-born population - Japan (%)
Place of birth for the foreign-born population - Korea (%)
Place of birth for the foreign-born population - Other Eastern Asia (%)
Place of birth for the foreign-born population - Afghanistan (%)
Place of birth for the foreign-born population - Bangladesh (%)
Place of birth for the foreign-born population - India (%)
Place of birth for the foreign-born population - Iran (%)
Place of birth for the foreign-born population - Kazakhstan (%)
Place of birth for the foreign-born population - Nepal (%)
Place of birth for the foreign-born population - Pakistan (%)
Place of birth for the foreign-born population - Sri Lanka (%)
Place of birth for the foreign-born population - Uzbekistan (%)
Place of birth for the foreign-born population - Other South Central Asia (%)
Place of birth for the foreign-born population - Burma (%)
Place of birth for the foreign-born population - Cambodia (%)
Place of birth for the foreign-born population - Indonesia (%)
Place of birth for the foreign-born population - Laos (%)
Place of birth for the foreign-born population - Malaysia (%)
Place of birth for the foreign-born population - Philippines (%)
Place of birth for the foreign-born population - Singapore (%)
Place of birth for the foreign-born population - Thailand (%)
Place of birth for the foreign-born population - Vietnam (%)
Place of birth for the foreign-born population - Other South Eastern Asia (%)
Place of birth for the foreign-born population - Armenia (%)
Place of birth for the foreign-born population - Iraq (%)
Place of birth for the foreign-born population - Israel (%)
Place of birth for the foreign-born population - Jordan (%)
Place of birth for the foreign-born population - Kuwait (%)
Place of birth for the foreign-born population - Lebanon (%)
Place of birth for the foreign-born population - Saudi Arabia (%)
Place of birth for the foreign-born population - Syria (%)
Place of birth for the foreign-born population - Turkey (%)
Place of birth for the foreign-born population - Yemen (%)
Place of birth for the foreign-born population - Other Western Asia (%)
Place of birth for the foreign-born population - Eritrea (%)
Place of birth for the foreign-born population - Ethiopia (%)
Place of birth for the foreign-born population - Kenya (%)
Place of birth for the foreign-born population - Somalia (%)
Place of birth for the foreign-born population - Uganda (%)
Place of birth for the foreign-born population - Zimbabwe (%)
Place of birth for the foreign-born population - Other Eastern Africa (%)
Place of birth for the foreign-born population - Cameroon (%)
Place of birth for the foreign-born population - Congo (%)
Place of birth for the foreign-born population - Democratic Republic of Congo (Zaire) (%)
Place of birth for the foreign-born population - Other Middle Africa (%)
Place of birth for the foreign-born population - Egypt (%)
Place of birth for the foreign-born population - Morocco (%)
Place of birth for the foreign-born population - Sudan (%)
Place of birth for the foreign-born population - Other Northern Africa (%)
Place of birth for the foreign-born population - South Africa (%)
Place of birth for the foreign-born population - Other Southern Africa (%)
Place of birth for the foreign-born population - Cabo Verde (%)
Place of birth for the foreign-born population - Ghana (%)
Place of birth for the foreign-born population - Liberia (%)
Place of birth for the foreign-born population - Nigeria (%)
Place of birth for the foreign-born population - Senegal (%)
Place of birth for the foreign-born population - Sierra Leone (%)
Place of birth for the foreign-born population - Other Western Africa (%)
Place of birth for the foreign-born population - Australia (%)
Place of birth for the foreign-born population - New Zealand (%)
Place of birth for the foreign-born population - Fiji (%)
Place of birth for the foreign-born population - Micronesia (%)
Place of birth for the foreign-born population - Bahamas (%)
Place of birth for the foreign-born population - Barbados (%)
Place of birth for the foreign-born population - Cuba (%)
Place of birth for the foreign-born population - Dominica (%)
Place of birth for the foreign-born population - Dominican Republic (%)
Place of birth for the foreign-born population - Grenada (%)
Place of birth for the foreign-born population - Haiti (%)
Place of birth for the foreign-born population - Jamaica (%)
Place of birth for the foreign-born population - St. Vincent and the Grenadines (%)
Place of birth for the foreign-born population - Trinidad and Tobago (%)
Place of birth for the foreign-born population - West Indies (%)
Place of birth for the foreign-born population - Other Caribbean (%)
Place of birth for the foreign-born population - Belize (%)
Place of birth for the foreign-born population - Costa Rica (%)
Place of birth for the foreign-born population - El Salvador (%)
Place of birth for the foreign-born population - Guatemala (%)
Place of birth for the foreign-born population - Honduras (%)
Place of birth for the foreign-born population - Mexico (%)
Place of birth for the foreign-born population - Nicaragua (%)
Place of birth for the foreign-born population - Panama (%)
Place of birth for the foreign-born population - Other Central America (%)
Place of birth for the foreign-born population - Argentina (%)
Place of birth for the foreign-born population - Bolivia (%)
Place of birth for the foreign-born population - Brazil (%)
Place of birth for the foreign-born population - Chile (%)
Place of birth for the foreign-born population - Colombia (%)
Place of birth for the foreign-born population - Ecuador (%)
Place of birth for the foreign-born population - Guyana (%)
Place of birth for the foreign-born population - Peru (%)
Place of birth for the foreign-born population - Uruguay (%)
Place of birth for the foreign-born population - Venezuela (%)
Place of birth for the foreign-born population - Other South America (%)
Place of birth for the foreign-born population - Canada (%)
Place of birth for the foreign-born population - Other Northern America (%)
Place of birth for the foreign-born population - Other (%)
Latest news about races in Statesboro, GA collected exclusively by city-data.com from local newspapers, TV, and radio stations
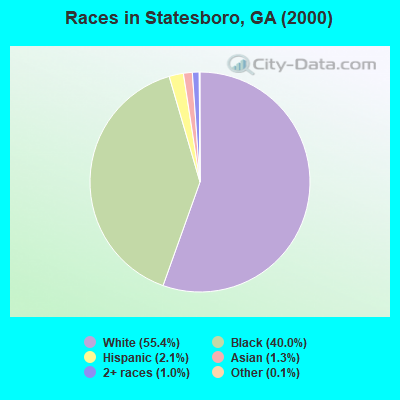
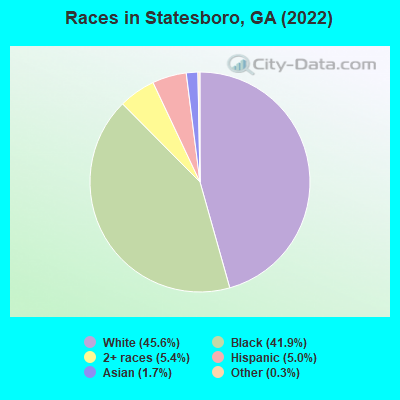
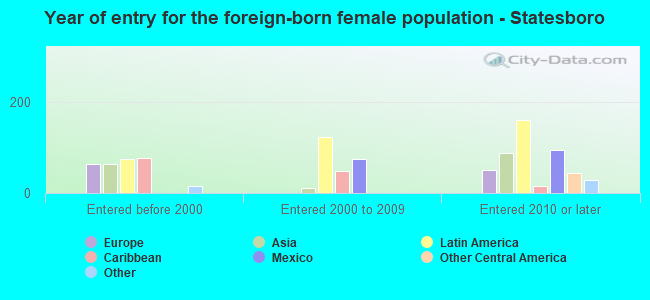
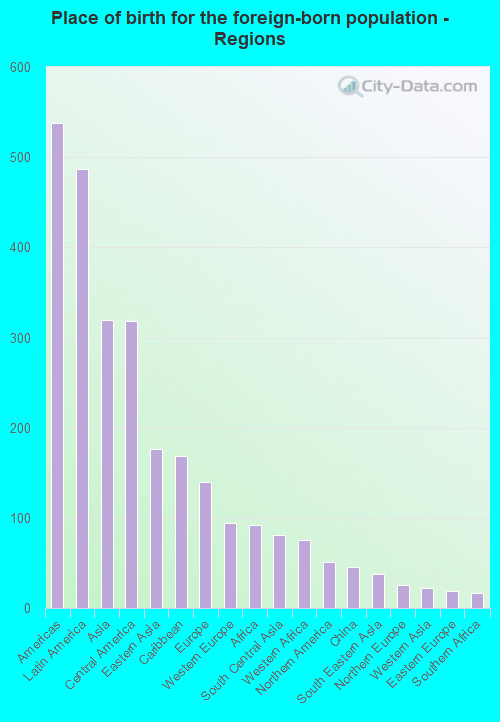
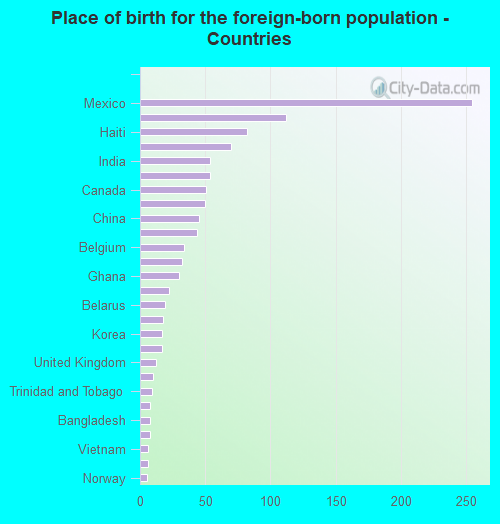
According to 2022 data, the most numerous races in Statesboro, GA are White alone (15,414 residents), Black alone (14,161 residents), and Hispanic (1,687 residents). 94.2% of Statesboro residents speak English at home. 3.2% of Statesboro, GA residents are foreign-born (1.4% born in Latin America, 0.9% born in Asia, 0.4% born in Europe), which is 216.5% less than the foreign-born rate of 10.0% across the entire state of Georgia.
Race distribution in Statesboro
2000 2022
5,128,661 62.6% White alone 2,331,465 28.5% Black alone 435,227 5.3% Hispanic 171,513 2.1% Asian alone 87,364 1.1% Two or more races 17,670 0.2% American Indian alone 11,275 0.1% Other race alone 3,278 0.04% Native Hawaiian and Other
5,415,657 49.6% White alone 3,349,240 30.7% Black alone 1,132,604 10.4% Hispanic 479,156 4.4% Asian alone 462,923 4.2% Two or more races 54,416 0.5% Other race alone 11,923 0.1% American Indian alone 6,957 0.06% Native Hawaiian and Other
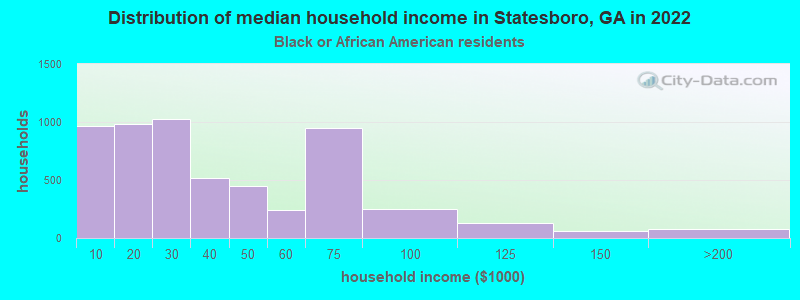
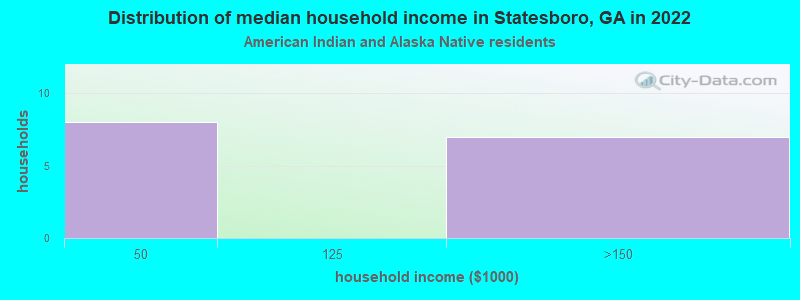
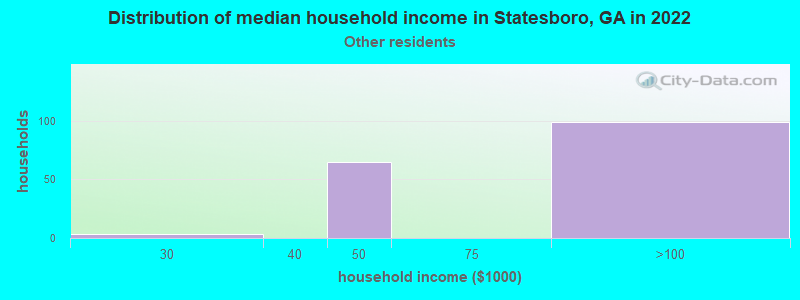
Income and house value in Statesboro Median household income in 2022 $38,401 White non-Hispanic householders$30,144 Black householders$48,179 Asian householders$82,961 Some other race householders$28,197 Hispanic or Latino race householdersMedian 2022 house value $192,876 White Non-Hispanic householders$138,735 Black or African American householders $137,466 Asian householders
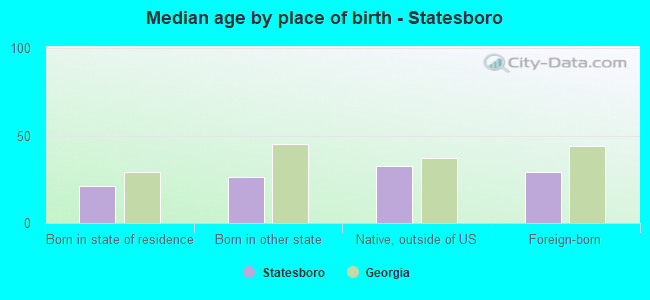
Median age by race in Statesboro
23.1 Median age for White residents22.2 22.7 22.6 Median age for Black or African American residents24.4 19.2 43.4 Median age for American Indian / Alaska Native residents43.4 -597,938,143.7 17.2 Median age for Asian residents19.2 19.6 -657,243,815.6 Median age for Native Hawaiian / Pacific Islander residents-693,227,090.9 -776,776,776.0 32.3 Median age for Other race residents38.2 32.2 21.0 Median age for Two or more races residents20.1 32.4 23.6 Median age for White alone residents23.8 23.0 20.8 Median age for Hispanic or Latino residents19.1 23.0
Owner/renter occupied households by race in Statesboro
House owners and renters - White residents 1,633 23.8% Owner occupied5,226 76.2% Renter occupiedHouse owners and renters - Black or African American residents 528 9.9% Owner occupied4,802 90.1% Renter occupiedHouse owners and renters - American Indian / Alaska Native residents 19 100.0% Owner occupiedHouse owners and renters - Asian residents 46 23.1% Owner occupied152 76.9% Renter occupiedHouse owners and renters - Native Hawaiian / Pacific Islander residents 8 100.0% Renter occupiedHouse owners and renters - Other race residents 57 36.4% Owner occupied99 63.6% Renter occupiedHouse owners and renters - Two or more races residents 38 5.5% Owner occupied648 94.5% Renter occupiedHouse owners and renters - White alone residents 1,575 23.4% Owner occupied5,147 76.6% Renter occupiedHouse owners and renters - Hispanic or Latino residents 169 27.6% Owner occupied442 72.4% Renter occupied
Language usage in Statesboro
English speakers - Total 94.2% of residents of Statesboro speak English at home.
3.0% of residents speak Spanish at home 702 71.5% Speak English very well280 28.5% Speak English less than very well2.7% of residents speak other language at home 826 92.2% Speak English very well70 7.8% Speak English less than very well
English speakers - Born in the United States 95.2% of residents of Statesboro speak English at home.
3.6% of residents speak Spanish at home 294 90.5% Speak English very well31 9.5% Speak English less than very well1.9% of residents speak other language at home 161 95.8% Speak English very well7 4.2% Speak English less than very well
English speakers - Native, born elsewhere 27.9% of residents of Statesboro speak English at home.
25.2% of residents speak Spanish at home 61 83.6% Speak English very well12 16.4% Speak English less than very well73.1% of residents speak other language at home 212 100.0% Speak English very well
English speakers - Foreign-born 16.4% of residents of Statesboro speak English at home.
44.6% of residents speak Spanish at home 219 52.8% Speak English very well196 47.2% Speak English less than very well40.3% of residents speak other language at home 308 82.1% Speak English very well67 17.9% Speak English less than very well
White (Caucasian) - Speak only English Native:
98.5% (14,783)Foreign-born:
26.9% (46)
White (Caucasian) - Speak another language Native:
1.9% (285)Foreign-born:
71.2% (122)
Black or African American - Speak only English Native:
99.2% (13,158)Foreign-born:
20.4% (38)
Black or African American - Speak another language Native:
0.6% (79)Foreign-born:
80.8% (149)
Asian - Speak only English Native:
38.9% (97)Foreign-born:
12.4% (37)
Asian - Speak another language Native:
61.6% (154)Foreign-born:
87.4% (261)
Other race - Speak only English Native:
48.8% (120)Foreign-born:
4.1% (13)
Other race - Speak another language Native:
49.7% (122)Foreign-born:
95.6% (314)
Two or more races - Speak only English Native:
89.1% (2,215)Foreign-born:
20.8% (17)
Two or more races - Speak another language Native:
11.3% (280)Foreign-born:
79.5% (65)
White alone - Speak only English Native:
98.7% (14,708)Foreign-born:
32.5% (51)
White alone - Speak another language Native:
1.4% (202)Foreign-born:
67.4% (105)
Hispanic or Latino - Speak only English Native:
56.6% (609)Foreign-born:
5.4% (22)
Hispanic or Latino - Speak another language Native:
43.4% (467)Foreign-born:
94.2% (377)
Foreign-born residents in Statesboro 1,091 residents are foreign born (1.4% Latin America , 0.9% Asia , 0.4% Europe ).
This city:
3.2%Georgia:
10.4%
Marital status for residents in Statesboro Marital status - White (Caucasian) population 15 years and over
Males 73.6% Never married19.1% Now married1.5% Separated0.8% Widowed5.0% DivorcedFemales 62.8% Never married17.1% Now married2.3% Separated4.2% Widowed13.6% DivorcedWomen who gave birth in the past 12 months Now married:
100.0% (75)Unmarried:
0.0% (0)
Women who did not give birth in the past 12 months Now married:
13.9% (851)Unmarried:
86.1% (5,294)
Marital status - Black or African American population 15 years and over
Males 71.1% Never married16.4% Now married1.1% Separated3.6% Widowed7.7% DivorcedFemales 72.4% Never married11.5% Now married3.9% Separated4.0% Widowed8.3% DivorcedWomen who gave birth in the past 12 months Now married:
22.9% (32)Unmarried:
77.1% (107)
Women who did not give birth in the past 12 months Now married:
10.1% (497)Unmarried:
89.9% (4,399)
Marital status - Asian population 15 years and over
Males 76.8% Never married19.2% Now married0.0% Separated4.0% Widowed0.0% DivorcedFemales 53.2% Never married46.8% Now married0.0% Separated0.0% Widowed0.0% DivorcedWomen who did not give birth in the past 12 months Now married:
31.3% (73)Unmarried:
68.7% (161)
Marital status - Other race population 15 years and over
Males 43.4% Never married56.6% Now married0.0% Separated0.0% Widowed0.0% DivorcedFemales 54.9% Never married45.1% Now married0.0% Separated0.0% Widowed0.0% DivorcedWomen who gave birth in the past 12 months Now married:
100.0% (30)Unmarried:
0.0% (0)
Women who did not give birth in the past 12 months Now married:
26.6% (84)Unmarried:
73.4% (232)
Marital status - Two or more races population 15 years and over
Males 78.9% Never married14.2% Now married0.0% Separated0.0% Widowed6.9% DivorcedFemales 64.7% Never married20.4% Now married10.7% Separated0.0% Widowed4.2% DivorcedWomen who gave birth in the past 12 months Now married:
0.0% (0)Unmarried:
100.0% (24)
Women who did not give birth in the past 12 months Now married:
28.7% (246)Unmarried:
71.3% (611)
Marital status - White alone, not Hispanic / Latino population 15 years and over
Males 73.8% Never married19.0% Now married1.6% Separated0.8% Widowed4.8% DivorcedFemales 62.9% Never married16.9% Now married2.4% Separated4.3% Widowed13.6% DivorcedWomen who gave birth in the past 12 months Now married:
100.0% (75)Unmarried:
0.0% (0)
Women who did not give birth in the past 12 months Now married:
13.4% (795)Unmarried:
86.6% (5,117)
Marital status - Hispanic or Latino population 15 years and over
Males 69.3% Never married24.5% Now married0.0% Separated0.0% Widowed6.2% DivorcedFemales 58.8% Never married27.0% Now married9.4% Separated0.0% Widowed4.9% DivorcedWomen who gave birth in the past 12 months Now married:
100.0% (25)Unmarried:
0.0% (0)
Women who did not give birth in the past 12 months Now married:
21.9% (130)Unmarried:
78.1% (466)
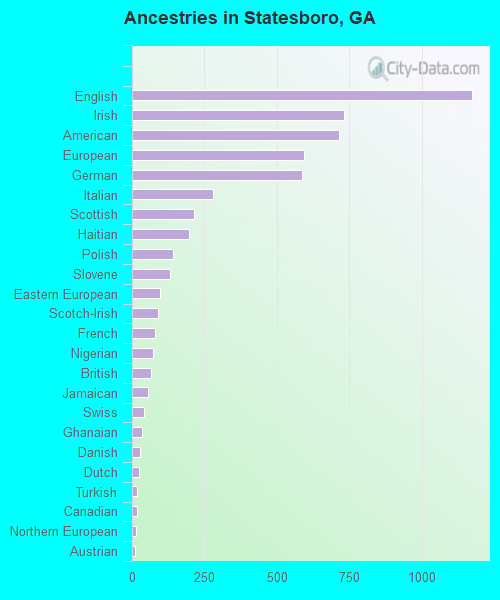
Ancestries in Statesboro
1,173 6.1% English730 3.8% Irish713 3.7% American593 3.1% European587 3.0% German279 1.4% Italian214 1.1% Scottish196 1.0% Haitian142 0.7% Polish131 0.7% Slovene96 0.5% Eastern European89 0.5% Scotch-Irish80 0.4% French73 0.4% Nigerian66 0.3% British54 0.3% Jamaican42 0.2% Swiss36 0.2% Ghanaian27 0.1% Danish23 0.1% Dutch18 0.09% Turkish16 0.08% Canadian13 0.07% Northern European11 0.06% Austrian10 0.05% Afghan10 0.05% South African9 0.05% Swedish9 0.05% West Indian5 0.03% Hungarian5 0.03% French Canadian5 0.03% Slovak4 0.02% Norwegian4 0.02% Scandinavian4 0.02% Czech4 0.02% Brazilian3 0.02% African2 0.01% Kenyan
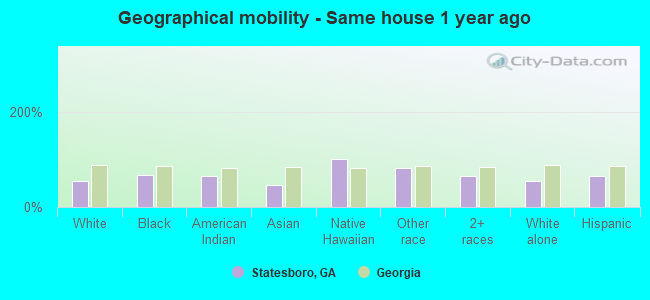
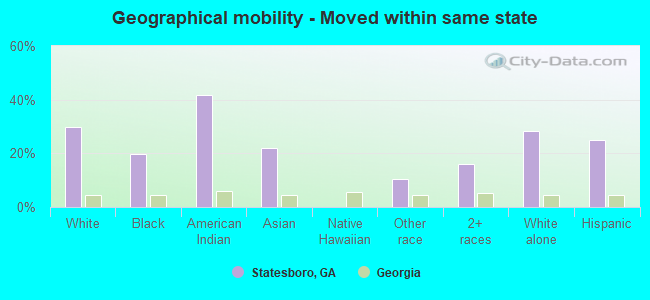
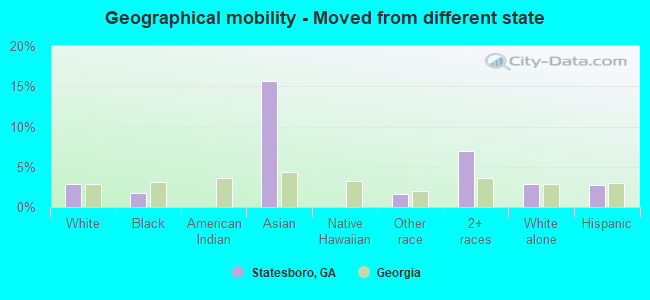
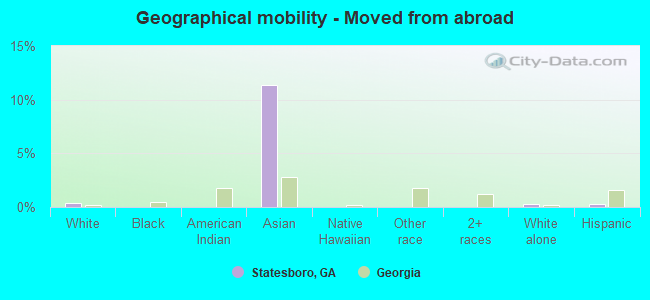
Geographical mobility in Statesboro Same house 1 year ago 8,940 54.2% White (Caucasian)9,799 67.5% Black or African American20 66.3% American Indian / Alaska Native274 46.7% Asian10 100.0% Native Hawaiian / Pacific Islander463 81.0% Other race1,734 65.0% Two or more races8,752 54.5% White alone, not Hispanic / Latino1,090 65.2% Hispanic or LatinoMoved within same county 2,767 16.8% White / Caucasian1,412 9.7% Black or African American40 6.9% Asian47 8.3% Other race306 11.5% Two or more races2,747 17.1% White alone, not Hispanic / Latino135 8.1% Hispanic or LatinoMoved within same state 4,891 29.7% White / Caucasian2,861 19.7% Black or African American13 41.6% American Indian / Alaska Native129 22.1% Asian59 10.3% Other race432 16.2% Two or more races4,551 28.4% White alone, not Hispanic / Latino416 24.9% Hispanic or LatinoMoved from different state 461 2.8% White / Caucasian260 1.8% Black or African American92 15.7% Asian10 1.7% Other race186 7.0% Two or more races460 2.9% White alone, not Hispanic / Latino46 2.7% Hispanic or LatinoMoved from abroad 54 0.3% White5 0.0% Black or African American67 11.4% Asian49 0.3% White alone, not Hispanic / Latino5 0.3% Hispanic or Latino
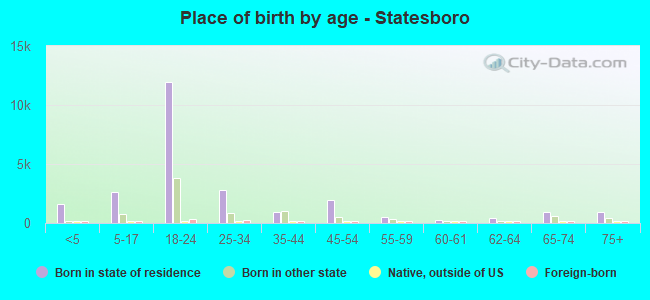
Children Nativity (place of birth) in Statesboro
Children under 6 years - Living with two parents Both parents native 544 100.0% NativeBoth parents foreign-born 40 100.0% NativeChildren under 6 years - Living with one parent Native parent 830 100.0% NativeChildren 6 to 17 years - Living with two parents Both parents native 1,058 100.0% NativeBoth parents foreign-born 144 100.0% NativeChildren 6 to 17 years - Living with one parent Native parent 2,088 100.0% NativeForeign-born parent 52 50.3% Native51 49.7% Foreign-born
Grandparents responsible for own grandchildren in Statesboro
Grandparents (30 to 59 years) White / Caucasian 8 7.9% Responsible for grandchildren89 92.1% Not responsible for grandchildrenBlack or African American 7 100.0% Not responsible for grandchildrenTwo or more races 20 100.0% Not responsible for grandchildrenWhite alone, not Hispanic / Latino 8 7.6% Responsible for grandchildren95 92.4% Not responsible for grandchildrenGrandparents (60 years and over) White / Caucasian 34 100.0% Responsible for grandchildrenBlack or African American 116 68.1% Responsible for grandchildren54 31.9% Not responsible for grandchildrenWhite alone, not Hispanic / Latino 34 100.0% Responsible for grandchildren