Races in Statesville, North Carolina (NC) Detailed Stats
Data:
Races - White alone (%)
Races - White alone (% change since 2000)
Races - Black alone (%)
Races - Black alone (% change since 2000)
Races - American Indian alone (%)
Races - American Indian alone (% change since 2000)
Races - Asian alone (%)
Races - Asian alone (% change since 2000)
Races - Hispanic (%)
Races - Hispanic (% change since 2000)
Races - Native Hawaiian and Other Pacific Islander alone (%)
Races - Native Hawaiian and Other Pacific Islander alone (% change since 2000)
Races - Two or more races(%)
Races - Two or more races(% change since 2000)
Races - Other race alone (%)
Races - Other race alone (% change since 2000)
Racial diversity
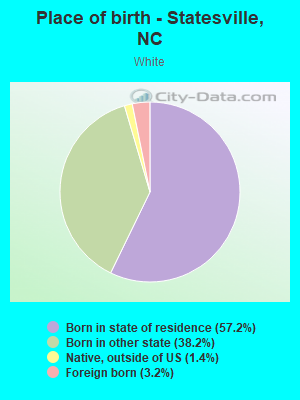
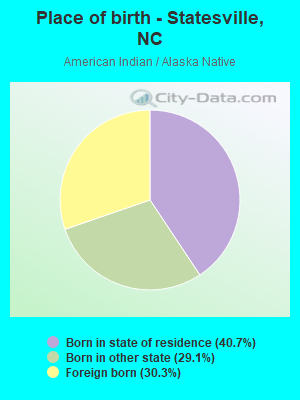
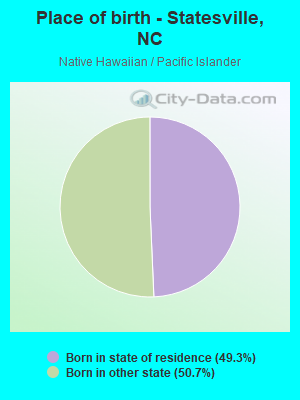
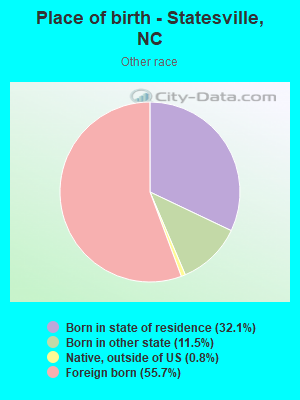
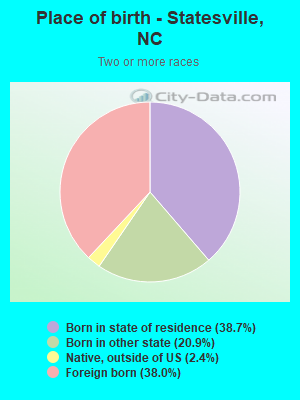
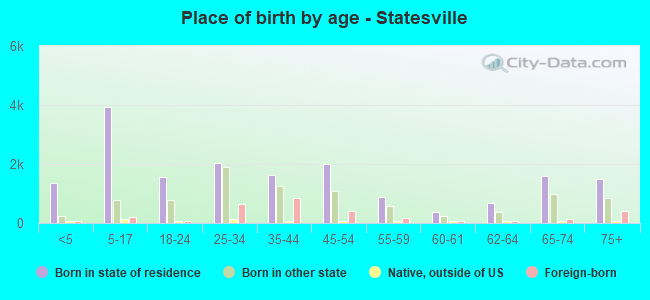
Place of birth - Born in state of residence (%)
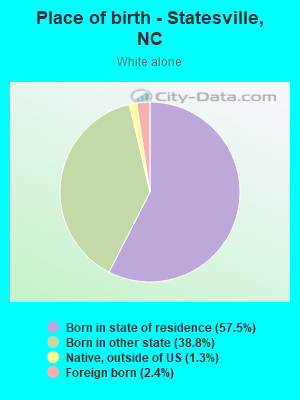
Place of birth - Born in state of residence (%) - White
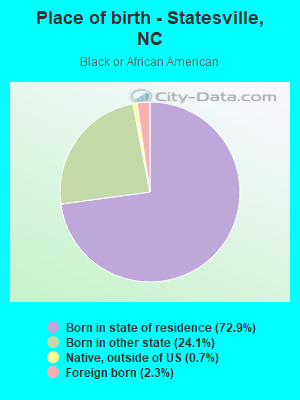
Place of birth - Born in state of residence (%) - Black or African American
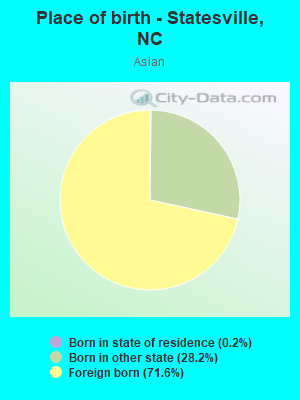
Place of birth - Born in state of residence (%) - Asian
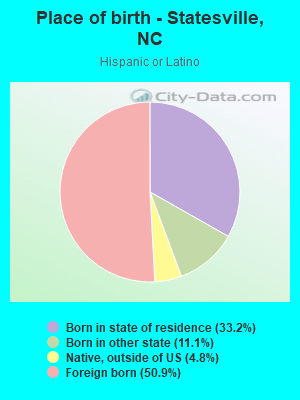
Place of birth - Born in state of residence (%) - Hispanic or Latino
Place of birth - Born in state of residence (%) - American Indian and Alaska Native
Place of birth - Born in state of residence (%) - Multirace
Place of birth - Born in state of residence (%) - Other Race
Place of birth - Born in other state (%)
Place of birth - Born in other state (%) - White
Place of birth - Born in other state (%) - Black or African American
Place of birth - Born in other state (%) - Asian
Place of birth - Born in other state (%) - Hispanic or Latino
Place of birth - Born in other state (%) - American Indian and Alaska Native
Place of birth - Born in other state (%) - Multirace
Place of birth - Born in other state (%) - Other Race
Place of birth - Native, outside of US (%)
Place of birth - Native, outside of US (%) - White
Place of birth - Native, outside of US (%) - Black or African American
Place of birth - Native, outside of US (%) - Asian
Place of birth - Native, outside of US (%) - Hispanic or Latino
Place of birth - Native, outside of US (%) - American Indian and Alaska Native
Place of birth - Native, outside of US (%) - Multirace
Place of birth - Native, outside of US (%) - Other Race
Place of birth - Foreign born (%)
Place of birth - Foreign born (%) - White
Place of birth - Foreign born (%) - Black or African American
Place of birth - Foreign born (%) - Asian
Place of birth - Foreign born (%) - Hispanic or Latino
Place of birth - Foreign born (%) - American Indian and Alaska Native
Place of birth - Foreign born (%) - Multirace
Place of birth - Foreign born (%) - Other Race
Residents speaking English at home (%)
Residents speaking English at home - Born in the United States (%)
Residents speaking English at home - Native, born elsewhere (%)
Residents speaking English at home - Foreign born (%)
Residents speaking Spanish at home (%)
Residents speaking Spanish at home - Born in the United States (%)
Residents speaking Spanish at home - Native, born elsewhere (%)
Residents speaking Spanish at home - Foreign born (%)
Residents speaking other language at home (%)
Residents speaking other language at home - Born in the United States (%)
Residents speaking other language at home - Native, born elsewhere (%)
Residents speaking other language at home - Foreign born (%)
Marital status - Never married (%)
Marital status - Now married (%)
Marital status - Separated (%)
Marital status - Widowed (%)
Marital status - Divorced (%)
Ancestries Reported - Arab (%)
Ancestries Reported - Czech (%)
Ancestries Reported - Danish (%)
Ancestries Reported - Dutch (%)
Ancestries Reported - English (%)
Ancestries Reported - French (%)
Ancestries Reported - French Canadian (%)
Ancestries Reported - German (%)
Ancestries Reported - Greek (%)
Ancestries Reported - Hungarian (%)
Ancestries Reported - Irish (%)
Ancestries Reported - Italian (%)
Ancestries Reported - Lithuanian (%)
Ancestries Reported - Norwegian (%)
Ancestries Reported - Polish (%)
Ancestries Reported - Portuguese (%)
Ancestries Reported - Russian (%)
Ancestries Reported - Scotch-Irish (%)
Ancestries Reported - Scottish (%)
Ancestries Reported - Slovak (%)
Ancestries Reported - Subsaharan African (%)
Ancestries Reported - Swedish (%)
Ancestries Reported - Swiss (%)
Ancestries Reported - Ukrainian (%)
Ancestries Reported - United States (%)
Ancestries Reported - Welsh (%)
Ancestries Reported - West Indian (%)
Ancestries Reported - Other (%)
Geographical mobility - Same house 1 year ago (%)
Geographical mobility - Same house 1 year ago (%) - White
Geographical mobility - Same house 1 year ago (%) - Black or African American
Geographical mobility - Same house 1 year ago (%) - Asian
Geographical mobility - Same house 1 year ago (%) - Hispanic or Latino
Geographical mobility - Same house 1 year ago (%) - American Indian and Alaska Native
Geographical mobility - Same house 1 year ago (%) - Multirace
Geographical mobility - Same house 1 year ago (%) - Other Race
Geographical mobility - Moved within same county (%)
Geographical mobility - Moved within same county (%) - White
Geographical mobility - Moved within same county (%) - Black or African American
Geographical mobility - Moved within same county (%) - Asian
Geographical mobility - Moved within same county (%) - Hispanic or Latino
Geographical mobility - Moved within same county (%) - American Indian and Alaska Native
Geographical mobility - Moved within same county (%) - Multirace
Geographical mobility - Moved within same county (%) - Other Race
Geographical mobility - Moved from different county within same state (%)
Geographical mobility - Moved from different county within same state (%) - White
Geographical mobility - Moved from different county within same state (%) - Black or African American
Geographical mobility - Moved from different county within same state (%) - Asian
Geographical mobility - Moved from different county within same state (%) - Hispanic or Latino
Geographical mobility - Moved from different county within same state (%) - American Indian and Alaska Native
Geographical mobility - Moved from different county within same state (%) - Multirace
Geographical mobility - Moved from different county within same state (%) - Other Race
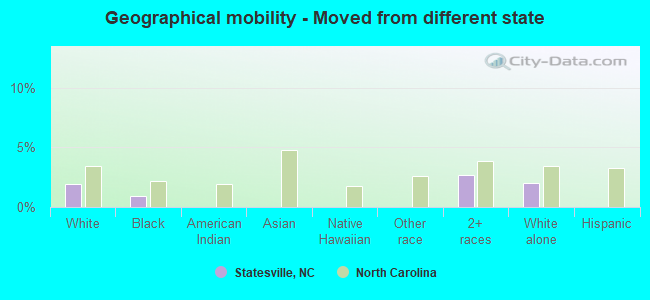
Geographical mobility - Moved from different state (%)
Geographical mobility - Moved from different state (%) - White
Geographical mobility - Moved from different state (%) - Black or African American
Geographical mobility - Moved from different state (%) - Asian
Geographical mobility - Moved from different state (%) - Hispanic or Latino
Geographical mobility - Moved from different state (%) - American Indian and Alaska Native
Geographical mobility - Moved from different state (%) - Multirace
Geographical mobility - Moved from different state (%) - Other Race
Geographical mobility - Moved from abroad (%)
Geographical mobility - Moved from abroad (%) - White
Geographical mobility - Moved from abroad (%) - Black or African American
Geographical mobility - Moved from abroad (%) - Asian
Geographical mobility - Moved from abroad (%) - Hispanic or Latino
Geographical mobility - Moved from abroad (%) - American Indian and Alaska Native
Geographical mobility - Moved from abroad (%) - Multirace
Geographical mobility - Moved from abroad (%) - Other Race
Place of birth for the foreign-born population - Ireland (%)
Place of birth for the foreign-born population - Denmark (%)
Place of birth for the foreign-born population - Norway (%)
Place of birth for the foreign-born population - Sweden (%)
Place of birth for the foreign-born population - United Kingdom (%)
Place of birth for the foreign-born population - England (%)
Place of birth for the foreign-born population - Scotland (%)
Place of birth for the foreign-born population - Other Northern Europe (%)
Place of birth for the foreign-born population - Austria (%)
Place of birth for the foreign-born population - Belgium (%)
Place of birth for the foreign-born population - France (%)
Place of birth for the foreign-born population - Germany (%)
Place of birth for the foreign-born population - Netherlands (%)
Place of birth for the foreign-born population - Switzerland (%)
Place of birth for the foreign-born population - Other Western Europe (%)
Place of birth for the foreign-born population - Greece (%)
Place of birth for the foreign-born population - Italy (%)
Place of birth for the foreign-born population - Portugal (%)
Place of birth for the foreign-born population - Spain (%)
Place of birth for the foreign-born population - Other Southern Europe (%)
Place of birth for the foreign-born population - Albania (%)
Place of birth for the foreign-born population - Belarus (%)
Place of birth for the foreign-born population - Bosnia and Herzegovina (%)
Place of birth for the foreign-born population - Bulgaria (%)
Place of birth for the foreign-born population - Croatia (%)
Place of birth for the foreign-born population - Czechoslovakia (%)
Place of birth for the foreign-born population - Hungary (%)
Place of birth for the foreign-born population - Latvia (%)
Place of birth for the foreign-born population - Lithuania (%)
Place of birth for the foreign-born population - North Macedonia (Macedonia) (%)
Place of birth for the foreign-born population - Moldova (%)
Place of birth for the foreign-born population - Poland (%)
Place of birth for the foreign-born population - Romania (%)
Place of birth for the foreign-born population - Russia (%)
Place of birth for the foreign-born population - Serbia (%)
Place of birth for the foreign-born population - Ukraine (%)
Place of birth for the foreign-born population - Other Eastern Europe (%)
Place of birth for the foreign-born population - China (%)
Place of birth for the foreign-born population - Hong Kong (%)
Place of birth for the foreign-born population - Taiwan (%)
Place of birth for the foreign-born population - Japan (%)
Place of birth for the foreign-born population - Korea (%)
Place of birth for the foreign-born population - Other Eastern Asia (%)
Place of birth for the foreign-born population - Afghanistan (%)
Place of birth for the foreign-born population - Bangladesh (%)
Place of birth for the foreign-born population - India (%)
Place of birth for the foreign-born population - Iran (%)
Place of birth for the foreign-born population - Kazakhstan (%)
Place of birth for the foreign-born population - Nepal (%)
Place of birth for the foreign-born population - Pakistan (%)
Place of birth for the foreign-born population - Sri Lanka (%)
Place of birth for the foreign-born population - Uzbekistan (%)
Place of birth for the foreign-born population - Other South Central Asia (%)
Place of birth for the foreign-born population - Burma (%)
Place of birth for the foreign-born population - Cambodia (%)
Place of birth for the foreign-born population - Indonesia (%)
Place of birth for the foreign-born population - Laos (%)
Place of birth for the foreign-born population - Malaysia (%)
Place of birth for the foreign-born population - Philippines (%)
Place of birth for the foreign-born population - Singapore (%)
Place of birth for the foreign-born population - Thailand (%)
Place of birth for the foreign-born population - Vietnam (%)
Place of birth for the foreign-born population - Other South Eastern Asia (%)
Place of birth for the foreign-born population - Armenia (%)
Place of birth for the foreign-born population - Iraq (%)
Place of birth for the foreign-born population - Israel (%)
Place of birth for the foreign-born population - Jordan (%)
Place of birth for the foreign-born population - Kuwait (%)
Place of birth for the foreign-born population - Lebanon (%)
Place of birth for the foreign-born population - Saudi Arabia (%)
Place of birth for the foreign-born population - Syria (%)
Place of birth for the foreign-born population - Turkey (%)
Place of birth for the foreign-born population - Yemen (%)
Place of birth for the foreign-born population - Other Western Asia (%)
Place of birth for the foreign-born population - Eritrea (%)
Place of birth for the foreign-born population - Ethiopia (%)
Place of birth for the foreign-born population - Kenya (%)
Place of birth for the foreign-born population - Somalia (%)
Place of birth for the foreign-born population - Uganda (%)
Place of birth for the foreign-born population - Zimbabwe (%)
Place of birth for the foreign-born population - Other Eastern Africa (%)
Place of birth for the foreign-born population - Cameroon (%)
Place of birth for the foreign-born population - Congo (%)
Place of birth for the foreign-born population - Democratic Republic of Congo (Zaire) (%)
Place of birth for the foreign-born population - Other Middle Africa (%)
Place of birth for the foreign-born population - Egypt (%)
Place of birth for the foreign-born population - Morocco (%)
Place of birth for the foreign-born population - Sudan (%)
Place of birth for the foreign-born population - Other Northern Africa (%)
Place of birth for the foreign-born population - South Africa (%)
Place of birth for the foreign-born population - Other Southern Africa (%)
Place of birth for the foreign-born population - Cabo Verde (%)
Place of birth for the foreign-born population - Ghana (%)
Place of birth for the foreign-born population - Liberia (%)
Place of birth for the foreign-born population - Nigeria (%)
Place of birth for the foreign-born population - Senegal (%)
Place of birth for the foreign-born population - Sierra Leone (%)
Place of birth for the foreign-born population - Other Western Africa (%)
Place of birth for the foreign-born population - Australia (%)
Place of birth for the foreign-born population - New Zealand (%)
Place of birth for the foreign-born population - Fiji (%)
Place of birth for the foreign-born population - Micronesia (%)
Place of birth for the foreign-born population - Bahamas (%)
Place of birth for the foreign-born population - Barbados (%)
Place of birth for the foreign-born population - Cuba (%)
Place of birth for the foreign-born population - Dominica (%)
Place of birth for the foreign-born population - Dominican Republic (%)
Place of birth for the foreign-born population - Grenada (%)
Place of birth for the foreign-born population - Haiti (%)
Place of birth for the foreign-born population - Jamaica (%)
Place of birth for the foreign-born population - St. Vincent and the Grenadines (%)
Place of birth for the foreign-born population - Trinidad and Tobago (%)
Place of birth for the foreign-born population - West Indies (%)
Place of birth for the foreign-born population - Other Caribbean (%)
Place of birth for the foreign-born population - Belize (%)
Place of birth for the foreign-born population - Costa Rica (%)
Place of birth for the foreign-born population - El Salvador (%)
Place of birth for the foreign-born population - Guatemala (%)
Place of birth for the foreign-born population - Honduras (%)
Place of birth for the foreign-born population - Mexico (%)
Place of birth for the foreign-born population - Nicaragua (%)
Place of birth for the foreign-born population - Panama (%)
Place of birth for the foreign-born population - Other Central America (%)
Place of birth for the foreign-born population - Argentina (%)
Place of birth for the foreign-born population - Bolivia (%)
Place of birth for the foreign-born population - Brazil (%)
Place of birth for the foreign-born population - Chile (%)
Place of birth for the foreign-born population - Colombia (%)
Place of birth for the foreign-born population - Ecuador (%)
Place of birth for the foreign-born population - Guyana (%)
Place of birth for the foreign-born population - Peru (%)
Place of birth for the foreign-born population - Uruguay (%)
Place of birth for the foreign-born population - Venezuela (%)
Place of birth for the foreign-born population - Other South America (%)
Place of birth for the foreign-born population - Canada (%)
Place of birth for the foreign-born population - Other Northern America (%)
Place of birth for the foreign-born population - Other (%)
Latest news about races in Statesville, NC collected exclusively by city-data.com from local newspapers, TV, and radio stations
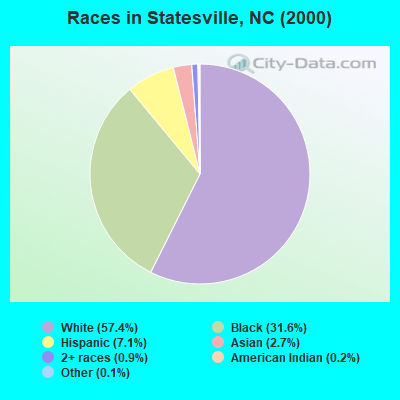
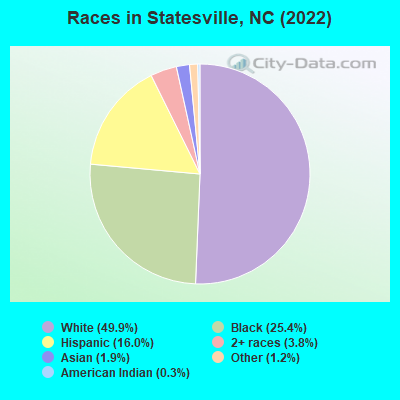
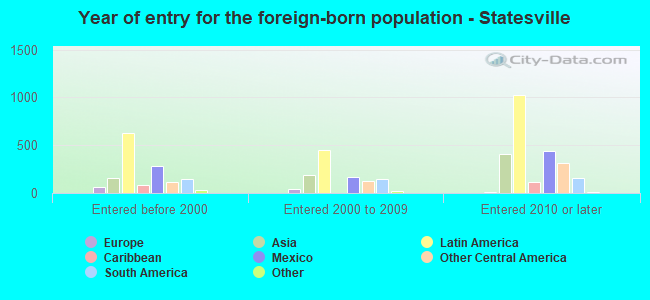
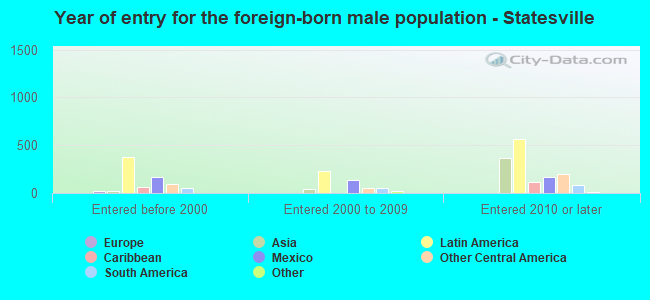
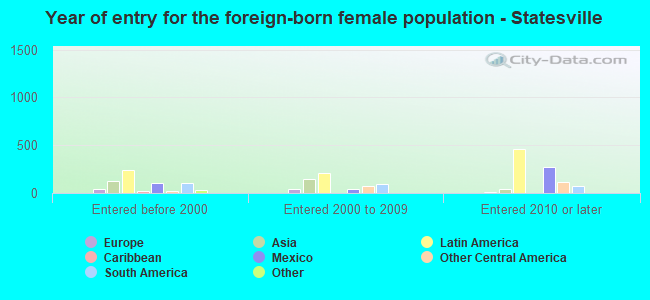
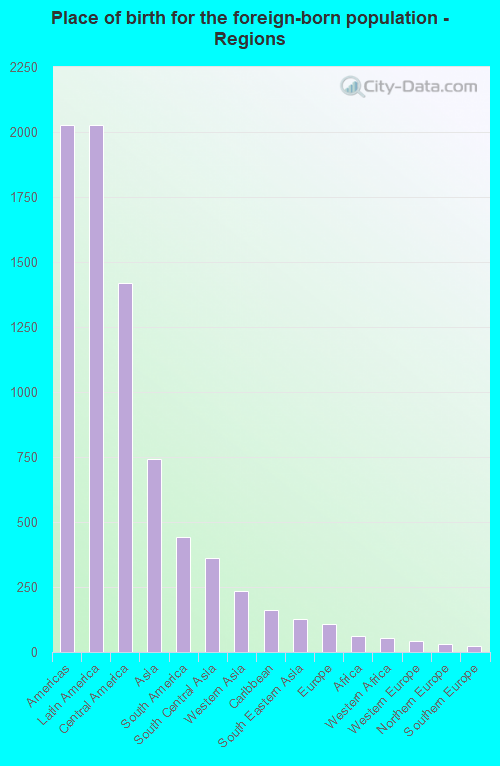
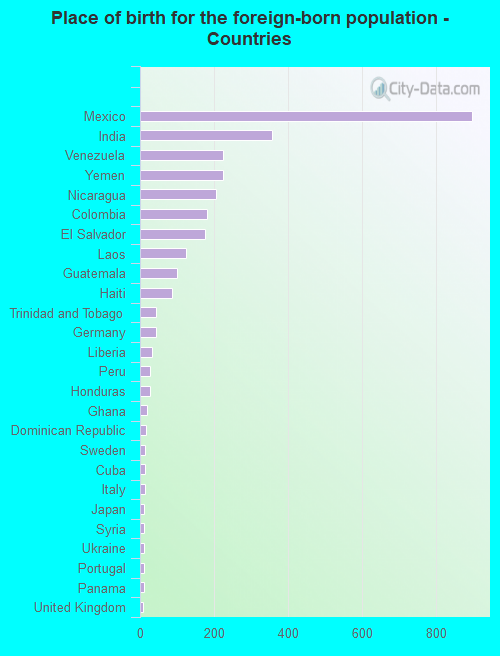
According to 2022 data, the most numerous races in Statesville, NC are White alone (14,880 residents), Black alone (7,572 residents), and Hispanic (4,781 residents). 82.3% of Statesville residents speak English at home. 9.9% of Statesville, NC residents are foreign-born (6.7% born in Latin America, 2.5% born in Asia), which is 18.9% greater than the foreign-born rate of 8.0% across the entire state of North Carolina.
Race distribution in Statesville
2000 2022
5,647,155 70.2% White alone 1,723,301 21.4% Black alone 378,963 4.7% Hispanic 112,416 1.4% Asian alone 95,333 1.2% American Indian alone 79,965 1.0% Two or more races 9,015 0.1% Other race alone 3,165 0.04% Native Hawaiian and Other
6,497,519 60.7% White alone 2,155,650 20.1% Black alone 1,114,799 10.4% Hispanic 438,061 4.1% Two or more races 341,052 3.2% Asian alone 91,758 0.9% American Indian alone 50,180 0.5% Other race alone 9,954 0.09% Native Hawaiian and Other
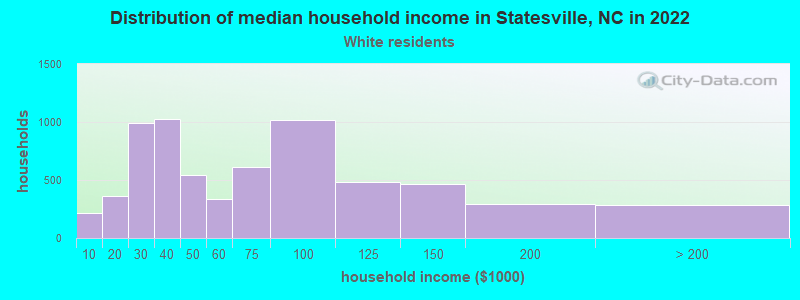
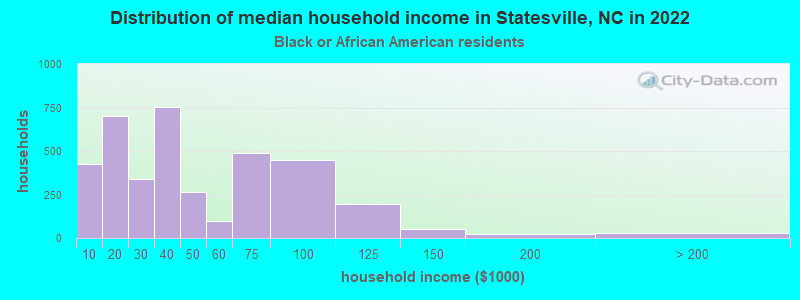
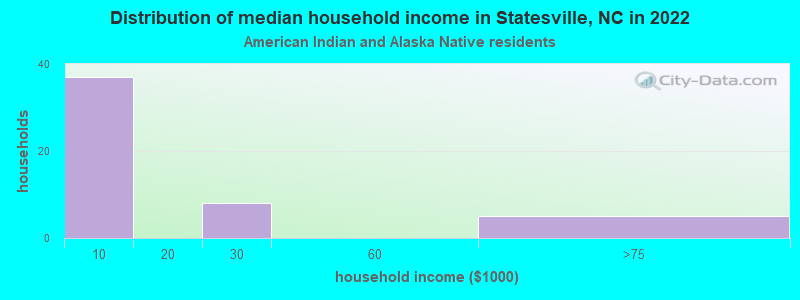
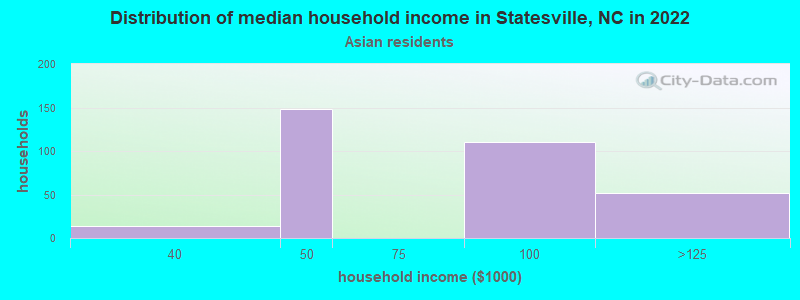
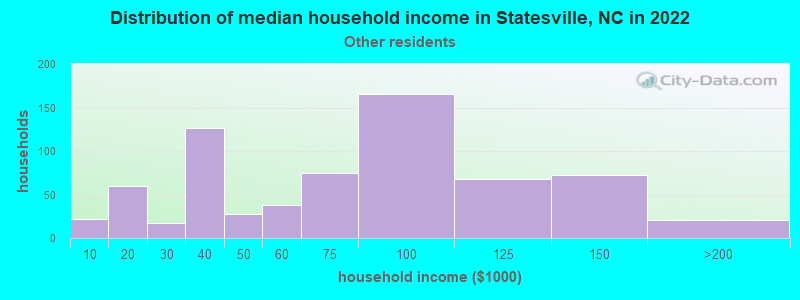
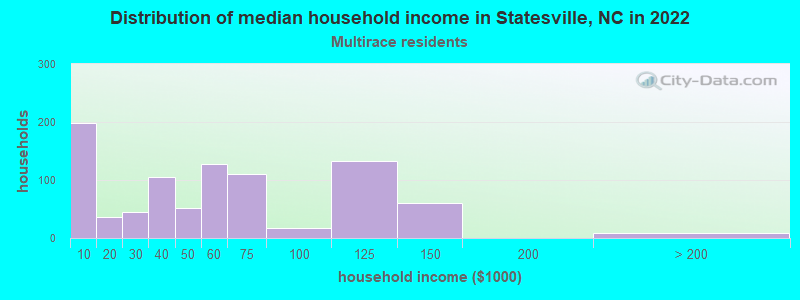
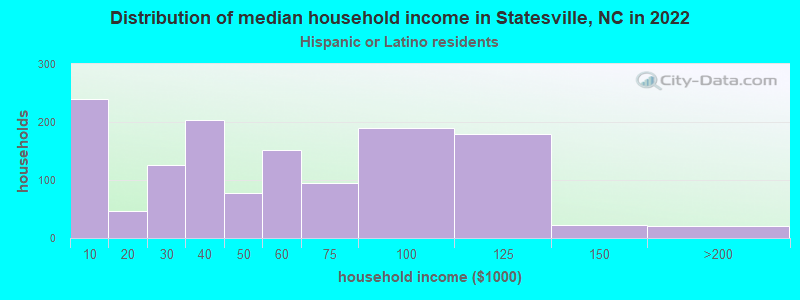
Income and house value in Statesville Median household income in 2022 $62,628 White non-Hispanic householders$31,951 Black householders$2,527 American Indian and Alaska Native householders$80,531 Asian householders$71,420 Some other race householders$44,470 Two or more races householders$52,024 Hispanic or Latino race householdersMedian 2022 house value $297,278 White Non-Hispanic householders$171,601 Black or African American householders $199,377 Asian householders$300,303 Some other race householders$233,752 Two or more races householders$225,502 Hispanic or Latino householders
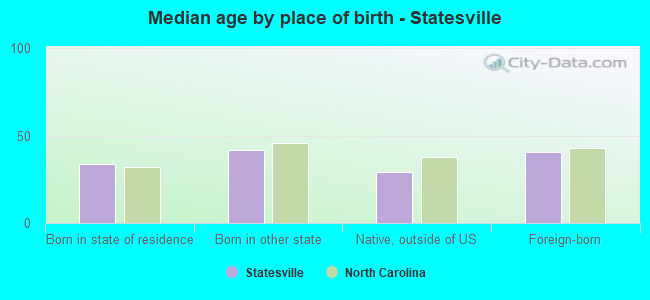
Median age by race in Statesville
43.2 Median age for White residents40.3 46.9 36.0 Median age for Black or African American residents29.1 42.8 36.8 Median age for American Indian / Alaska Native residents36.5 43.4 38.4 Median age for Asian residents36.3 59.9 -609,884,331.7 Median age for Native Hawaiian / Pacific Islander residents-666,666,666.0 -666,666,666.0 29.0 Median age for Other race residents33.7 20.3 35.2 Median age for Two or more races residents31.4 37.5 44.6 Median age for White alone residents42.5 48.2 29.6 Median age for Hispanic or Latino residents32.0 27.7
Owner/renter occupied households by race in Statesville
House owners and renters - White residents 4,256 66.0% Owner occupied2,196 34.0% Renter occupiedHouse owners and renters - Black or African American residents 1,275 35.6% Owner occupied2,304 64.4% Renter occupiedHouse owners and renters - American Indian / Alaska Native residents 47 90.0% Owner occupied5 10.0% Renter occupiedHouse owners and renters - Asian residents 149 51.8% Owner occupied139 48.2% Renter occupiedHouse owners and renters - Native Hawaiian / Pacific Islander residents 50 100.0% Renter occupiedHouse owners and renters - Other race residents 385 51.1% Owner occupied368 48.9% Renter occupiedHouse owners and renters - Two or more races residents 413 35.9% Owner occupied737 64.1% Renter occupiedHouse owners and renters - White alone residents 4,203 66.6% Owner occupied2,106 33.4% Renter occupiedHouse owners and renters - Hispanic or Latino residents 429 32.2% Owner occupied903 67.8% Renter occupied
Language usage in Statesville
English speakers - Total 82.3% of residents of Statesville speak English at home.
14.5% of residents speak Spanish at home 1,836 45.1% Speak English very well2,238 54.9% Speak English less than very well4.4% of residents speak other language at home 476 38.1% Speak English very well774 61.9% Speak English less than very well
English speakers - Born in the United States 90.5% of residents of Statesville speak English at home.
4.8% of residents speak Spanish at home 391 93.5% Speak English very well27 6.5% Speak English less than very well5.1% of residents speak other language at home 298 66.7% Speak English very well149 33.3% Speak English less than very well
English speakers - Native, born elsewhere 80.3% of residents of Statesville speak English at home.
23.3% of residents speak Spanish at home 51 49.5% Speak English very well52 50.5% Speak English less than very well
English speakers - Foreign-born 8.7% of residents of Statesville speak English at home.
86.0% of residents speak Spanish at home 439 16.9% Speak English very well2,162 83.1% Speak English less than very well21.0% of residents speak other language at home 178 28.0% Speak English very well457 72.0% Speak English less than very well
White (Caucasian) - Speak only English Native:
94.2% (13,474)Foreign-born:
7.3% (36)
White (Caucasian) - Speak another language Native:
6.1% (870)Foreign-born:
75.5% (366)
Black or African American - Speak only English Native:
94.6% (7,537)Foreign-born:
48.6% (93)
Black or African American - Speak another language Native:
5.1% (410)Foreign-born:
51.6% (99)
American Indian / Alaska Native - Speak another language Native:
56.2% (96)Foreign-born:
100.0% (77)
Asian - Speak another language Native:
100.0% (176)Foreign-born:
75.7% (326)
Other race - Speak only English Native:
56.1% (387)Foreign-born:
2.2% (30)
Other race - Speak another language Native:
48.5% (334)Foreign-born:
98.0% (1,356)
Two or more races - Speak another language Native:
21.9% (390)Foreign-born:
100.0% (1,147)
White alone - Speak only English Native:
97.3% (13,463)Foreign-born:
6.0% (21)
White alone - Speak another language Native:
2.9% (408)Foreign-born:
89.6% (310)
Hispanic or Latino - Speak only English Native:
29.2% (566)Foreign-born:
3.2% (78)
Hispanic or Latino - Speak another language Native:
68.8% (1,332)Foreign-born:
100.0% (2,458)
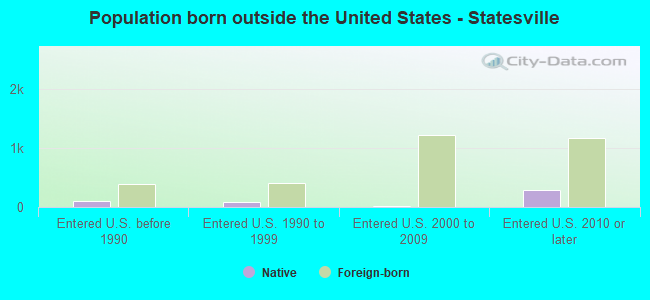
Foreign-born residents in Statesville 2,940 residents are foreign born (6.7% Latin America , 2.5% Asia ).
This city:
9.9%North Carolina:
8.3%
Marital status for residents in Statesville Marital status - White (Caucasian) population 15 years and over
Males 34.6% Never married50.3% Now married1.2% Separated3.7% Widowed10.2% DivorcedFemales 18.1% Never married48.8% Now married2.3% Separated12.8% Widowed18.0% DivorcedWomen who gave birth in the past 12 months Now married:
83.8% (283)Unmarried:
16.2% (55)
Women who did not give birth in the past 12 months Now married:
47.4% (1,352)Unmarried:
52.6% (1,501)
Marital status - Black or African American population 15 years and over
Males 55.0% Never married31.3% Now married1.3% Separated4.4% Widowed8.0% DivorcedFemales 48.8% Never married19.8% Now married7.7% Separated10.9% Widowed12.7% DivorcedWomen who gave birth in the past 12 months Now married:
0.0% (0)Unmarried:
100.0% (22)
Women who did not give birth in the past 12 months Now married:
25.6% (531)Unmarried:
74.4% (1,542)
Marital status - American Indian / Alaska Native population 15 years and over
Males 34.6% Never married44.9% Now married0.0% Separated0.0% Widowed20.5% DivorcedFemales 47.0% Never married0.0% Now married0.0% Separated0.0% Widowed53.0% DivorcedWomen who did not give birth in the past 12 months Now married:
0.0% (0)Unmarried:
100.0% (33)
Marital status - Asian population 15 years and over
Males 82.2% Never married15.7% Now married0.0% Separated0.0% Widowed2.1% DivorcedFemales 1.1% Never married92.6% Now married0.0% Separated6.4% Widowed0.0% DivorcedWomen who did not give birth in the past 12 months Now married:
100.0% (181)Unmarried:
0.0% (0)
Marital status - Other race population 15 years and over
Males 41.3% Never married54.4% Now married0.0% Separated0.0% Widowed4.3% DivorcedFemales 38.0% Never married55.9% Now married1.2% Separated0.0% Widowed4.8% DivorcedWomen who gave birth in the past 12 months Now married:
49.4% (60)Unmarried:
50.6% (62)
Women who did not give birth in the past 12 months Now married:
56.7% (219)Unmarried:
43.3% (167)
Marital status - Two or more races population 15 years and over
Males 47.4% Never married49.1% Now married0.5% Separated0.9% Widowed2.1% DivorcedFemales 31.5% Never married28.9% Now married18.6% Separated9.5% Widowed11.5% DivorcedWomen who gave birth in the past 12 months Now married:
69.6% (22)Unmarried:
30.4% (10)
Women who did not give birth in the past 12 months Now married:
44.6% (322)Unmarried:
55.4% (400)
Marital status - White alone, not Hispanic / Latino population 15 years and over
Males 33.8% Never married50.3% Now married1.3% Separated3.9% Widowed10.7% DivorcedFemales 18.2% Never married47.8% Now married2.2% Separated13.3% Widowed18.6% DivorcedWomen who gave birth in the past 12 months Now married:
83.0% (275)Unmarried:
17.0% (56)
Women who did not give birth in the past 12 months Now married:
44.7% (1,203)Unmarried:
55.3% (1,490)
Marital status - Hispanic or Latino population 15 years and over
Males 45.3% Never married51.6% Now married0.0% Separated0.0% Widowed3.1% DivorcedFemales 32.7% Never married46.9% Now married13.0% Separated3.2% Widowed4.2% DivorcedWomen who gave birth in the past 12 months Now married:
40.8% (33)Unmarried:
59.2% (47)
Women who did not give birth in the past 12 months Now married:
59.4% (634)Unmarried:
40.6% (434)
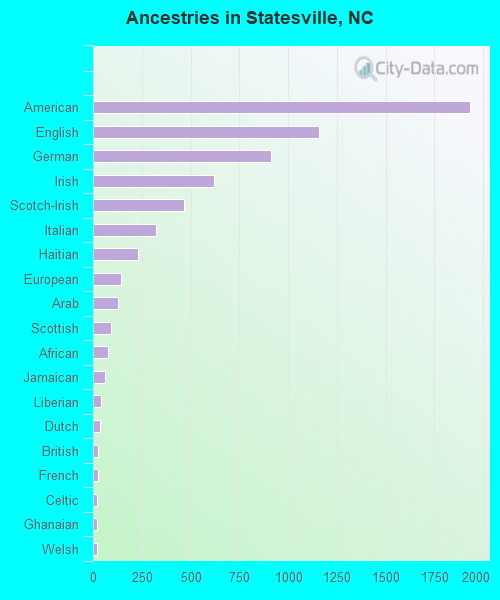
Ancestries in Statesville
1,933 11.2% American1,156 6.7% English911 5.3% German620 3.6% Irish467 2.7% Scotch-Irish324 1.9% Italian232 1.3% Haitian146 0.8% European126 0.7% Arab91 0.5% Scottish76 0.4% African61 0.4% Jamaican40 0.2% Liberian38 0.2% Dutch25 0.1% British24 0.1% French20 0.1% Celtic20 0.1% Ghanaian19 0.1% Welsh17 0.10% Polish15 0.09% Swedish14 0.08% Trinidadian and Tobagonian13 0.08% Scandinavian12 0.07% Slovak11 0.06% Moroccan11 0.06% Czechoslovakian11 0.06% Ukrainian10 0.06% Eastern European9 0.05% Portuguese7 0.04% Austrian5 0.03% Norwegian5 0.03% Russian4 0.02% Lebanese4 0.02% Iranian3 0.02% French Canadian
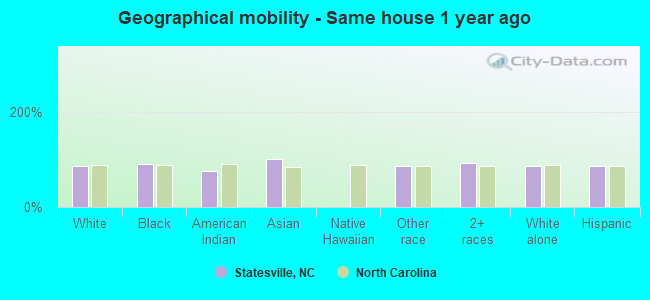
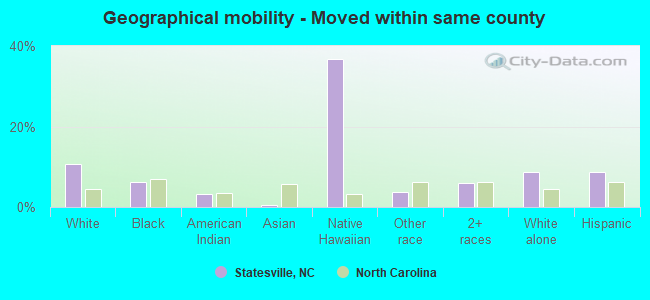
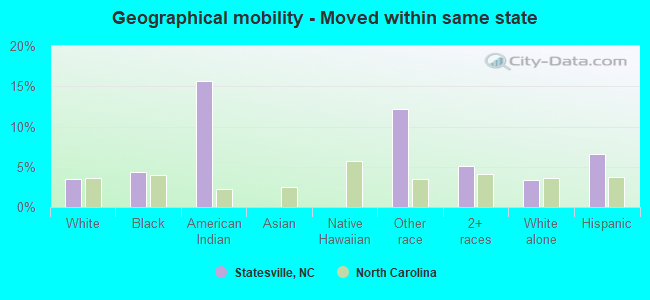
Geographical mobility in Statesville Same house 1 year ago 12,964 84.7% White (Caucasian)7,094 89.6% Black or African American175 75.3% American Indian / Alaska Native659 100.0% Asian1,695 85.2% Other race2,703 92.4% Two or more races12,550 85.8% White alone, not Hispanic / Latino3,759 84.7% Hispanic or LatinoMoved within same county 1,625 10.6% White / Caucasian497 6.3% Black or African American8 3.3% American Indian / Alaska Native4 0.6% Asian51 36.9% Native Hawaiian / Pacific Islander74 3.7% Other race176 6.0% Two or more races1,272 8.7% White alone, not Hispanic / Latino382 8.6% Hispanic or LatinoMoved within same state 538 3.5% White / Caucasian340 4.3% Black or African American36 15.7% American Indian / Alaska Native242 12.1% Other race147 5.0% Two or more races497 3.4% White alone, not Hispanic / Latino293 6.6% Hispanic or LatinoMoved from different state 296 1.9% White / Caucasian71 0.9% Black or African American79 2.7% Two or more races295 2.0% White alone, not Hispanic / Latino
Children Nativity (place of birth) in Statesville
Children under 6 years - Living with two parents Both parents native 894 100.0% NativeBoth parents foreign-born 276 61.3% Native175 38.7% Foreign-bornOne native, one foreign-born parent 108 100.0% NativeChildren under 6 years - Living with one parent Native parent 383 100.0% NativeForeign-born parent 326 100.0% NativeChildren 6 to 17 years - Living with two parents Both parents native 1,584 96.9% Native50 3.1% Foreign-bornBoth parents foreign-born 682 90.3% Native73 9.7% Foreign-bornOne native, one foreign-born parent 73 100.0% NativeChildren 6 to 17 years - Living with one parent Native parent 1,625 100.0% NativeForeign-born parent 133 47.8% Native145 52.2% Foreign-born
Grandparents responsible for own grandchildren in Statesville
Grandparents (30 to 59 years) White / Caucasian 7 17.0% Responsible for grandchildren33 83.0% Not responsible for grandchildrenBlack or African American 37 38.5% Responsible for grandchildren59 61.5% Not responsible for grandchildrenTwo or more races 28 100.0% Not responsible for grandchildrenWhite alone, not Hispanic / Latino 7 32.6% Responsible for grandchildren14 67.4% Not responsible for grandchildrenHispanic or Latino 60 100.0% Not responsible for grandchildrenGrandparents (60 years and over) White / Caucasian 8 9.3% Responsible for grandchildren80 90.7% Not responsible for grandchildrenBlack or African American 80 52.6% Responsible for grandchildren72 47.4% Not responsible for grandchildrenTwo or more races 21 100.0% Not responsible for grandchildrenWhite alone, not Hispanic / Latino 8 9.7% Responsible for grandchildren78 90.3% Not responsible for grandchildren