Races in Steger, Illinois (IL) Detailed Stats
Data:
Races - White alone (%)
Races - White alone (% change since 2000)
Races - Black alone (%)
Races - Black alone (% change since 2000)
Races - American Indian alone (%)
Races - American Indian alone (% change since 2000)
Races - Asian alone (%)
Races - Asian alone (% change since 2000)
Races - Hispanic (%)
Races - Hispanic (% change since 2000)
Races - Native Hawaiian and Other Pacific Islander alone (%)
Races - Native Hawaiian and Other Pacific Islander alone (% change since 2000)
Races - Two or more races(%)
Races - Two or more races(% change since 2000)
Races - Other race alone (%)
Races - Other race alone (% change since 2000)
Racial diversity
Place of birth - Born in state of residence (%)
Place of birth - Born in state of residence (%) - White
Place of birth - Born in state of residence (%) - Black or African American
Place of birth - Born in state of residence (%) - Asian
Place of birth - Born in state of residence (%) - Hispanic or Latino
Place of birth - Born in state of residence (%) - American Indian and Alaska Native
Place of birth - Born in state of residence (%) - Multirace
Place of birth - Born in state of residence (%) - Other Race
Place of birth - Born in other state (%)
Place of birth - Born in other state (%) - White
Place of birth - Born in other state (%) - Black or African American
Place of birth - Born in other state (%) - Asian
Place of birth - Born in other state (%) - Hispanic or Latino
Place of birth - Born in other state (%) - American Indian and Alaska Native
Place of birth - Born in other state (%) - Multirace
Place of birth - Born in other state (%) - Other Race
Place of birth - Native, outside of US (%)
Place of birth - Native, outside of US (%) - White
Place of birth - Native, outside of US (%) - Black or African American
Place of birth - Native, outside of US (%) - Asian
Place of birth - Native, outside of US (%) - Hispanic or Latino
Place of birth - Native, outside of US (%) - American Indian and Alaska Native
Place of birth - Native, outside of US (%) - Multirace
Place of birth - Native, outside of US (%) - Other Race
Place of birth - Foreign born (%)
Place of birth - Foreign born (%) - White
Place of birth - Foreign born (%) - Black or African American
Place of birth - Foreign born (%) - Asian
Place of birth - Foreign born (%) - Hispanic or Latino
Place of birth - Foreign born (%) - American Indian and Alaska Native
Place of birth - Foreign born (%) - Multirace
Place of birth - Foreign born (%) - Other Race
Residents speaking English at home (%)
Residents speaking English at home - Born in the United States (%)
Residents speaking English at home - Native, born elsewhere (%)
Residents speaking English at home - Foreign born (%)
Residents speaking Spanish at home (%)
Residents speaking Spanish at home - Born in the United States (%)
Residents speaking Spanish at home - Native, born elsewhere (%)
Residents speaking Spanish at home - Foreign born (%)
Residents speaking other language at home (%)
Residents speaking other language at home - Born in the United States (%)
Residents speaking other language at home - Native, born elsewhere (%)
Residents speaking other language at home - Foreign born (%)
Marital status - Never married (%)
Marital status - Now married (%)
Marital status - Separated (%)
Marital status - Widowed (%)
Marital status - Divorced (%)
Ancestries Reported - Arab (%)
Ancestries Reported - Czech (%)
Ancestries Reported - Danish (%)
Ancestries Reported - Dutch (%)
Ancestries Reported - English (%)
Ancestries Reported - French (%)
Ancestries Reported - French Canadian (%)
Ancestries Reported - German (%)
Ancestries Reported - Greek (%)
Ancestries Reported - Hungarian (%)
Ancestries Reported - Irish (%)
Ancestries Reported - Italian (%)
Ancestries Reported - Lithuanian (%)
Ancestries Reported - Norwegian (%)
Ancestries Reported - Polish (%)
Ancestries Reported - Portuguese (%)
Ancestries Reported - Russian (%)
Ancestries Reported - Scotch-Irish (%)
Ancestries Reported - Scottish (%)
Ancestries Reported - Slovak (%)
Ancestries Reported - Subsaharan African (%)
Ancestries Reported - Swedish (%)
Ancestries Reported - Swiss (%)
Ancestries Reported - Ukrainian (%)
Ancestries Reported - United States (%)
Ancestries Reported - Welsh (%)
Ancestries Reported - West Indian (%)
Ancestries Reported - Other (%)
Geographical mobility - Same house 1 year ago (%)
Geographical mobility - Same house 1 year ago (%) - White
Geographical mobility - Same house 1 year ago (%) - Black or African American
Geographical mobility - Same house 1 year ago (%) - Asian
Geographical mobility - Same house 1 year ago (%) - Hispanic or Latino
Geographical mobility - Same house 1 year ago (%) - American Indian and Alaska Native
Geographical mobility - Same house 1 year ago (%) - Multirace
Geographical mobility - Same house 1 year ago (%) - Other Race
Geographical mobility - Moved within same county (%)
Geographical mobility - Moved within same county (%) - White
Geographical mobility - Moved within same county (%) - Black or African American
Geographical mobility - Moved within same county (%) - Asian
Geographical mobility - Moved within same county (%) - Hispanic or Latino
Geographical mobility - Moved within same county (%) - American Indian and Alaska Native
Geographical mobility - Moved within same county (%) - Multirace
Geographical mobility - Moved within same county (%) - Other Race
Geographical mobility - Moved from different county within same state (%)
Geographical mobility - Moved from different county within same state (%) - White
Geographical mobility - Moved from different county within same state (%) - Black or African American
Geographical mobility - Moved from different county within same state (%) - Asian
Geographical mobility - Moved from different county within same state (%) - Hispanic or Latino
Geographical mobility - Moved from different county within same state (%) - American Indian and Alaska Native
Geographical mobility - Moved from different county within same state (%) - Multirace
Geographical mobility - Moved from different county within same state (%) - Other Race
Geographical mobility - Moved from different state (%)
Geographical mobility - Moved from different state (%) - White
Geographical mobility - Moved from different state (%) - Black or African American
Geographical mobility - Moved from different state (%) - Asian
Geographical mobility - Moved from different state (%) - Hispanic or Latino
Geographical mobility - Moved from different state (%) - American Indian and Alaska Native
Geographical mobility - Moved from different state (%) - Multirace
Geographical mobility - Moved from different state (%) - Other Race
Geographical mobility - Moved from abroad (%)
Geographical mobility - Moved from abroad (%) - White
Geographical mobility - Moved from abroad (%) - Black or African American
Geographical mobility - Moved from abroad (%) - Asian
Geographical mobility - Moved from abroad (%) - Hispanic or Latino
Geographical mobility - Moved from abroad (%) - American Indian and Alaska Native
Geographical mobility - Moved from abroad (%) - Multirace
Geographical mobility - Moved from abroad (%) - Other Race
Place of birth for the foreign-born population - Ireland (%)
Place of birth for the foreign-born population - Denmark (%)
Place of birth for the foreign-born population - Norway (%)
Place of birth for the foreign-born population - Sweden (%)
Place of birth for the foreign-born population - United Kingdom (%)
Place of birth for the foreign-born population - England (%)
Place of birth for the foreign-born population - Scotland (%)
Place of birth for the foreign-born population - Other Northern Europe (%)
Place of birth for the foreign-born population - Austria (%)
Place of birth for the foreign-born population - Belgium (%)
Place of birth for the foreign-born population - France (%)
Place of birth for the foreign-born population - Germany (%)
Place of birth for the foreign-born population - Netherlands (%)
Place of birth for the foreign-born population - Switzerland (%)
Place of birth for the foreign-born population - Other Western Europe (%)
Place of birth for the foreign-born population - Greece (%)
Place of birth for the foreign-born population - Italy (%)
Place of birth for the foreign-born population - Portugal (%)
Place of birth for the foreign-born population - Spain (%)
Place of birth for the foreign-born population - Other Southern Europe (%)
Place of birth for the foreign-born population - Albania (%)
Place of birth for the foreign-born population - Belarus (%)
Place of birth for the foreign-born population - Bosnia and Herzegovina (%)
Place of birth for the foreign-born population - Bulgaria (%)
Place of birth for the foreign-born population - Croatia (%)
Place of birth for the foreign-born population - Czechoslovakia (%)
Place of birth for the foreign-born population - Hungary (%)
Place of birth for the foreign-born population - Latvia (%)
Place of birth for the foreign-born population - Lithuania (%)
Place of birth for the foreign-born population - North Macedonia (Macedonia) (%)
Place of birth for the foreign-born population - Moldova (%)
Place of birth for the foreign-born population - Poland (%)
Place of birth for the foreign-born population - Romania (%)
Place of birth for the foreign-born population - Russia (%)
Place of birth for the foreign-born population - Serbia (%)
Place of birth for the foreign-born population - Ukraine (%)
Place of birth for the foreign-born population - Other Eastern Europe (%)
Place of birth for the foreign-born population - China (%)
Place of birth for the foreign-born population - Hong Kong (%)
Place of birth for the foreign-born population - Taiwan (%)
Place of birth for the foreign-born population - Japan (%)
Place of birth for the foreign-born population - Korea (%)
Place of birth for the foreign-born population - Other Eastern Asia (%)
Place of birth for the foreign-born population - Afghanistan (%)
Place of birth for the foreign-born population - Bangladesh (%)
Place of birth for the foreign-born population - India (%)
Place of birth for the foreign-born population - Iran (%)
Place of birth for the foreign-born population - Kazakhstan (%)
Place of birth for the foreign-born population - Nepal (%)
Place of birth for the foreign-born population - Pakistan (%)
Place of birth for the foreign-born population - Sri Lanka (%)
Place of birth for the foreign-born population - Uzbekistan (%)
Place of birth for the foreign-born population - Other South Central Asia (%)
Place of birth for the foreign-born population - Burma (%)
Place of birth for the foreign-born population - Cambodia (%)
Place of birth for the foreign-born population - Indonesia (%)
Place of birth for the foreign-born population - Laos (%)
Place of birth for the foreign-born population - Malaysia (%)
Place of birth for the foreign-born population - Philippines (%)
Place of birth for the foreign-born population - Singapore (%)
Place of birth for the foreign-born population - Thailand (%)
Place of birth for the foreign-born population - Vietnam (%)
Place of birth for the foreign-born population - Other South Eastern Asia (%)
Place of birth for the foreign-born population - Armenia (%)
Place of birth for the foreign-born population - Iraq (%)
Place of birth for the foreign-born population - Israel (%)
Place of birth for the foreign-born population - Jordan (%)
Place of birth for the foreign-born population - Kuwait (%)
Place of birth for the foreign-born population - Lebanon (%)
Place of birth for the foreign-born population - Saudi Arabia (%)
Place of birth for the foreign-born population - Syria (%)
Place of birth for the foreign-born population - Turkey (%)
Place of birth for the foreign-born population - Yemen (%)
Place of birth for the foreign-born population - Other Western Asia (%)
Place of birth for the foreign-born population - Eritrea (%)
Place of birth for the foreign-born population - Ethiopia (%)
Place of birth for the foreign-born population - Kenya (%)
Place of birth for the foreign-born population - Somalia (%)
Place of birth for the foreign-born population - Uganda (%)
Place of birth for the foreign-born population - Zimbabwe (%)
Place of birth for the foreign-born population - Other Eastern Africa (%)
Place of birth for the foreign-born population - Cameroon (%)
Place of birth for the foreign-born population - Congo (%)
Place of birth for the foreign-born population - Democratic Republic of Congo (Zaire) (%)
Place of birth for the foreign-born population - Other Middle Africa (%)
Place of birth for the foreign-born population - Egypt (%)
Place of birth for the foreign-born population - Morocco (%)
Place of birth for the foreign-born population - Sudan (%)
Place of birth for the foreign-born population - Other Northern Africa (%)
Place of birth for the foreign-born population - South Africa (%)
Place of birth for the foreign-born population - Other Southern Africa (%)
Place of birth for the foreign-born population - Cabo Verde (%)
Place of birth for the foreign-born population - Ghana (%)
Place of birth for the foreign-born population - Liberia (%)
Place of birth for the foreign-born population - Nigeria (%)
Place of birth for the foreign-born population - Senegal (%)
Place of birth for the foreign-born population - Sierra Leone (%)
Place of birth for the foreign-born population - Other Western Africa (%)
Place of birth for the foreign-born population - Australia (%)
Place of birth for the foreign-born population - New Zealand (%)
Place of birth for the foreign-born population - Fiji (%)
Place of birth for the foreign-born population - Micronesia (%)
Place of birth for the foreign-born population - Bahamas (%)
Place of birth for the foreign-born population - Barbados (%)
Place of birth for the foreign-born population - Cuba (%)
Place of birth for the foreign-born population - Dominica (%)
Place of birth for the foreign-born population - Dominican Republic (%)
Place of birth for the foreign-born population - Grenada (%)
Place of birth for the foreign-born population - Haiti (%)
Place of birth for the foreign-born population - Jamaica (%)
Place of birth for the foreign-born population - St. Vincent and the Grenadines (%)
Place of birth for the foreign-born population - Trinidad and Tobago (%)
Place of birth for the foreign-born population - West Indies (%)
Place of birth for the foreign-born population - Other Caribbean (%)
Place of birth for the foreign-born population - Belize (%)
Place of birth for the foreign-born population - Costa Rica (%)
Place of birth for the foreign-born population - El Salvador (%)
Place of birth for the foreign-born population - Guatemala (%)
Place of birth for the foreign-born population - Honduras (%)
Place of birth for the foreign-born population - Mexico (%)
Place of birth for the foreign-born population - Nicaragua (%)
Place of birth for the foreign-born population - Panama (%)
Place of birth for the foreign-born population - Other Central America (%)
Place of birth for the foreign-born population - Argentina (%)
Place of birth for the foreign-born population - Bolivia (%)
Place of birth for the foreign-born population - Brazil (%)
Place of birth for the foreign-born population - Chile (%)
Place of birth for the foreign-born population - Colombia (%)
Place of birth for the foreign-born population - Ecuador (%)
Place of birth for the foreign-born population - Guyana (%)
Place of birth for the foreign-born population - Peru (%)
Place of birth for the foreign-born population - Uruguay (%)
Place of birth for the foreign-born population - Venezuela (%)
Place of birth for the foreign-born population - Other South America (%)
Place of birth for the foreign-born population - Canada (%)
Place of birth for the foreign-born population - Other Northern America (%)
Place of birth for the foreign-born population - Other (%)
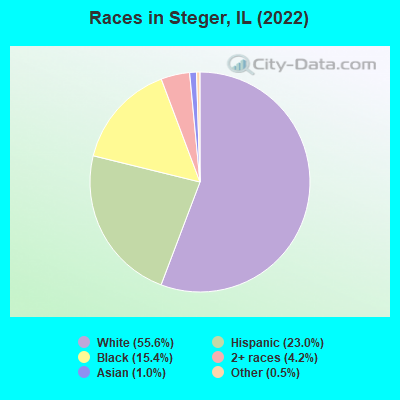
According to 2022 data, the most numerous races in Steger, IL are White alone (5,171 residents), Hispanic (2,141 residents), and Black alone (1,431 residents). 85.5% of Steger residents speak English at home. 5.5% of Steger, IL residents are foreign-born (3.5% born in Latin America, 1.4% born in Europe), which is 156.5% less than the foreign-born rate of 14.0% across the entire state of Illinois.
Race distribution in Steger
2000 2022
8,424,140 67.8% White alone 1,856,152 14.9% Black alone 1,530,262 12.3% Hispanic 419,916 3.4% Asian alone 153,996 1.2% Two or more races 13,479 0.1% Other race alone 18,232 0.1% American Indian alone 3,116 0.03% Native Hawaiian and Other
7,356,301 58.5% White alone 2,299,726 18.3% Hispanic 1,660,423 13.2% Black alone 747,296 5.9% Asian alone 458,599 3.6% Two or more races 45,386 0.4% Other race alone 10,405 0.08% American Indian alone 3,896 0.03% Native Hawaiian and Other
Income and house value in Steger Median household income in 2022 $60,934 White non-Hispanic householders$41,767 Black householders$57,545 Some other race householders$76,848 Two or more races householders$52,718 Hispanic or Latino race householdersMedian 2022 house value $123,820 White Non-Hispanic householders$216,781 Black or African American householders$207,217 Native Hawaiian and other Pacific Islander householders$119,995 Some other race householders$109,666 Two or more races householders$136,955 Hispanic or Latino householders
Median age by race in Steger
44.5 Median age for White residents43.1 45.8 35.8 Median age for Black or African American residents35.9 40.9 -680,473,372.1 Median age for American Indian / Alaska Native residents-736,736,736.0 -641,399,416.3 53.9 Median age for Asian residents-688,465,031.1 -683,893,194.8 -687,999,999.3 Median age for Native Hawaiian / Pacific Islander residents-918,721,460.3 -610,229,276.3 27.3 Median age for Other race residents27.2 27.6 19.7 Median age for Two or more races residents25.3 13.7 45.8 Median age for White alone residents44.8 47.3 24.5 Median age for Hispanic or Latino residents27.4 22.8
Owner/renter occupied households by race in Steger
House owners and renters - White residents 1,780 69.2% Owner occupied794 30.8% Renter occupiedHouse owners and renters - Black or African American residents 221 24.2% Owner occupied693 75.8% Renter occupiedHouse owners and renters - Asian residents 19 100.0% Owner occupiedHouse owners and renters - Other race residents 233 75.8% Owner occupied74 24.2% Renter occupiedHouse owners and renters - Two or more races residents 130 78.1% Owner occupied37 21.9% Renter occupiedHouse owners and renters - White alone residents 1,754 70.6% Owner occupied732 29.4% Renter occupiedHouse owners and renters - Hispanic or Latino residents 357 55.7% Owner occupied284 44.3% Renter occupied
Language usage in Steger
English speakers - Total 85.5% of residents of Steger speak English at home.
10.9% of residents speak Spanish at home 801 83.8% Speak English very well155 16.2% Speak English less than very well2.8% of residents speak other language at home 162 65.3% Speak English very well86 34.7% Speak English less than very well
English speakers - Born in the United States 85.6% of residents of Steger speak English at home.
7.8% of residents speak Spanish at home 91 91.0% Speak English very well9 9.0% Speak English less than very well6.6% of residents speak other language at home 84 100.0% Speak English very well
English speakers - Native, born elsewhere 77.2% of residents of Steger speak English at home.
24.9% of residents speak Spanish at home 47 100.0% Speak English very well
English speakers - Foreign-born 24.4% of residents of Steger speak English at home.
52.6% of residents speak Spanish at home 164 61.4% Speak English very well103 38.6% Speak English less than very well21.7% of residents speak other language at home 23 20.9% Speak English very well87 79.1% Speak English less than very well
White (Caucasian) - Speak only English Native:
98.7% (4,872)Foreign-born:
16.0% (33)
White (Caucasian) - Speak another language Native:
4.2% (207)Foreign-born:
84.2% (174)
Black or African American - Speak another language Native:
2.3% (33)Foreign-born:
91.2% (3)
Asian - Speak only English Native:
100.0% (46)Foreign-born:
81.4% (40)
Other race - Speak only English Native:
47.4% (437)Foreign-born:
19.4% (40)
Other race - Speak another language Native:
54.6% (504)Foreign-born:
78.8% (161)
Two or more races - Speak only English Native:
87.3% (657)Foreign-born:
100.0% (14)
White alone - Speak only English Native:
96.1% (4,562)Foreign-born:
17.0% (21)
White alone - Speak another language Native:
3.5% (165)Foreign-born:
82.8% (104)
Hispanic or Latino - Speak only English Native:
63.7% (1,062)Foreign-born:
17.6% (59)
Hispanic or Latino - Speak another language Native:
38.3% (639)Foreign-born:
80.8% (269)
Foreign-born residents in Steger 508 residents are foreign born (3.5% Latin America , 1.4% Europe ).
This city:
5.5%Illinois:
14.1%
Marital status for residents in Steger Marital status - White (Caucasian) population 15 years and over
Males 39.4% Never married47.9% Now married1.5% Separated4.7% Widowed6.6% DivorcedFemales 30.4% Never married44.9% Now married1.4% Separated11.0% Widowed12.3% DivorcedWomen who gave birth in the past 12 months Now married:
63.0% (92)Unmarried:
37.0% (54)
Women who did not give birth in the past 12 months Now married:
47.7% (433)Unmarried:
52.3% (475)
Marital status - Black or African American population 15 years and over
Males 52.4% Never married31.0% Now married4.4% Separated4.8% Widowed7.3% DivorcedFemales 50.3% Never married25.6% Now married6.7% Separated2.6% Widowed14.9% DivorcedWomen who gave birth in the past 12 months Now married:
100.0% (19)Unmarried:
0.0% (0)
Women who did not give birth in the past 12 months Now married:
19.0% (86)Unmarried:
81.0% (366)
Marital status - Asian population 15 years and over
Males 0.0% Never married72.1% Now married0.0% Separated0.0% Widowed27.9% DivorcedFemales 0.0% Never married12.5% Now married87.5% Separated0.0% Widowed0.0% DivorcedWomen who did not give birth in the past 12 months Now married:
100.0% (28)Unmarried:
0.0% (0)
Marital status - Other race population 15 years and over
Males 59.0% Never married37.8% Now married0.0% Separated1.4% Widowed1.7% DivorcedFemales 30.7% Never married66.1% Now married0.0% Separated0.0% Widowed3.3% DivorcedWomen who gave birth in the past 12 months Now married:
0.0% (0)Unmarried:
100.0% (25)
Women who did not give birth in the past 12 months Now married:
28.3% (36)Unmarried:
71.7% (91)
Marital status - Two or more races population 15 years and over
Males 61.0% Never married24.7% Now married0.0% Separated0.0% Widowed14.3% DivorcedFemales 32.1% Never married54.2% Now married0.0% Separated0.0% Widowed13.7% DivorcedWomen who did not give birth in the past 12 months Now married:
57.5% (143)Unmarried:
42.5% (105)
Marital status - White alone, not Hispanic / Latino population 15 years and over
Males 38.3% Never married48.4% Now married1.6% Separated4.5% Widowed7.2% DivorcedFemales 26.5% Never married47.5% Now married1.2% Separated11.7% Widowed13.0% DivorcedWomen who gave birth in the past 12 months Now married:
100.0% (104)Unmarried:
0.0% (0)
Women who did not give birth in the past 12 months Now married:
49.8% (429)Unmarried:
50.2% (432)
Marital status - Hispanic or Latino population 15 years and over
Males 58.0% Never married38.3% Now married0.0% Separated2.7% Widowed1.0% DivorcedFemales 48.6% Never married43.9% Now married1.2% Separated2.3% Widowed4.0% DivorcedWomen who gave birth in the past 12 months Now married:
0.0% (0)Unmarried:
100.0% (86)
Women who did not give birth in the past 12 months Now married:
31.8% (134)Unmarried:
68.2% (287)
Ancestries in Steger
504 10.2% Italian499 10.1% Irish392 7.9% German315 6.4% Polish237 4.8% American228 4.6% English165 3.3% African91 1.8% European31 0.6% Dutch30 0.6% Lithuanian27 0.5% Swedish10 0.2% French Canadian9 0.2% Scottish8 0.2% Eastern European7 0.1% Czech4 0.08% Scotch-Irish3 0.06% Croatian
Children Nativity (place of birth) in Steger
Children under 6 years - Living with two parents Both parents native 351 100.0% NativeChildren under 6 years - Living with one parent Native parent 266 100.0% Native
Children 6 to 17 years - Living with two parents Both parents native 581 100.0% NativeBoth parents foreign-born 115 100.0% NativeChildren 6 to 17 years - Living with one parent Native parent 669 100.0% Native
Grandparents responsible for own grandchildren in Steger
Grandparents (30 to 59 years) White / Caucasian 22 55.5% Responsible for grandchildren18 44.5% Not responsible for grandchildrenOther race 79 100.0% Not responsible for grandchildrenTwo or more races 28 100.0% Responsible for grandchildrenWhite alone, not Hispanic / Latino 29 65.9% Responsible for grandchildren15 34.1% Not responsible for grandchildrenHispanic or Latino 65 100.0% Not responsible for grandchildren
Grandparents (60 years and over) White / Caucasian 93 100.0% Not responsible for grandchildrenOther race 8 100.0% Not responsible for grandchildrenWhite alone, not Hispanic / Latino 110 100.0% Not responsible for grandchildrenHispanic or Latino 15 100.0% Not responsible for grandchildren