Races in Sterling, Virginia (VA) Detailed Stats
Data:
Races - White alone (%)
Races - White alone (% change since 2000)
Races - Black alone (%)
Races - Black alone (% change since 2000)
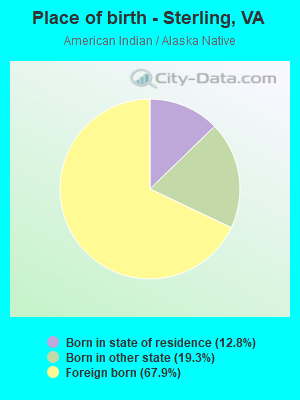
Races - American Indian alone (%)
Races - American Indian alone (% change since 2000)
Races - Asian alone (%)
Races - Asian alone (% change since 2000)
Races - Hispanic (%)
Races - Hispanic (% change since 2000)
Races - Native Hawaiian and Other Pacific Islander alone (%)
Races - Native Hawaiian and Other Pacific Islander alone (% change since 2000)
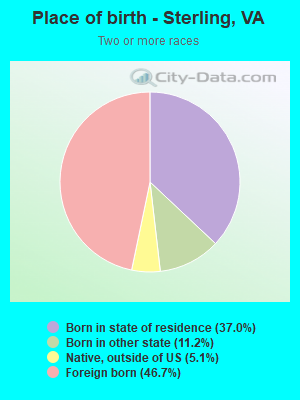
Races - Two or more races(%)
Races - Two or more races(% change since 2000)
Races - Other race alone (%)
Races - Other race alone (% change since 2000)
Racial diversity
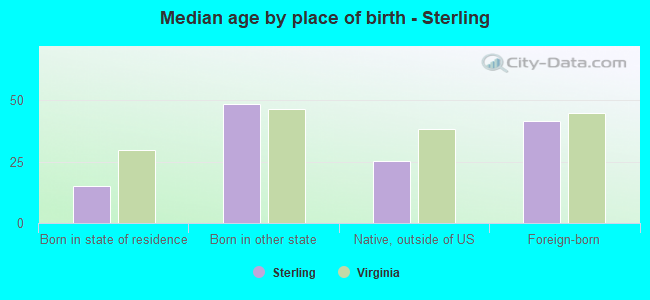
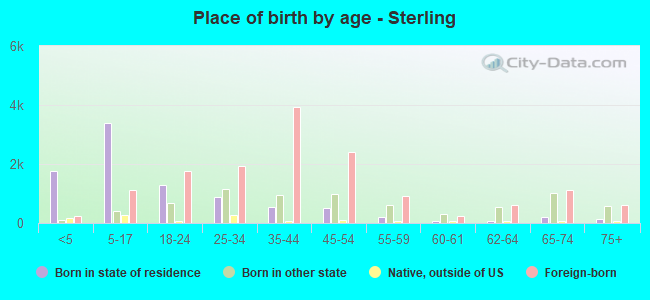
Place of birth - Born in state of residence (%)
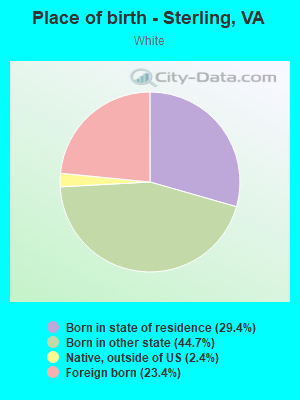
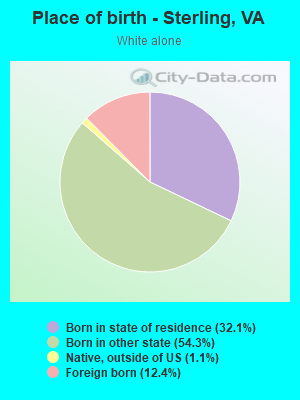
Place of birth - Born in state of residence (%) - White
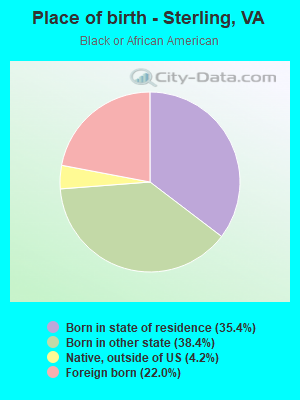
Place of birth - Born in state of residence (%) - Black or African American
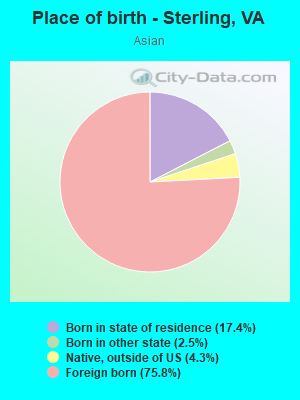
Place of birth - Born in state of residence (%) - Asian
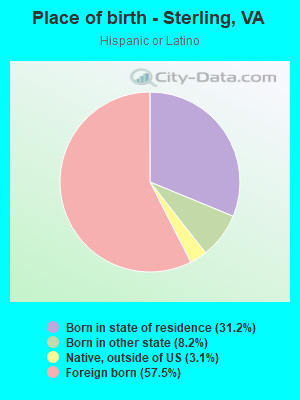
Place of birth - Born in state of residence (%) - Hispanic or Latino
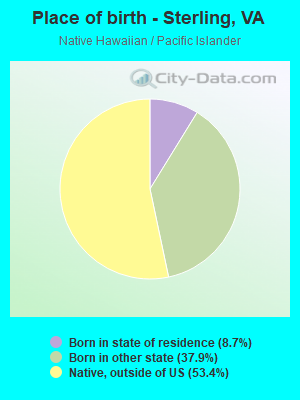
Place of birth - Born in state of residence (%) - American Indian and Alaska Native
Place of birth - Born in state of residence (%) - Multirace
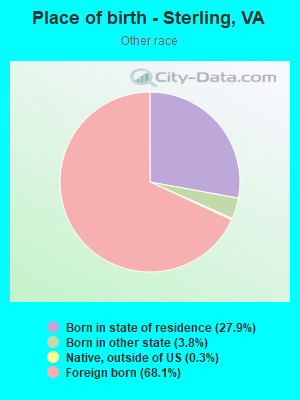
Place of birth - Born in state of residence (%) - Other Race
Place of birth - Born in other state (%)
Place of birth - Born in other state (%) - White
Place of birth - Born in other state (%) - Black or African American
Place of birth - Born in other state (%) - Asian
Place of birth - Born in other state (%) - Hispanic or Latino
Place of birth - Born in other state (%) - American Indian and Alaska Native
Place of birth - Born in other state (%) - Multirace
Place of birth - Born in other state (%) - Other Race
Place of birth - Native, outside of US (%)
Place of birth - Native, outside of US (%) - White
Place of birth - Native, outside of US (%) - Black or African American
Place of birth - Native, outside of US (%) - Asian
Place of birth - Native, outside of US (%) - Hispanic or Latino
Place of birth - Native, outside of US (%) - American Indian and Alaska Native
Place of birth - Native, outside of US (%) - Multirace
Place of birth - Native, outside of US (%) - Other Race
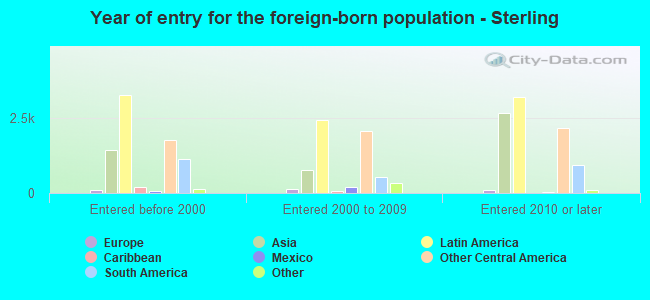
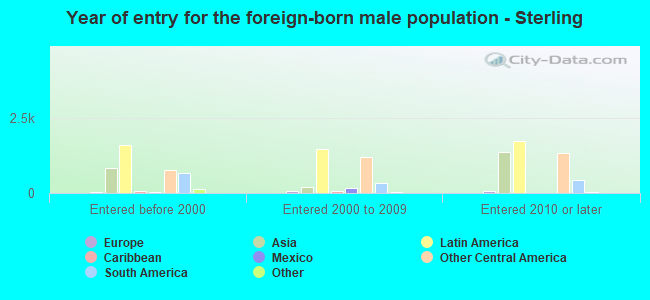
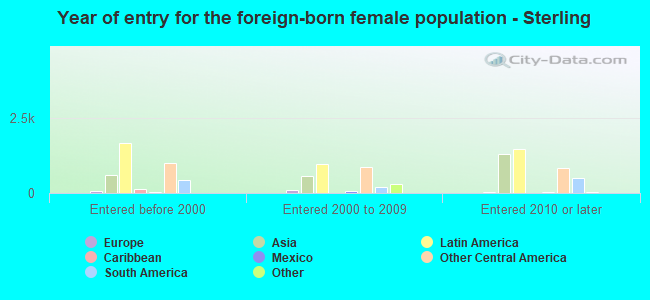
Place of birth - Foreign born (%)
Place of birth - Foreign born (%) - White
Place of birth - Foreign born (%) - Black or African American
Place of birth - Foreign born (%) - Asian
Place of birth - Foreign born (%) - Hispanic or Latino
Place of birth - Foreign born (%) - American Indian and Alaska Native
Place of birth - Foreign born (%) - Multirace
Place of birth - Foreign born (%) - Other Race
Residents speaking English at home (%)
Residents speaking English at home - Born in the United States (%)
Residents speaking English at home - Native, born elsewhere (%)
Residents speaking English at home - Foreign born (%)
Residents speaking Spanish at home (%)
Residents speaking Spanish at home - Born in the United States (%)
Residents speaking Spanish at home - Native, born elsewhere (%)
Residents speaking Spanish at home - Foreign born (%)
Residents speaking other language at home (%)
Residents speaking other language at home - Born in the United States (%)
Residents speaking other language at home - Native, born elsewhere (%)
Residents speaking other language at home - Foreign born (%)
Marital status - Never married (%)
Marital status - Now married (%)
Marital status - Separated (%)
Marital status - Widowed (%)
Marital status - Divorced (%)
Ancestries Reported - Arab (%)
Ancestries Reported - Czech (%)
Ancestries Reported - Danish (%)
Ancestries Reported - Dutch (%)
Ancestries Reported - English (%)
Ancestries Reported - French (%)
Ancestries Reported - French Canadian (%)
Ancestries Reported - German (%)
Ancestries Reported - Greek (%)
Ancestries Reported - Hungarian (%)
Ancestries Reported - Irish (%)
Ancestries Reported - Italian (%)
Ancestries Reported - Lithuanian (%)
Ancestries Reported - Norwegian (%)
Ancestries Reported - Polish (%)
Ancestries Reported - Portuguese (%)
Ancestries Reported - Russian (%)
Ancestries Reported - Scotch-Irish (%)
Ancestries Reported - Scottish (%)
Ancestries Reported - Slovak (%)
Ancestries Reported - Subsaharan African (%)
Ancestries Reported - Swedish (%)
Ancestries Reported - Swiss (%)
Ancestries Reported - Ukrainian (%)
Ancestries Reported - United States (%)
Ancestries Reported - Welsh (%)
Ancestries Reported - West Indian (%)
Ancestries Reported - Other (%)
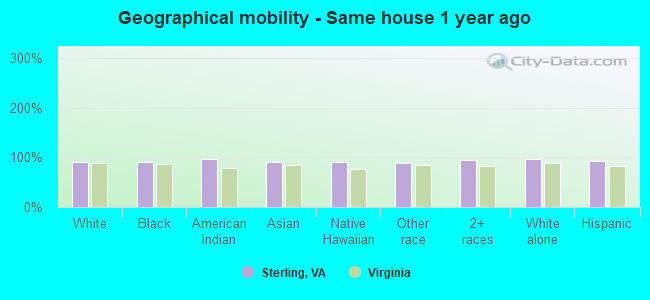
Geographical mobility - Same house 1 year ago (%)
Geographical mobility - Same house 1 year ago (%) - White
Geographical mobility - Same house 1 year ago (%) - Black or African American
Geographical mobility - Same house 1 year ago (%) - Asian
Geographical mobility - Same house 1 year ago (%) - Hispanic or Latino
Geographical mobility - Same house 1 year ago (%) - American Indian and Alaska Native
Geographical mobility - Same house 1 year ago (%) - Multirace
Geographical mobility - Same house 1 year ago (%) - Other Race
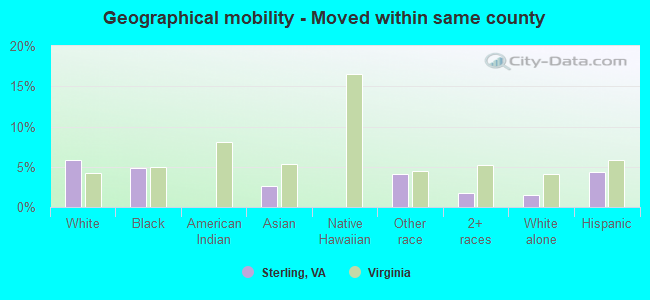
Geographical mobility - Moved within same county (%)
Geographical mobility - Moved within same county (%) - White
Geographical mobility - Moved within same county (%) - Black or African American
Geographical mobility - Moved within same county (%) - Asian
Geographical mobility - Moved within same county (%) - Hispanic or Latino
Geographical mobility - Moved within same county (%) - American Indian and Alaska Native
Geographical mobility - Moved within same county (%) - Multirace
Geographical mobility - Moved within same county (%) - Other Race
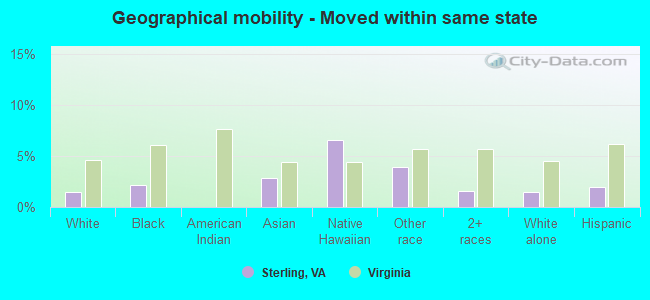
Geographical mobility - Moved from different county within same state (%)
Geographical mobility - Moved from different county within same state (%) - White
Geographical mobility - Moved from different county within same state (%) - Black or African American
Geographical mobility - Moved from different county within same state (%) - Asian
Geographical mobility - Moved from different county within same state (%) - Hispanic or Latino
Geographical mobility - Moved from different county within same state (%) - American Indian and Alaska Native
Geographical mobility - Moved from different county within same state (%) - Multirace
Geographical mobility - Moved from different county within same state (%) - Other Race
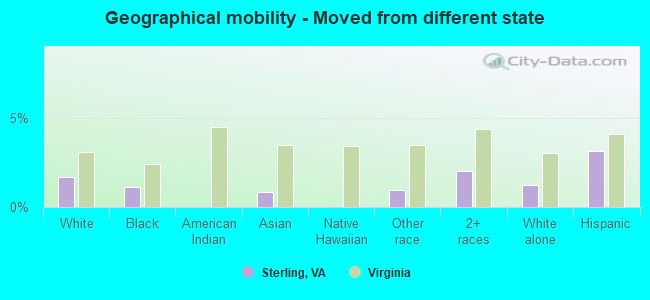
Geographical mobility - Moved from different state (%)
Geographical mobility - Moved from different state (%) - White
Geographical mobility - Moved from different state (%) - Black or African American
Geographical mobility - Moved from different state (%) - Asian
Geographical mobility - Moved from different state (%) - Hispanic or Latino
Geographical mobility - Moved from different state (%) - American Indian and Alaska Native
Geographical mobility - Moved from different state (%) - Multirace
Geographical mobility - Moved from different state (%) - Other Race
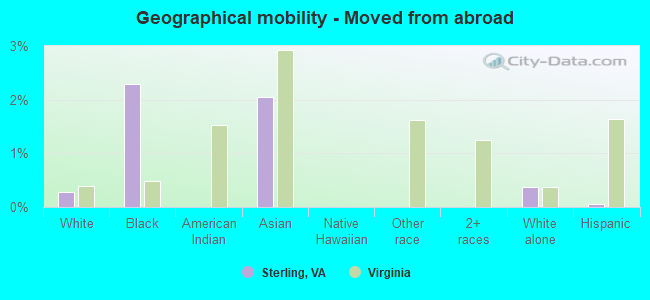
Geographical mobility - Moved from abroad (%)
Geographical mobility - Moved from abroad (%) - White
Geographical mobility - Moved from abroad (%) - Black or African American
Geographical mobility - Moved from abroad (%) - Asian
Geographical mobility - Moved from abroad (%) - Hispanic or Latino
Geographical mobility - Moved from abroad (%) - American Indian and Alaska Native
Geographical mobility - Moved from abroad (%) - Multirace
Geographical mobility - Moved from abroad (%) - Other Race
Place of birth for the foreign-born population - Ireland (%)
Place of birth for the foreign-born population - Denmark (%)
Place of birth for the foreign-born population - Norway (%)
Place of birth for the foreign-born population - Sweden (%)
Place of birth for the foreign-born population - United Kingdom (%)
Place of birth for the foreign-born population - England (%)
Place of birth for the foreign-born population - Scotland (%)
Place of birth for the foreign-born population - Other Northern Europe (%)
Place of birth for the foreign-born population - Austria (%)
Place of birth for the foreign-born population - Belgium (%)
Place of birth for the foreign-born population - France (%)
Place of birth for the foreign-born population - Germany (%)
Place of birth for the foreign-born population - Netherlands (%)
Place of birth for the foreign-born population - Switzerland (%)
Place of birth for the foreign-born population - Other Western Europe (%)
Place of birth for the foreign-born population - Greece (%)
Place of birth for the foreign-born population - Italy (%)
Place of birth for the foreign-born population - Portugal (%)
Place of birth for the foreign-born population - Spain (%)
Place of birth for the foreign-born population - Other Southern Europe (%)
Place of birth for the foreign-born population - Albania (%)
Place of birth for the foreign-born population - Belarus (%)
Place of birth for the foreign-born population - Bosnia and Herzegovina (%)
Place of birth for the foreign-born population - Bulgaria (%)
Place of birth for the foreign-born population - Croatia (%)
Place of birth for the foreign-born population - Czechoslovakia (%)
Place of birth for the foreign-born population - Hungary (%)
Place of birth for the foreign-born population - Latvia (%)
Place of birth for the foreign-born population - Lithuania (%)
Place of birth for the foreign-born population - North Macedonia (Macedonia) (%)
Place of birth for the foreign-born population - Moldova (%)
Place of birth for the foreign-born population - Poland (%)
Place of birth for the foreign-born population - Romania (%)
Place of birth for the foreign-born population - Russia (%)
Place of birth for the foreign-born population - Serbia (%)
Place of birth for the foreign-born population - Ukraine (%)
Place of birth for the foreign-born population - Other Eastern Europe (%)
Place of birth for the foreign-born population - China (%)
Place of birth for the foreign-born population - Hong Kong (%)
Place of birth for the foreign-born population - Taiwan (%)
Place of birth for the foreign-born population - Japan (%)
Place of birth for the foreign-born population - Korea (%)
Place of birth for the foreign-born population - Other Eastern Asia (%)
Place of birth for the foreign-born population - Afghanistan (%)
Place of birth for the foreign-born population - Bangladesh (%)
Place of birth for the foreign-born population - India (%)
Place of birth for the foreign-born population - Iran (%)
Place of birth for the foreign-born population - Kazakhstan (%)
Place of birth for the foreign-born population - Nepal (%)
Place of birth for the foreign-born population - Pakistan (%)
Place of birth for the foreign-born population - Sri Lanka (%)
Place of birth for the foreign-born population - Uzbekistan (%)
Place of birth for the foreign-born population - Other South Central Asia (%)
Place of birth for the foreign-born population - Burma (%)
Place of birth for the foreign-born population - Cambodia (%)
Place of birth for the foreign-born population - Indonesia (%)
Place of birth for the foreign-born population - Laos (%)
Place of birth for the foreign-born population - Malaysia (%)
Place of birth for the foreign-born population - Philippines (%)
Place of birth for the foreign-born population - Singapore (%)
Place of birth for the foreign-born population - Thailand (%)
Place of birth for the foreign-born population - Vietnam (%)
Place of birth for the foreign-born population - Other South Eastern Asia (%)
Place of birth for the foreign-born population - Armenia (%)
Place of birth for the foreign-born population - Iraq (%)
Place of birth for the foreign-born population - Israel (%)
Place of birth for the foreign-born population - Jordan (%)
Place of birth for the foreign-born population - Kuwait (%)
Place of birth for the foreign-born population - Lebanon (%)
Place of birth for the foreign-born population - Saudi Arabia (%)
Place of birth for the foreign-born population - Syria (%)
Place of birth for the foreign-born population - Turkey (%)
Place of birth for the foreign-born population - Yemen (%)
Place of birth for the foreign-born population - Other Western Asia (%)
Place of birth for the foreign-born population - Eritrea (%)
Place of birth for the foreign-born population - Ethiopia (%)
Place of birth for the foreign-born population - Kenya (%)
Place of birth for the foreign-born population - Somalia (%)
Place of birth for the foreign-born population - Uganda (%)
Place of birth for the foreign-born population - Zimbabwe (%)
Place of birth for the foreign-born population - Other Eastern Africa (%)
Place of birth for the foreign-born population - Cameroon (%)
Place of birth for the foreign-born population - Congo (%)
Place of birth for the foreign-born population - Democratic Republic of Congo (Zaire) (%)
Place of birth for the foreign-born population - Other Middle Africa (%)
Place of birth for the foreign-born population - Egypt (%)
Place of birth for the foreign-born population - Morocco (%)
Place of birth for the foreign-born population - Sudan (%)
Place of birth for the foreign-born population - Other Northern Africa (%)
Place of birth for the foreign-born population - South Africa (%)
Place of birth for the foreign-born population - Other Southern Africa (%)
Place of birth for the foreign-born population - Cabo Verde (%)
Place of birth for the foreign-born population - Ghana (%)
Place of birth for the foreign-born population - Liberia (%)
Place of birth for the foreign-born population - Nigeria (%)
Place of birth for the foreign-born population - Senegal (%)
Place of birth for the foreign-born population - Sierra Leone (%)
Place of birth for the foreign-born population - Other Western Africa (%)
Place of birth for the foreign-born population - Australia (%)
Place of birth for the foreign-born population - New Zealand (%)
Place of birth for the foreign-born population - Fiji (%)
Place of birth for the foreign-born population - Micronesia (%)
Place of birth for the foreign-born population - Bahamas (%)
Place of birth for the foreign-born population - Barbados (%)
Place of birth for the foreign-born population - Cuba (%)
Place of birth for the foreign-born population - Dominica (%)
Place of birth for the foreign-born population - Dominican Republic (%)
Place of birth for the foreign-born population - Grenada (%)
Place of birth for the foreign-born population - Haiti (%)
Place of birth for the foreign-born population - Jamaica (%)
Place of birth for the foreign-born population - St. Vincent and the Grenadines (%)
Place of birth for the foreign-born population - Trinidad and Tobago (%)
Place of birth for the foreign-born population - West Indies (%)
Place of birth for the foreign-born population - Other Caribbean (%)
Place of birth for the foreign-born population - Belize (%)
Place of birth for the foreign-born population - Costa Rica (%)
Place of birth for the foreign-born population - El Salvador (%)
Place of birth for the foreign-born population - Guatemala (%)
Place of birth for the foreign-born population - Honduras (%)
Place of birth for the foreign-born population - Mexico (%)
Place of birth for the foreign-born population - Nicaragua (%)
Place of birth for the foreign-born population - Panama (%)
Place of birth for the foreign-born population - Other Central America (%)
Place of birth for the foreign-born population - Argentina (%)
Place of birth for the foreign-born population - Bolivia (%)
Place of birth for the foreign-born population - Brazil (%)
Place of birth for the foreign-born population - Chile (%)
Place of birth for the foreign-born population - Colombia (%)
Place of birth for the foreign-born population - Ecuador (%)
Place of birth for the foreign-born population - Guyana (%)
Place of birth for the foreign-born population - Peru (%)
Place of birth for the foreign-born population - Uruguay (%)
Place of birth for the foreign-born population - Venezuela (%)
Place of birth for the foreign-born population - Other South America (%)
Place of birth for the foreign-born population - Canada (%)
Place of birth for the foreign-born population - Other Northern America (%)
Place of birth for the foreign-born population - Other (%)
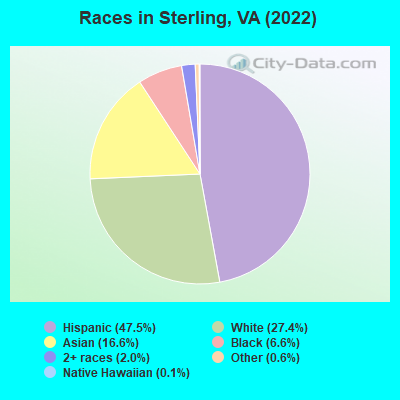
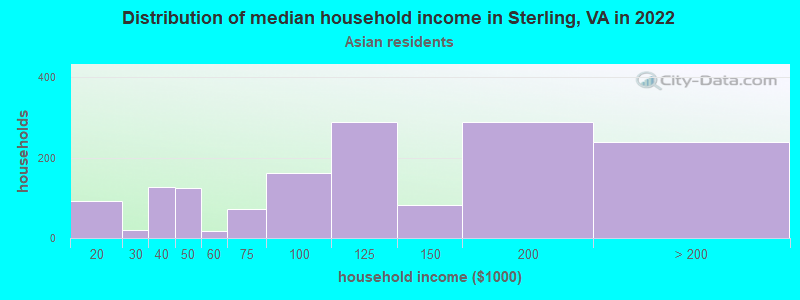
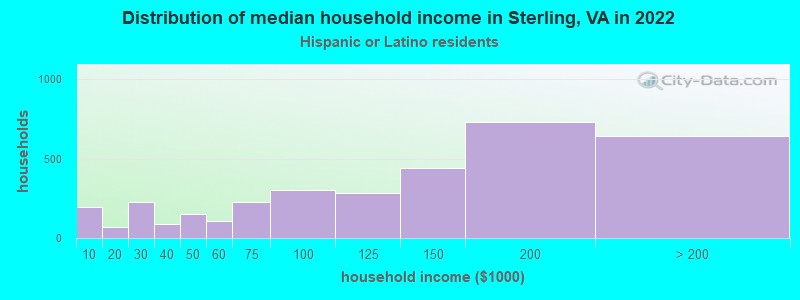
According to 2022 data, the most numerous races in Sterling, VA are White alone (8,724 residents), Black alone (2,090 residents), and Hispanic (15,141 residents). 38.8% of Sterling residents speak English at home.
Race distribution in Sterling 15,141 47.5% Hispanic 8,724 27.4% White alone 5,281 16.6% Asian alone 2,090 6.6% Black alone 645 2.0% Two or more races 206 0.6% Other race alone 33 0.1% Native Hawaiian and Other 14 0.04% American Indian alone
2000 2022
4,965,637 70.2% White alone 1,376,378 19.4% Black alone 329,540 4.7% Hispanic 259,277 3.7% Asian alone 114,022 1.6% Two or more races 18,596 0.3% American Indian alone 11,685 0.2% Other race alone 3,380 0.05% Native Hawaiian and Other
5,095,130 58.7% White alone 1,594,785 18.4% Black alone 905,750 10.4% Hispanic 602,881 6.9% Asian alone 406,047 4.7% Two or more races 60,419 0.7% Other race alone 11,738 0.1% American Indian alone 6,869 0.08% Native Hawaiian and Other
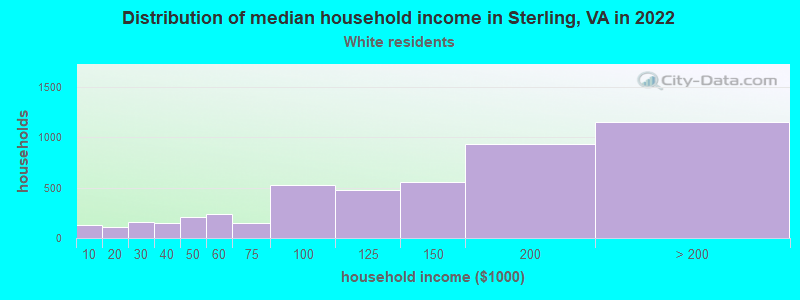
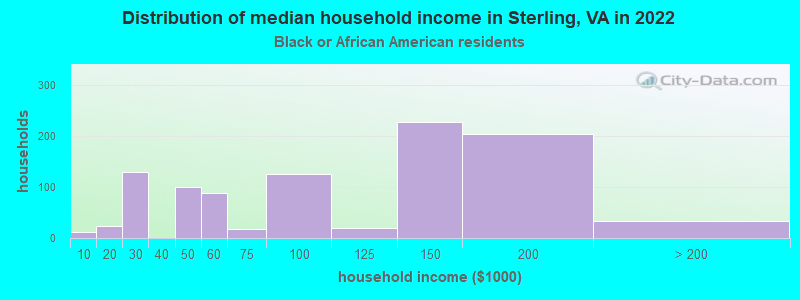
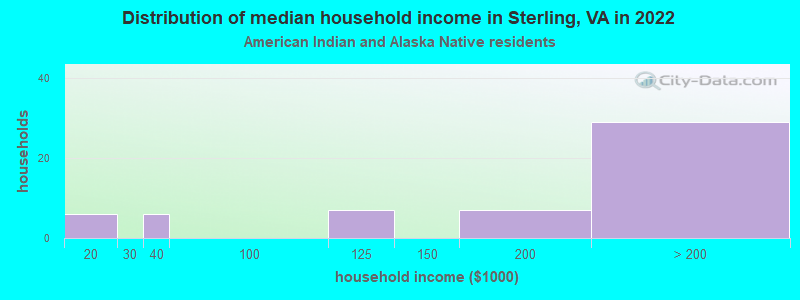
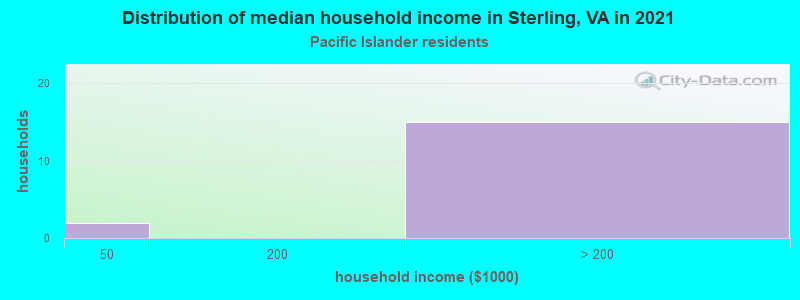
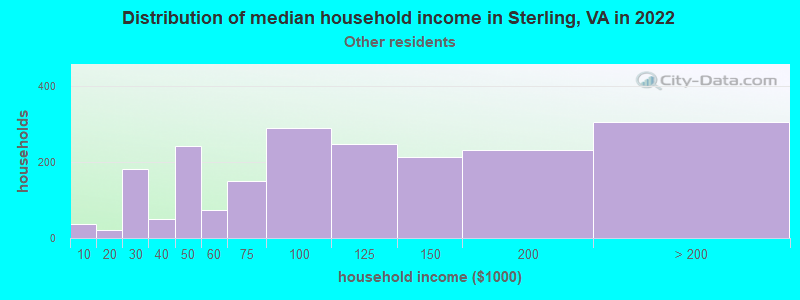
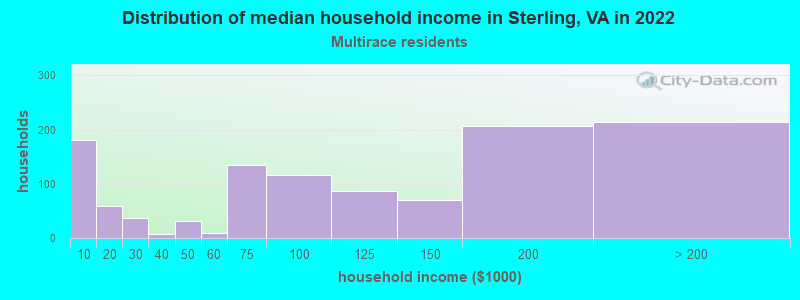
Income and house value in Sterling Median household income in 2022 $129,512 White non-Hispanic householders$111,624 Black householdersover $200,000 American Indian and Alaska Native householders$103,905 Asian householders$91,537 Some other race householders$99,089 Two or more races householders$138,313 Hispanic or Latino race householders
Median age by race in Sterling
39.6 Median age for White residents40.2 39.2 43.9 Median age for Black or African American residents39.3 51.4 43.1 Median age for American Indian / Alaska Native residents48.2 32.8 35.6 Median age for Asian residents39.2 34.2 46.7 Median age for Native Hawaiian / Pacific Islander residents52.1 -714,150,046.8 30.5 Median age for Other race residents31.3 29.1 34.8 Median age for Two or more races residents32.2 37.6 47.5 Median age for White alone residents49.2 46.4 29.6 Median age for Hispanic or Latino residents29.3 30.9
Owner/renter occupied households by race in Sterling
House owners and renters - White residents 3,982 82.1% Owner occupied866 17.9% Renter occupiedHouse owners and renters - Black or African American residents 631 67.4% Owner occupied305 32.6% Renter occupiedHouse owners and renters - American Indian / Alaska Native residents 29 49.5% Owner occupied30 50.5% Renter occupiedHouse owners and renters - Asian residents 986 68.5% Owner occupied453 31.5% Renter occupiedHouse owners and renters - Native Hawaiian / Pacific Islander residents 19 100.0% Owner occupiedHouse owners and renters - Other race residents 1,302 67.8% Owner occupied619 32.2% Renter occupiedHouse owners and renters - Two or more races residents 907 80.1% Owner occupied225 19.9% Renter occupiedHouse owners and renters - White alone residents 3,409 85.0% Owner occupied603 15.0% Renter occupiedHouse owners and renters - Hispanic or Latino residents 2,466 72.3% Owner occupied943 27.7% Renter occupied
Language usage in Sterling
English speakers - Total 38.8% of residents of Sterling speak English at home.
40.9% of residents speak Spanish at home 6,221 51.2% Speak English very well5,925 48.8% Speak English less than very well19.6% of residents speak other language at home 3,337 57.3% Speak English very well2,491 42.7% Speak English less than very well
English speakers - Born in the United States 85.2% of residents of Sterling speak English at home.
10.7% of residents speak Spanish at home 714 92.5% Speak English very well58 7.5% Speak English less than very well3.2% of residents speak other language at home 226 97.0% Speak English very well7 3.0% Speak English less than very well
English speakers - Native, born elsewhere 37.3% of residents of Sterling speak English at home.
33.0% of residents speak Spanish at home 193 78.8% Speak English very well52 21.2% Speak English less than very well17.0% of residents speak other language at home 109 86.5% Speak English very well17 13.5% Speak English less than very well
English speakers - Foreign-born 8.8% of residents of Sterling speak English at home.
52.0% of residents speak Spanish at home 2,181 28.4% Speak English very well5,497 71.6% Speak English less than very well32.9% of residents speak other language at home 2,554 52.6% Speak English very well2,300 47.4% Speak English less than very well
White (Caucasian) - Speak only English Native:
81.7% (7,286)Foreign-born:
9.4% (264)
White (Caucasian) - Speak another language Native:
18.3% (1,631)Foreign-born:
92.3% (2,593)
Black or African American - Speak only English Native:
93.5% (1,391)Foreign-born:
33.6% (152)
Black or African American - Speak another language Native:
6.6% (98)Foreign-born:
62.7% (284)
American Indian / Alaska Native - Speak another language Native:
33.5% (18)Foreign-born:
100.0% (143)
Asian - Speak only English Native:
53.6% (506)Foreign-born:
12.7% (506)
Asian - Speak another language Native:
45.9% (433)Foreign-born:
87.4% (3,493)
Other race - Speak only English Native:
21.7% (485)Foreign-born:
5.8% (340)
Other race - Speak another language Native:
78.7% (1,753)Foreign-born:
95.0% (5,538)
Two or more races - Speak only English Native:
28.2% (606)Foreign-born:
2.8% (63)
Two or more races - Speak another language Native:
83.8% (1,801)Foreign-born:
96.5% (2,152)
White alone - Speak only English Native:
93.3% (6,903)Foreign-born:
22.8% (231)
White alone - Speak another language Native:
7.0% (522)Foreign-born:
76.0% (769)
Hispanic or Latino - Speak only English Native:
20.5% (1,071)Foreign-born:
4.9% (419)
Hispanic or Latino - Speak another language Native:
78.4% (4,098)Foreign-born:
94.7% (8,113)
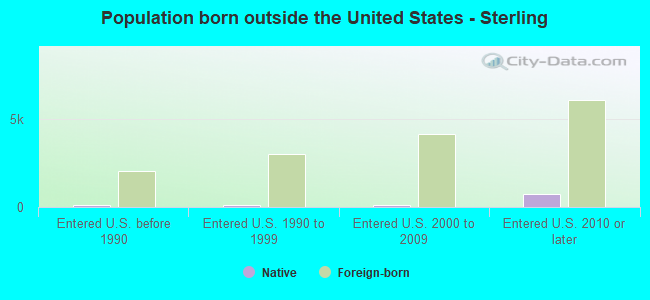
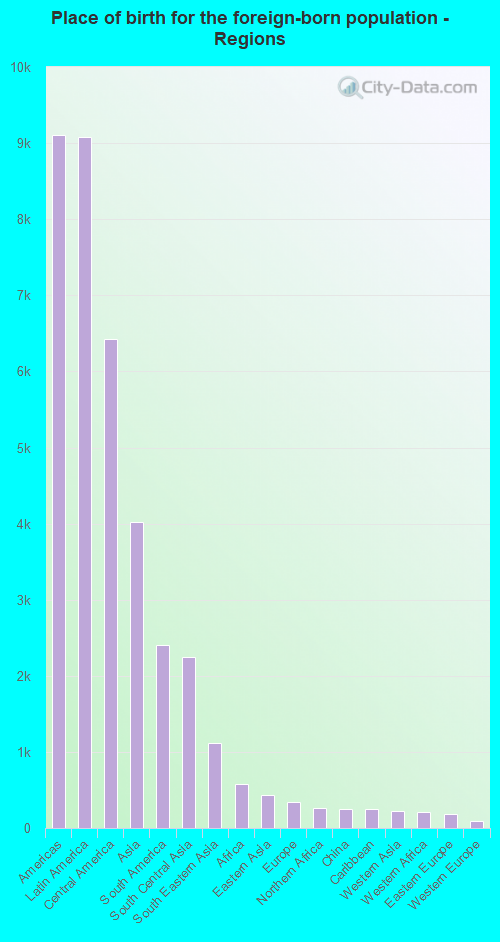
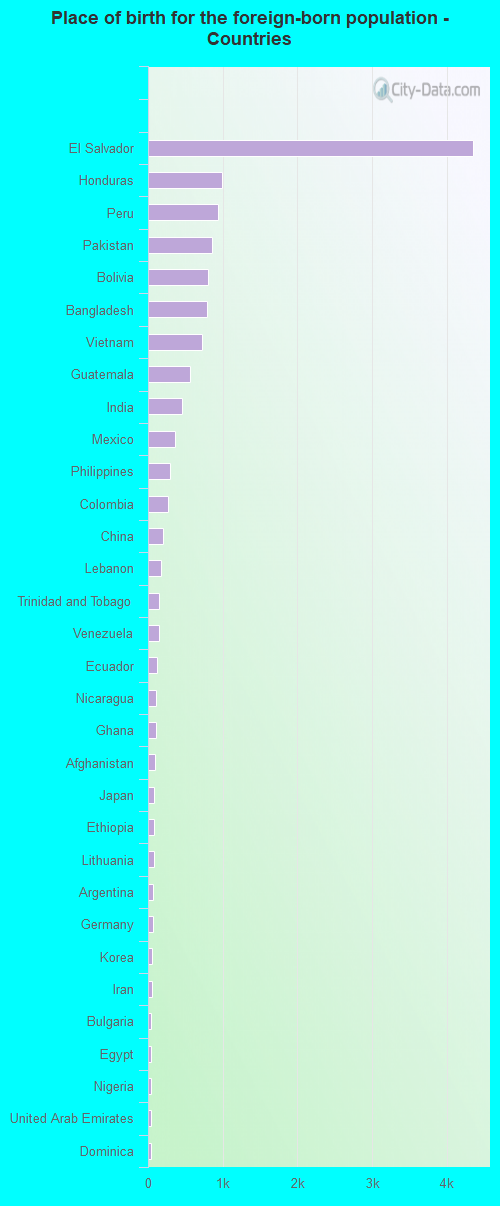
Foreign-born residents in Sterling
Marital status for residents in Sterling Marital status - White (Caucasian) population 15 years and over
Males 30.4% Never married58.8% Now married1.0% Separated4.2% Widowed5.6% DivorcedFemales 25.1% Never married56.6% Now married3.5% Separated4.9% Widowed10.0% DivorcedWomen who gave birth in the past 12 months Now married:
94.8% (300)Unmarried:
5.2% (16)
Women who did not give birth in the past 12 months Now married:
53.6% (1,347)Unmarried:
46.4% (1,168)
Marital status - Black or African American population 15 years and over
Males 45.0% Never married51.3% Now married0.0% Separated0.0% Widowed3.6% DivorcedFemales 36.5% Never married24.1% Now married8.6% Separated17.0% Widowed13.7% DivorcedWomen who did not give birth in the past 12 months Now married:
46.5% (207)Unmarried:
53.5% (239)
Marital status - American Indian / Alaska Native population 15 years and over
Males 49.2% Never married42.6% Now married0.0% Separated0.0% Widowed8.2% DivorcedFemales 26.9% Never married65.7% Now married0.0% Separated0.0% Widowed7.5% DivorcedWomen who gave birth in the past 12 months Now married:
100.0% (20)Unmarried:
0.0% (0)
Women who did not give birth in the past 12 months Now married:
51.4% (20)Unmarried:
48.6% (19)
Marital status - Asian population 15 years and over
Males 28.9% Never married67.7% Now married0.0% Separated1.6% Widowed1.8% DivorcedFemales 30.9% Never married56.9% Now married0.8% Separated6.2% Widowed5.2% DivorcedWomen who gave birth in the past 12 months Now married:
100.0% (28)Unmarried:
0.0% (0)
Women who did not give birth in the past 12 months Now married:
56.4% (969)Unmarried:
43.6% (749)
Marital status - Native Hawaiian / Pacific Islander population 15 years and over
Males 45.2% Never married54.8% Now married0.0% Separated0.0% Widowed0.0% DivorcedFemales 100.0% Never married0.0% Now married0.0% Separated0.0% Widowed0.0% DivorcedWomen who did not give birth in the past 12 months Now married:
0.0% (0)Unmarried:
100.0% (11)
Marital status - Other race population 15 years and over
Males 52.5% Never married30.2% Now married2.8% Separated0.9% Widowed13.6% DivorcedFemales 31.7% Never married45.4% Now married7.4% Separated0.6% Widowed14.9% DivorcedWomen who gave birth in the past 12 months Now married:
100.0% (81)Unmarried:
0.0% (0)
Women who did not give birth in the past 12 months Now married:
48.7% (936)Unmarried:
51.3% (986)
Marital status - Two or more races population 15 years and over
Males 43.0% Never married50.6% Now married1.8% Separated0.6% Widowed3.9% DivorcedFemales 50.8% Never married36.7% Now married1.0% Separated1.0% Widowed10.5% DivorcedWomen who gave birth in the past 12 months Now married:
24.6% (20)Unmarried:
75.4% (63)
Women who did not give birth in the past 12 months Now married:
23.0% (356)Unmarried:
77.0% (1,194)
Marital status - White alone, not Hispanic / Latino population 15 years and over
Males 28.1% Never married59.1% Now married1.4% Separated6.0% Widowed5.3% DivorcedFemales 20.1% Never married60.7% Now married3.5% Separated6.1% Widowed9.6% DivorcedWomen who gave birth in the past 12 months Now married:
100.0% (252)Unmarried:
0.0% (0)
Women who did not give birth in the past 12 months Now married:
58.5% (1,020)Unmarried:
41.5% (723)
Marital status - Hispanic or Latino population 15 years and over
Males 46.2% Never married41.7% Now married1.9% Separated0.5% Widowed9.7% DivorcedFemales 38.6% Never married43.7% Now married4.4% Separated0.9% Widowed12.4% DivorcedWomen who gave birth in the past 12 months Now married:
71.5% (172)Unmarried:
28.5% (69)
Women who did not give birth in the past 12 months Now married:
40.8% (1,493)Unmarried:
59.2% (2,168)
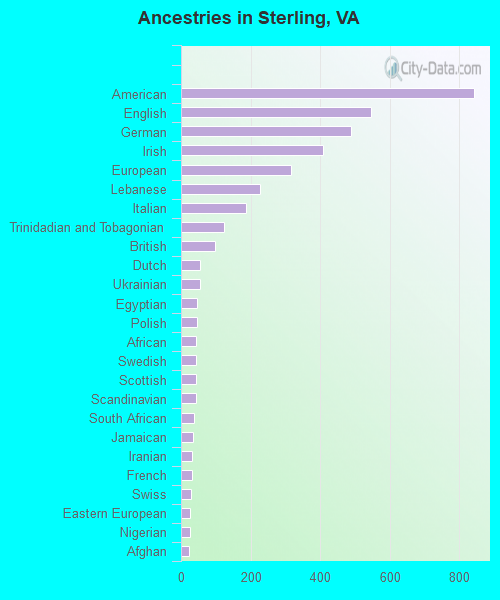
Ancestries in Sterling
843 4.8% American546 3.1% English488 2.8% German408 2.3% Irish317 1.8% European227 1.3% Lebanese188 1.1% Italian123 0.7% Trinidadian and Tobagonian98 0.6% British55 0.3% Dutch55 0.3% Ukrainian46 0.3% Egyptian45 0.3% Polish44 0.3% African43 0.2% Swedish43 0.2% Scottish43 0.2% Scandinavian37 0.2% South African35 0.2% Jamaican33 0.2% Iranian31 0.2% French29 0.2% Swiss27 0.2% Eastern European25 0.1% Nigerian24 0.1% Afghan21 0.1% Australian16 0.09% French Canadian14 0.08% Welsh14 0.08% Finnish14 0.08% Yugoslavian13 0.07% Ethiopian13 0.07% Ghanaian13 0.07% Scotch-Irish11 0.06% Bulgarian9 0.05% Belgian9 0.05% Turkish8 0.05% Croatian7 0.04% Norwegian5 0.03% Czechoslovakian5 0.03% West Indian1 0.01% Belizean
Geographical mobility in Sterling Same house 1 year ago 10,949 91.0% White (Caucasian)1,869 90.3% Black or African American160 96.1% American Indian / Alaska Native4,831 90.7% Asian47 90.6% Native Hawaiian / Pacific Islander7,691 89.5% Other race4,502 93.9% Two or more races8,217 95.7% White alone, not Hispanic / Latino13,505 92.0% Hispanic or LatinoMoved within same county 705 5.9% White / Caucasian99 4.8% Black or African American142 2.7% Asian353 4.1% Other race82 1.7% Two or more races132 1.5% White alone, not Hispanic / Latino643 4.4% Hispanic or LatinoMoved within same state 172 1.4% White / Caucasian45 2.2% Black or African American153 2.9% Asian3 6.5% Native Hawaiian / Pacific Islander339 3.9% Other race74 1.5% Two or more races129 1.5% White alone, not Hispanic / Latino291 2.0% Hispanic or LatinoMoved from different state 201 1.7% White / Caucasian23 1.1% Black or African American44 0.8% Asian80 0.9% Other race96 2.0% Two or more races107 1.3% White alone, not Hispanic / Latino456 3.1% Hispanic or LatinoMoved from abroad 33 0.3% White47 2.3% Black or African American109 2.0% Asian32 0.4% White alone, not Hispanic / Latino7 0.0% Hispanic or Latino
Children Nativity (place of birth) in Sterling
Children under 6 years - Living with two parents Both parents native 254 100.0% NativeBoth parents foreign-born 1,160 93.4% Native81 6.6% Foreign-bornOne native, one foreign-born parent 408 100.0% NativeChildren under 6 years - Living with one parent Native parent 47 87.8% Native6 12.2% Foreign-bornForeign-born parent 383 76.4% Native119 23.6% Foreign-bornChildren 6 to 17 years - Living with two parents Both parents native 703 100.0% NativeBoth parents foreign-born 1,537 77.4% Native448 22.6% Foreign-bornOne native, one foreign-born parent 327 100.0% NativeChildren 6 to 17 years - Living with one parent Foreign-born parent 1,196 59.9% Native801 40.1% Foreign-born
Grandparents responsible for own grandchildren in Sterling
Grandparents (30 to 59 years) White / Caucasian 10 11.8% Responsible for grandchildren73 88.2% Not responsible for grandchildrenBlack or African American 14 48.4% Responsible for grandchildren15 51.6% Not responsible for grandchildrenAsian 17 100.0% Not responsible for grandchildrenOther race 143 71.5% Responsible for grandchildren57 28.5% Not responsible for grandchildrenTwo or more races 47 100.0% Not responsible for grandchildrenWhite alone, not Hispanic / Latino 10 100.0% Responsible for grandchildrenHispanic or Latino 110 43.8% Responsible for grandchildren142 56.2% Not responsible for grandchildrenGrandparents (60 years and over) White / Caucasian 214 100.0% Not responsible for grandchildrenBlack or African American 31 100.0% Not responsible for grandchildrenAsian 5 4.2% Responsible for grandchildren111 95.8% Not responsible for grandchildrenOther race 62 100.0% Not responsible for grandchildrenTwo or more races 224 100.0% Not responsible for grandchildrenWhite alone, not Hispanic / Latino 55 100.0% Not responsible for grandchildrenHispanic or Latino 392 100.0% Not responsible for grandchildren