Races in Stevens Point, Wisconsin (WI) Detailed Stats
Data:
Races - White alone (%)
Races - White alone (% change since 2000)
Races - Black alone (%)
Races - Black alone (% change since 2000)
Races - American Indian alone (%)
Races - American Indian alone (% change since 2000)
Races - Asian alone (%)
Races - Asian alone (% change since 2000)
Races - Hispanic (%)
Races - Hispanic (% change since 2000)
Races - Native Hawaiian and Other Pacific Islander alone (%)
Races - Native Hawaiian and Other Pacific Islander alone (% change since 2000)
Races - Two or more races(%)
Races - Two or more races(% change since 2000)
Races - Other race alone (%)
Races - Other race alone (% change since 2000)
Racial diversity
Place of birth - Born in state of residence (%)
Place of birth - Born in state of residence (%) - White
Place of birth - Born in state of residence (%) - Black or African American
Place of birth - Born in state of residence (%) - Asian
Place of birth - Born in state of residence (%) - Hispanic or Latino
Place of birth - Born in state of residence (%) - American Indian and Alaska Native
Place of birth - Born in state of residence (%) - Multirace
Place of birth - Born in state of residence (%) - Other Race
Place of birth - Born in other state (%)
Place of birth - Born in other state (%) - White
Place of birth - Born in other state (%) - Black or African American
Place of birth - Born in other state (%) - Asian
Place of birth - Born in other state (%) - Hispanic or Latino
Place of birth - Born in other state (%) - American Indian and Alaska Native
Place of birth - Born in other state (%) - Multirace
Place of birth - Born in other state (%) - Other Race
Place of birth - Native, outside of US (%)
Place of birth - Native, outside of US (%) - White
Place of birth - Native, outside of US (%) - Black or African American
Place of birth - Native, outside of US (%) - Asian
Place of birth - Native, outside of US (%) - Hispanic or Latino
Place of birth - Native, outside of US (%) - American Indian and Alaska Native
Place of birth - Native, outside of US (%) - Multirace
Place of birth - Native, outside of US (%) - Other Race
Place of birth - Foreign born (%)
Place of birth - Foreign born (%) - White
Place of birth - Foreign born (%) - Black or African American
Place of birth - Foreign born (%) - Asian
Place of birth - Foreign born (%) - Hispanic or Latino
Place of birth - Foreign born (%) - American Indian and Alaska Native
Place of birth - Foreign born (%) - Multirace
Place of birth - Foreign born (%) - Other Race
Residents speaking English at home (%)
Residents speaking English at home - Born in the United States (%)
Residents speaking English at home - Native, born elsewhere (%)
Residents speaking English at home - Foreign born (%)
Residents speaking Spanish at home (%)
Residents speaking Spanish at home - Born in the United States (%)
Residents speaking Spanish at home - Native, born elsewhere (%)
Residents speaking Spanish at home - Foreign born (%)
Residents speaking other language at home (%)
Residents speaking other language at home - Born in the United States (%)
Residents speaking other language at home - Native, born elsewhere (%)
Residents speaking other language at home - Foreign born (%)
Marital status - Never married (%)
Marital status - Now married (%)
Marital status - Separated (%)
Marital status - Widowed (%)
Marital status - Divorced (%)
Ancestries Reported - Arab (%)
Ancestries Reported - Czech (%)
Ancestries Reported - Danish (%)
Ancestries Reported - Dutch (%)
Ancestries Reported - English (%)
Ancestries Reported - French (%)
Ancestries Reported - French Canadian (%)
Ancestries Reported - German (%)
Ancestries Reported - Greek (%)
Ancestries Reported - Hungarian (%)
Ancestries Reported - Irish (%)
Ancestries Reported - Italian (%)
Ancestries Reported - Lithuanian (%)
Ancestries Reported - Norwegian (%)
Ancestries Reported - Polish (%)
Ancestries Reported - Portuguese (%)
Ancestries Reported - Russian (%)
Ancestries Reported - Scotch-Irish (%)
Ancestries Reported - Scottish (%)
Ancestries Reported - Slovak (%)
Ancestries Reported - Subsaharan African (%)
Ancestries Reported - Swedish (%)
Ancestries Reported - Swiss (%)
Ancestries Reported - Ukrainian (%)
Ancestries Reported - United States (%)
Ancestries Reported - Welsh (%)
Ancestries Reported - West Indian (%)
Ancestries Reported - Other (%)
Geographical mobility - Same house 1 year ago (%)
Geographical mobility - Same house 1 year ago (%) - White
Geographical mobility - Same house 1 year ago (%) - Black or African American
Geographical mobility - Same house 1 year ago (%) - Asian
Geographical mobility - Same house 1 year ago (%) - Hispanic or Latino
Geographical mobility - Same house 1 year ago (%) - American Indian and Alaska Native
Geographical mobility - Same house 1 year ago (%) - Multirace
Geographical mobility - Same house 1 year ago (%) - Other Race
Geographical mobility - Moved within same county (%)
Geographical mobility - Moved within same county (%) - White
Geographical mobility - Moved within same county (%) - Black or African American
Geographical mobility - Moved within same county (%) - Asian
Geographical mobility - Moved within same county (%) - Hispanic or Latino
Geographical mobility - Moved within same county (%) - American Indian and Alaska Native
Geographical mobility - Moved within same county (%) - Multirace
Geographical mobility - Moved within same county (%) - Other Race
Geographical mobility - Moved from different county within same state (%)
Geographical mobility - Moved from different county within same state (%) - White
Geographical mobility - Moved from different county within same state (%) - Black or African American
Geographical mobility - Moved from different county within same state (%) - Asian
Geographical mobility - Moved from different county within same state (%) - Hispanic or Latino
Geographical mobility - Moved from different county within same state (%) - American Indian and Alaska Native
Geographical mobility - Moved from different county within same state (%) - Multirace
Geographical mobility - Moved from different county within same state (%) - Other Race
Geographical mobility - Moved from different state (%)
Geographical mobility - Moved from different state (%) - White
Geographical mobility - Moved from different state (%) - Black or African American
Geographical mobility - Moved from different state (%) - Asian
Geographical mobility - Moved from different state (%) - Hispanic or Latino
Geographical mobility - Moved from different state (%) - American Indian and Alaska Native
Geographical mobility - Moved from different state (%) - Multirace
Geographical mobility - Moved from different state (%) - Other Race
Geographical mobility - Moved from abroad (%)
Geographical mobility - Moved from abroad (%) - White
Geographical mobility - Moved from abroad (%) - Black or African American
Geographical mobility - Moved from abroad (%) - Asian
Geographical mobility - Moved from abroad (%) - Hispanic or Latino
Geographical mobility - Moved from abroad (%) - American Indian and Alaska Native
Geographical mobility - Moved from abroad (%) - Multirace
Geographical mobility - Moved from abroad (%) - Other Race
Place of birth for the foreign-born population - Ireland (%)
Place of birth for the foreign-born population - Denmark (%)
Place of birth for the foreign-born population - Norway (%)
Place of birth for the foreign-born population - Sweden (%)
Place of birth for the foreign-born population - United Kingdom (%)
Place of birth for the foreign-born population - England (%)
Place of birth for the foreign-born population - Scotland (%)
Place of birth for the foreign-born population - Other Northern Europe (%)
Place of birth for the foreign-born population - Austria (%)
Place of birth for the foreign-born population - Belgium (%)
Place of birth for the foreign-born population - France (%)
Place of birth for the foreign-born population - Germany (%)
Place of birth for the foreign-born population - Netherlands (%)
Place of birth for the foreign-born population - Switzerland (%)
Place of birth for the foreign-born population - Other Western Europe (%)
Place of birth for the foreign-born population - Greece (%)
Place of birth for the foreign-born population - Italy (%)
Place of birth for the foreign-born population - Portugal (%)
Place of birth for the foreign-born population - Spain (%)
Place of birth for the foreign-born population - Other Southern Europe (%)
Place of birth for the foreign-born population - Albania (%)
Place of birth for the foreign-born population - Belarus (%)
Place of birth for the foreign-born population - Bosnia and Herzegovina (%)
Place of birth for the foreign-born population - Bulgaria (%)
Place of birth for the foreign-born population - Croatia (%)
Place of birth for the foreign-born population - Czechoslovakia (%)
Place of birth for the foreign-born population - Hungary (%)
Place of birth for the foreign-born population - Latvia (%)
Place of birth for the foreign-born population - Lithuania (%)
Place of birth for the foreign-born population - North Macedonia (Macedonia) (%)
Place of birth for the foreign-born population - Moldova (%)
Place of birth for the foreign-born population - Poland (%)
Place of birth for the foreign-born population - Romania (%)
Place of birth for the foreign-born population - Russia (%)
Place of birth for the foreign-born population - Serbia (%)
Place of birth for the foreign-born population - Ukraine (%)
Place of birth for the foreign-born population - Other Eastern Europe (%)
Place of birth for the foreign-born population - China (%)
Place of birth for the foreign-born population - Hong Kong (%)
Place of birth for the foreign-born population - Taiwan (%)
Place of birth for the foreign-born population - Japan (%)
Place of birth for the foreign-born population - Korea (%)
Place of birth for the foreign-born population - Other Eastern Asia (%)
Place of birth for the foreign-born population - Afghanistan (%)
Place of birth for the foreign-born population - Bangladesh (%)
Place of birth for the foreign-born population - India (%)
Place of birth for the foreign-born population - Iran (%)
Place of birth for the foreign-born population - Kazakhstan (%)
Place of birth for the foreign-born population - Nepal (%)
Place of birth for the foreign-born population - Pakistan (%)
Place of birth for the foreign-born population - Sri Lanka (%)
Place of birth for the foreign-born population - Uzbekistan (%)
Place of birth for the foreign-born population - Other South Central Asia (%)
Place of birth for the foreign-born population - Burma (%)
Place of birth for the foreign-born population - Cambodia (%)
Place of birth for the foreign-born population - Indonesia (%)
Place of birth for the foreign-born population - Laos (%)
Place of birth for the foreign-born population - Malaysia (%)
Place of birth for the foreign-born population - Philippines (%)
Place of birth for the foreign-born population - Singapore (%)
Place of birth for the foreign-born population - Thailand (%)
Place of birth for the foreign-born population - Vietnam (%)
Place of birth for the foreign-born population - Other South Eastern Asia (%)
Place of birth for the foreign-born population - Armenia (%)
Place of birth for the foreign-born population - Iraq (%)
Place of birth for the foreign-born population - Israel (%)
Place of birth for the foreign-born population - Jordan (%)
Place of birth for the foreign-born population - Kuwait (%)
Place of birth for the foreign-born population - Lebanon (%)
Place of birth for the foreign-born population - Saudi Arabia (%)
Place of birth for the foreign-born population - Syria (%)
Place of birth for the foreign-born population - Turkey (%)
Place of birth for the foreign-born population - Yemen (%)
Place of birth for the foreign-born population - Other Western Asia (%)
Place of birth for the foreign-born population - Eritrea (%)
Place of birth for the foreign-born population - Ethiopia (%)
Place of birth for the foreign-born population - Kenya (%)
Place of birth for the foreign-born population - Somalia (%)
Place of birth for the foreign-born population - Uganda (%)
Place of birth for the foreign-born population - Zimbabwe (%)
Place of birth for the foreign-born population - Other Eastern Africa (%)
Place of birth for the foreign-born population - Cameroon (%)
Place of birth for the foreign-born population - Congo (%)
Place of birth for the foreign-born population - Democratic Republic of Congo (Zaire) (%)
Place of birth for the foreign-born population - Other Middle Africa (%)
Place of birth for the foreign-born population - Egypt (%)
Place of birth for the foreign-born population - Morocco (%)
Place of birth for the foreign-born population - Sudan (%)
Place of birth for the foreign-born population - Other Northern Africa (%)
Place of birth for the foreign-born population - South Africa (%)
Place of birth for the foreign-born population - Other Southern Africa (%)
Place of birth for the foreign-born population - Cabo Verde (%)
Place of birth for the foreign-born population - Ghana (%)
Place of birth for the foreign-born population - Liberia (%)
Place of birth for the foreign-born population - Nigeria (%)
Place of birth for the foreign-born population - Senegal (%)
Place of birth for the foreign-born population - Sierra Leone (%)
Place of birth for the foreign-born population - Other Western Africa (%)
Place of birth for the foreign-born population - Australia (%)
Place of birth for the foreign-born population - New Zealand (%)
Place of birth for the foreign-born population - Fiji (%)
Place of birth for the foreign-born population - Micronesia (%)
Place of birth for the foreign-born population - Bahamas (%)
Place of birth for the foreign-born population - Barbados (%)
Place of birth for the foreign-born population - Cuba (%)
Place of birth for the foreign-born population - Dominica (%)
Place of birth for the foreign-born population - Dominican Republic (%)
Place of birth for the foreign-born population - Grenada (%)
Place of birth for the foreign-born population - Haiti (%)
Place of birth for the foreign-born population - Jamaica (%)
Place of birth for the foreign-born population - St. Vincent and the Grenadines (%)
Place of birth for the foreign-born population - Trinidad and Tobago (%)
Place of birth for the foreign-born population - West Indies (%)
Place of birth for the foreign-born population - Other Caribbean (%)
Place of birth for the foreign-born population - Belize (%)
Place of birth for the foreign-born population - Costa Rica (%)
Place of birth for the foreign-born population - El Salvador (%)
Place of birth for the foreign-born population - Guatemala (%)
Place of birth for the foreign-born population - Honduras (%)
Place of birth for the foreign-born population - Mexico (%)
Place of birth for the foreign-born population - Nicaragua (%)
Place of birth for the foreign-born population - Panama (%)
Place of birth for the foreign-born population - Other Central America (%)
Place of birth for the foreign-born population - Argentina (%)
Place of birth for the foreign-born population - Bolivia (%)
Place of birth for the foreign-born population - Brazil (%)
Place of birth for the foreign-born population - Chile (%)
Place of birth for the foreign-born population - Colombia (%)
Place of birth for the foreign-born population - Ecuador (%)
Place of birth for the foreign-born population - Guyana (%)
Place of birth for the foreign-born population - Peru (%)
Place of birth for the foreign-born population - Uruguay (%)
Place of birth for the foreign-born population - Venezuela (%)
Place of birth for the foreign-born population - Other South America (%)
Place of birth for the foreign-born population - Canada (%)
Place of birth for the foreign-born population - Other Northern America (%)
Place of birth for the foreign-born population - Other (%)
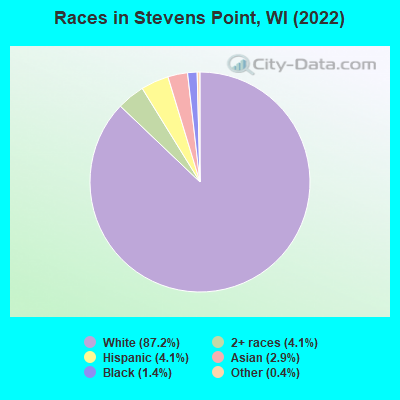
According to 2022 data, the most numerous races in Stevens Point, WI are White alone (22,422 residents), Hispanic (1,062 residents), and Black alone (372 residents). 94.5% of Stevens Point residents speak English at home. 4.4% of Stevens Point, WI residents are foreign-born (2.4% born in Asia, 1.2% born in Latin America), which is 13.8% less than the foreign-born rate of 5.0% across the entire state of Wisconsin.
Race distribution in Stevens Point
2000 2022
4,681,630 87.3% White alone 300,245 5.6% Black alone 192,921 3.6% Hispanic 87,995 1.6% Asian alone 51,921 1.0% Two or more races 43,980 0.8% American Indian alone 3,637 0.07% Other race alone 1,346 0.03% Native Hawaiian and Other
4,654,031 79.0% White alone 447,022 7.6% Hispanic 345,678 5.9% Black alone 217,532 3.7% Two or more races 172,242 2.9% Asian alone 33,762 0.6% American Indian alone 19,680 0.3% Other race alone 2,592 0.04% Native Hawaiian and Other
Income and house value in Stevens Point Median household income in 2022 $57,362 White non-Hispanic householders$47,445 Black householders$41,856 Some other race householders$50,025 Two or more races householders$39,121 Hispanic or Latino race householdersMedian 2022 house value $191,828 White Non-Hispanic householders$423,868 American Indian or Alaska Native householders $183,313 Asian householders$132,458 Two or more races householders$116,847 Hispanic or Latino householders
Median age by race in Stevens Point
29.5 Median age for White residents29.5 30.3 20.0 Median age for Black or African American residents18.1 17.6 43.9 Median age for American Indian / Alaska Native residents-704,819,276.4 43.5 28.3 Median age for Asian residents27.5 29.6 -666,666,666.0 Median age for Native Hawaiian / Pacific Islander residents-666,666,666.0 -666,666,666.0 28.6 Median age for Other race residents37.7 25.5 19.3 Median age for Two or more races residents19.5 17.1 29.5 Median age for White alone residents29.6 30.1 24.8 Median age for Hispanic or Latino residents20.9 22.1
Owner/renter occupied households by race in Stevens Point
House owners and renters - White residents 5,132 49.4% Owner occupied5,258 50.6% Renter occupiedHouse owners and renters - Black or African American residents 23 16.6% Owner occupied116 83.4% Renter occupiedHouse owners and renters - American Indian / Alaska Native residents 20 100.0% Renter occupiedHouse owners and renters - Asian residents 134 47.2% Owner occupied149 52.8% Renter occupiedHouse owners and renters - Other race residents 58 31.3% Owner occupied127 68.7% Renter occupiedHouse owners and renters - Two or more races residents 144 45.9% Owner occupied170 54.1% Renter occupiedHouse owners and renters - White alone residents 5,125 49.8% Owner occupied5,167 50.2% Renter occupiedHouse owners and renters - Hispanic or Latino residents 76 23.9% Owner occupied241 76.1% Renter occupied
Language usage in Stevens Point
English speakers - Total 94.5% of residents of Stevens Point speak English at home.
2.1% of residents speak Spanish at home 402 75.8% Speak English very well128 24.2% Speak English less than very well3.7% of residents speak other language at home 368 40.5% Speak English very well540 59.5% Speak English less than very well
English speakers - Born in the United States 96.3% of residents of Stevens Point speak English at home.
2.7% of residents speak Spanish at home 115 93.5% Speak English very well8 6.5% Speak English less than very well1.1% of residents speak other language at home 50 100.0% Speak English very well
English speakers - Native, born elsewhere 75.2% of residents of Stevens Point speak English at home.
4.1% of residents speak other language at home 6 100.0% Speak English very well
English speakers - Foreign-born 15.6% of residents of Stevens Point speak English at home.
24.6% of residents speak Spanish at home 60 27.6% Speak English very well157 72.4% Speak English less than very well62.2% of residents speak other language at home 175 31.9% Speak English very well374 68.1% Speak English less than very well
White (Caucasian) - Speak only English Native:
98.4% (21,425)Foreign-born:
89.0% (93)
White (Caucasian) - Speak another language Native:
1.6% (338)Foreign-born:
58.4% (61)
Black or African American - Speak only English Native:
100.0% (387)Foreign-born:
52.4% (12)
American Indian / Alaska Native - Speak only English Native:
94.8% (41)Foreign-born:
95.6% (28)
Asian - Speak only English Native:
31.3% (39)Foreign-born:
19.6% (101)
Asian - Speak another language Native:
75.6% (95)Foreign-born:
80.9% (418)
Other race - Speak another language Native:
13.0% (19)Foreign-born:
98.8% (234)
Two or more races - Speak only English Native:
87.0% (1,298)Foreign-born:
55.0% (42)
Two or more races - Speak another language Native:
7.9% (118)Foreign-born:
26.5% (20)
White alone - Speak only English Native:
98.6% (21,258)Foreign-born:
82.3% (91)
White alone - Speak another language Native:
1.3% (283)Foreign-born:
72.3% (80)
Hispanic or Latino - Speak only English Native:
77.9% (703)Foreign-born:
16.4% (32)
Hispanic or Latino - Speak another language Native:
21.1% (190)Foreign-born:
94.9% (186)
Foreign-born residents in Stevens Point 1,130 residents are foreign born (2.4% Asia , 1.2% Latin America ).
This city:
4.4%Wisconsin:
5.0%
Marital status for residents in Stevens Point Marital status - White (Caucasian) population 15 years and over
Males 56.5% Never married31.2% Now married0.2% Separated2.0% Widowed10.1% DivorcedFemales 48.1% Never married31.5% Now married0.8% Separated8.5% Widowed11.2% DivorcedWomen who gave birth in the past 12 months Now married:
72.4% (150)Unmarried:
27.6% (57)
Women who did not give birth in the past 12 months Now married:
25.1% (1,697)Unmarried:
74.9% (5,059)
Marital status - Black or African American population 15 years and over
Males 84.8% Never married15.2% Now married0.0% Separated0.0% Widowed0.0% DivorcedFemales 73.0% Never married24.3% Now married0.0% Separated2.7% Widowed0.0% DivorcedWomen who did not give birth in the past 12 months Now married:
30.3% (35)Unmarried:
69.7% (80)
Marital status - Asian population 15 years and over
Males 25.0% Never married65.4% Now married0.0% Separated5.8% Widowed3.8% DivorcedFemales 36.2% Never married59.0% Now married0.0% Separated4.9% Widowed0.0% DivorcedWomen who gave birth in the past 12 months Now married:
100.0% (6)Unmarried:
0.0% (0)
Women who did not give birth in the past 12 months Now married:
56.4% (162)Unmarried:
43.6% (125)
Marital status - Other race population 15 years and over
Males 85.6% Never married14.4% Now married0.0% Separated0.0% Widowed0.0% DivorcedFemales 92.0% Never married8.0% Now married0.0% Separated0.0% Widowed0.0% DivorcedWomen who did not give birth in the past 12 months Now married:
0.0% (0)Unmarried:
100.0% (125)
Marital status - Two or more races population 15 years and over
Males 84.4% Never married14.1% Now married0.0% Separated0.0% Widowed1.5% DivorcedFemales 66.9% Never married14.2% Now married0.0% Separated12.3% Widowed6.6% DivorcedWomen who did not give birth in the past 12 months Now married:
16.2% (57)Unmarried:
83.8% (293)
Marital status - White alone, not Hispanic / Latino population 15 years and over
Males 56.1% Never married31.5% Now married0.2% Separated2.0% Widowed10.2% DivorcedFemales 47.9% Never married31.5% Now married0.8% Separated8.6% Widowed11.2% DivorcedWomen who gave birth in the past 12 months Now married:
72.4% (150)Unmarried:
27.6% (57)
Women who did not give birth in the past 12 months Now married:
25.0% (1,662)Unmarried:
75.0% (4,994)
Marital status - Hispanic or Latino population 15 years and over
Males 78.7% Never married21.3% Now married0.0% Separated0.0% Widowed0.0% DivorcedFemales 83.5% Never married13.7% Now married0.0% Separated0.3% Widowed2.5% DivorcedWomen who did not give birth in the past 12 months Now married:
11.3% (42)Unmarried:
88.7% (327)
Ancestries in Stevens Point
2,956 26.5% German2,333 20.9% Polish1,222 11.0% American492 4.4% Irish476 4.3% European347 3.1% English257 2.3% Norwegian219 2.0% Italian171 1.5% Swedish99 0.9% Czech62 0.6% French Canadian50 0.4% Finnish43 0.4% Dutch41 0.4% Lebanese39 0.3% British39 0.3% Eastern European38 0.3% French37 0.3% Lithuanian35 0.3% Russian30 0.3% Belgian28 0.3% Hungarian20 0.2% Swiss11 0.10% Romanian10 0.09% Scandinavian9 0.08% Bulgarian8 0.07% Danish8 0.07% Slovene8 0.07% Ghanaian6 0.05% Ukrainian3 0.03% Palestinian2 0.02% Arab1 0.01% Luxembourger
Geographical mobility in Stevens Point Same house 1 year ago 17,110 76.0% White (Caucasian)324 79.5% Black or African American44 65.9% American Indian / Alaska Native653 75.1% Asian246 64.5% Other race1,242 76.1% Two or more races16,923 75.9% White alone, not Hispanic / Latino802 79.3% Hispanic or LatinoMoved within same county 2,403 10.7% White / Caucasian49 12.0% Black or African American20 30.9% American Indian / Alaska Native122 14.0% Asian9 2.4% Other race64 3.9% Two or more races2,424 10.9% White alone, not Hispanic / Latino72 7.1% Hispanic or LatinoMoved within same state 2,421 10.7% White / Caucasian33 8.2% Black or African American1 1.4% American Indian / Alaska Native37 4.2% Asian22 5.8% Other race234 14.3% Two or more races2,353 10.6% White alone, not Hispanic / Latino96 9.5% Hispanic or LatinoMoved from different state 218 1.0% White / Caucasian15 1.7% Asian58 3.6% Two or more races218 1.0% White alone, not Hispanic / Latino32 3.1% Hispanic or LatinoMoved from abroad 100 0.4% White31 3.6% Asian196 51.4% Other race107 0.5% White alone, not Hispanic / Latino
Children Nativity (place of birth) in Stevens Point
Children under 6 years - Living with two parents Both parents native 695 100.0% NativeBoth parents foreign-born 78 63.2% Native45 36.8% Foreign-bornOne native, one foreign-born parent 15 100.0% NativeChildren under 6 years - Living with one parent Native parent 250 100.0% NativeChildren 6 to 17 years - Living with two parents Both parents native 1,302 100.0% NativeBoth parents foreign-born 97 54.6% Native81 45.4% Foreign-bornOne native, one foreign-born parent 8 100.0% NativeChildren 6 to 17 years - Living with one parent Native parent 991 99.4% Native6 0.6% Foreign-bornForeign-born parent 8 100.0% Native
Grandparents responsible for own grandchildren in Stevens Point
Grandparents (30 to 59 years) White / Caucasian 5 19.9% Responsible for grandchildren20 80.1% Not responsible for grandchildrenAsian 6 100.0% Not responsible for grandchildrenWhite alone, not Hispanic / Latino 5 20.0% Responsible for grandchildren21 80.0% Not responsible for grandchildren
Grandparents (60 years and over) White / Caucasian 54 100.0% Not responsible for grandchildrenAsian 8 100.0% Not responsible for grandchildrenWhite alone, not Hispanic / Latino 57 100.0% Not responsible for grandchildren