Races in Stockbridge, Georgia (GA) Detailed Stats
Data:
Races - White alone (%)
Races - White alone (% change since 2000)
Races - Black alone (%)
Races - Black alone (% change since 2000)
Races - American Indian alone (%)
Races - American Indian alone (% change since 2000)
Races - Asian alone (%)
Races - Asian alone (% change since 2000)
Races - Hispanic (%)
Races - Hispanic (% change since 2000)
Races - Native Hawaiian and Other Pacific Islander alone (%)
Races - Native Hawaiian and Other Pacific Islander alone (% change since 2000)
Races - Two or more races(%)
Races - Two or more races(% change since 2000)
Races - Other race alone (%)
Races - Other race alone (% change since 2000)
Racial diversity
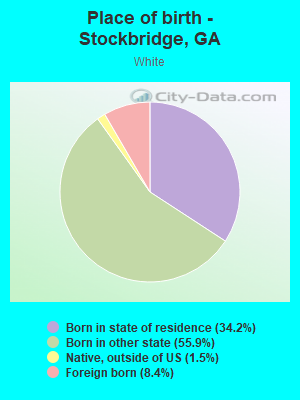
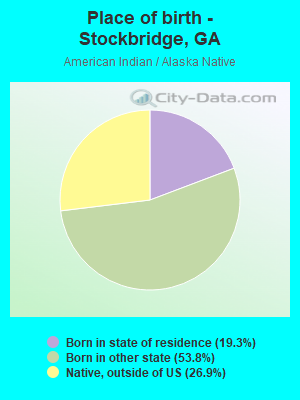
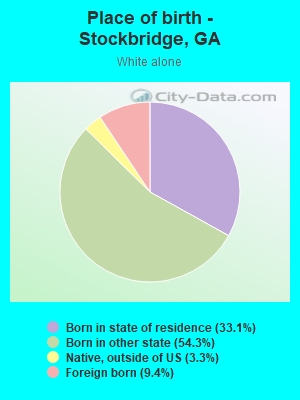
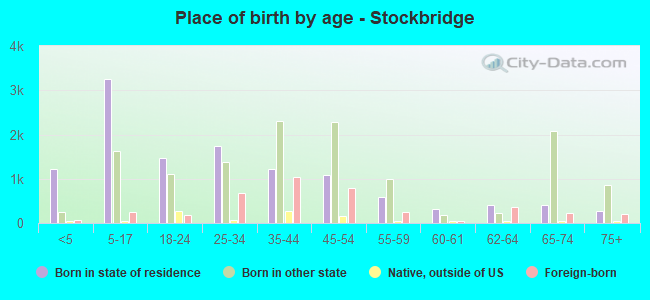
Place of birth - Born in state of residence (%)
Place of birth - Born in state of residence (%) - White
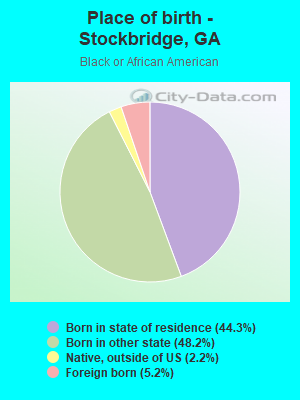
Place of birth - Born in state of residence (%) - Black or African American
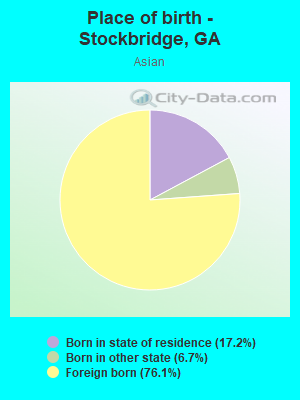
Place of birth - Born in state of residence (%) - Asian
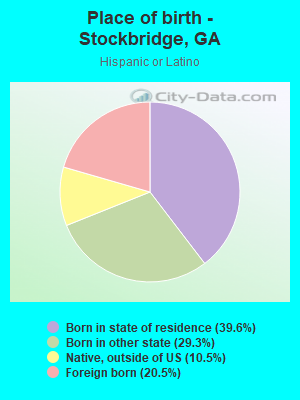
Place of birth - Born in state of residence (%) - Hispanic or Latino
Place of birth - Born in state of residence (%) - American Indian and Alaska Native
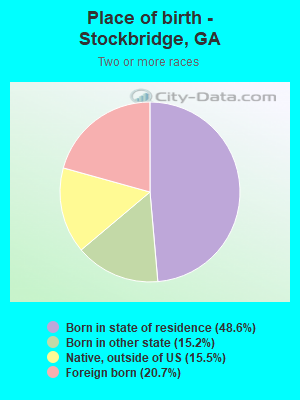
Place of birth - Born in state of residence (%) - Multirace
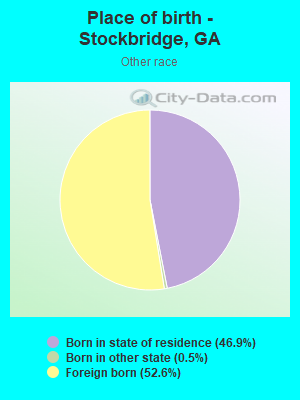
Place of birth - Born in state of residence (%) - Other Race
Place of birth - Born in other state (%)
Place of birth - Born in other state (%) - White
Place of birth - Born in other state (%) - Black or African American
Place of birth - Born in other state (%) - Asian
Place of birth - Born in other state (%) - Hispanic or Latino
Place of birth - Born in other state (%) - American Indian and Alaska Native
Place of birth - Born in other state (%) - Multirace
Place of birth - Born in other state (%) - Other Race
Place of birth - Native, outside of US (%)
Place of birth - Native, outside of US (%) - White
Place of birth - Native, outside of US (%) - Black or African American
Place of birth - Native, outside of US (%) - Asian
Place of birth - Native, outside of US (%) - Hispanic or Latino
Place of birth - Native, outside of US (%) - American Indian and Alaska Native
Place of birth - Native, outside of US (%) - Multirace
Place of birth - Native, outside of US (%) - Other Race
Place of birth - Foreign born (%)
Place of birth - Foreign born (%) - White
Place of birth - Foreign born (%) - Black or African American
Place of birth - Foreign born (%) - Asian
Place of birth - Foreign born (%) - Hispanic or Latino
Place of birth - Foreign born (%) - American Indian and Alaska Native
Place of birth - Foreign born (%) - Multirace
Place of birth - Foreign born (%) - Other Race
Residents speaking English at home (%)
Residents speaking English at home - Born in the United States (%)
Residents speaking English at home - Native, born elsewhere (%)
Residents speaking English at home - Foreign born (%)
Residents speaking Spanish at home (%)
Residents speaking Spanish at home - Born in the United States (%)
Residents speaking Spanish at home - Native, born elsewhere (%)
Residents speaking Spanish at home - Foreign born (%)
Residents speaking other language at home (%)
Residents speaking other language at home - Born in the United States (%)
Residents speaking other language at home - Native, born elsewhere (%)
Residents speaking other language at home - Foreign born (%)
Marital status - Never married (%)
Marital status - Now married (%)
Marital status - Separated (%)
Marital status - Widowed (%)
Marital status - Divorced (%)
Ancestries Reported - Arab (%)
Ancestries Reported - Czech (%)
Ancestries Reported - Danish (%)
Ancestries Reported - Dutch (%)
Ancestries Reported - English (%)
Ancestries Reported - French (%)
Ancestries Reported - French Canadian (%)
Ancestries Reported - German (%)
Ancestries Reported - Greek (%)
Ancestries Reported - Hungarian (%)
Ancestries Reported - Irish (%)
Ancestries Reported - Italian (%)
Ancestries Reported - Lithuanian (%)
Ancestries Reported - Norwegian (%)
Ancestries Reported - Polish (%)
Ancestries Reported - Portuguese (%)
Ancestries Reported - Russian (%)
Ancestries Reported - Scotch-Irish (%)
Ancestries Reported - Scottish (%)
Ancestries Reported - Slovak (%)
Ancestries Reported - Subsaharan African (%)
Ancestries Reported - Swedish (%)
Ancestries Reported - Swiss (%)
Ancestries Reported - Ukrainian (%)
Ancestries Reported - United States (%)
Ancestries Reported - Welsh (%)
Ancestries Reported - West Indian (%)
Ancestries Reported - Other (%)
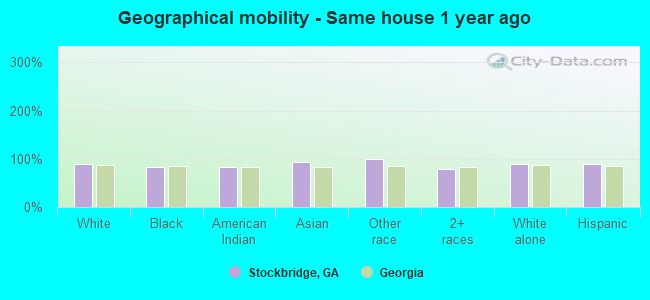
Geographical mobility - Same house 1 year ago (%)
Geographical mobility - Same house 1 year ago (%) - White
Geographical mobility - Same house 1 year ago (%) - Black or African American
Geographical mobility - Same house 1 year ago (%) - Asian
Geographical mobility - Same house 1 year ago (%) - Hispanic or Latino
Geographical mobility - Same house 1 year ago (%) - American Indian and Alaska Native
Geographical mobility - Same house 1 year ago (%) - Multirace
Geographical mobility - Same house 1 year ago (%) - Other Race
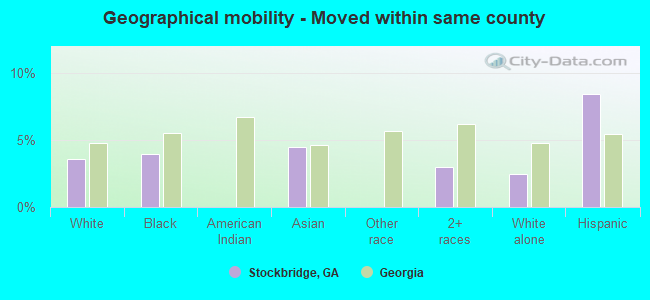
Geographical mobility - Moved within same county (%)
Geographical mobility - Moved within same county (%) - White
Geographical mobility - Moved within same county (%) - Black or African American
Geographical mobility - Moved within same county (%) - Asian
Geographical mobility - Moved within same county (%) - Hispanic or Latino
Geographical mobility - Moved within same county (%) - American Indian and Alaska Native
Geographical mobility - Moved within same county (%) - Multirace
Geographical mobility - Moved within same county (%) - Other Race
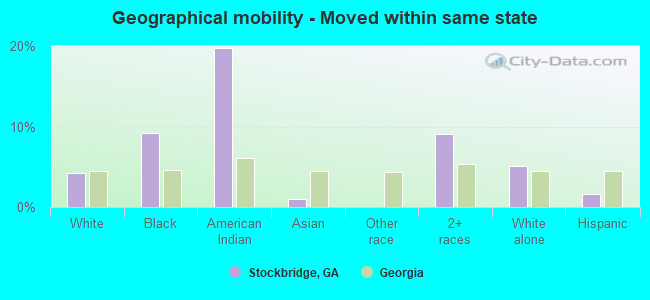
Geographical mobility - Moved from different county within same state (%)
Geographical mobility - Moved from different county within same state (%) - White
Geographical mobility - Moved from different county within same state (%) - Black or African American
Geographical mobility - Moved from different county within same state (%) - Asian
Geographical mobility - Moved from different county within same state (%) - Hispanic or Latino
Geographical mobility - Moved from different county within same state (%) - American Indian and Alaska Native
Geographical mobility - Moved from different county within same state (%) - Multirace
Geographical mobility - Moved from different county within same state (%) - Other Race
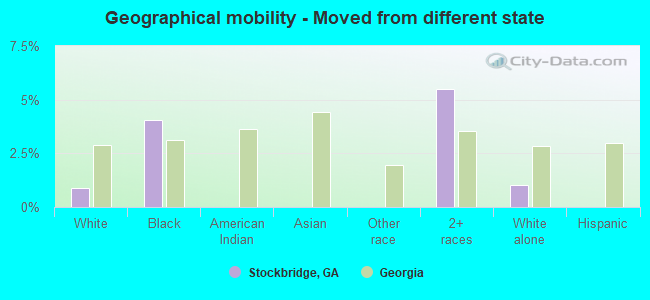
Geographical mobility - Moved from different state (%)
Geographical mobility - Moved from different state (%) - White
Geographical mobility - Moved from different state (%) - Black or African American
Geographical mobility - Moved from different state (%) - Asian
Geographical mobility - Moved from different state (%) - Hispanic or Latino
Geographical mobility - Moved from different state (%) - American Indian and Alaska Native
Geographical mobility - Moved from different state (%) - Multirace
Geographical mobility - Moved from different state (%) - Other Race
Geographical mobility - Moved from abroad (%)
Geographical mobility - Moved from abroad (%) - White
Geographical mobility - Moved from abroad (%) - Black or African American
Geographical mobility - Moved from abroad (%) - Asian
Geographical mobility - Moved from abroad (%) - Hispanic or Latino
Geographical mobility - Moved from abroad (%) - American Indian and Alaska Native
Geographical mobility - Moved from abroad (%) - Multirace
Geographical mobility - Moved from abroad (%) - Other Race
Place of birth for the foreign-born population - Ireland (%)
Place of birth for the foreign-born population - Denmark (%)
Place of birth for the foreign-born population - Norway (%)
Place of birth for the foreign-born population - Sweden (%)
Place of birth for the foreign-born population - United Kingdom (%)
Place of birth for the foreign-born population - England (%)
Place of birth for the foreign-born population - Scotland (%)
Place of birth for the foreign-born population - Other Northern Europe (%)
Place of birth for the foreign-born population - Austria (%)
Place of birth for the foreign-born population - Belgium (%)
Place of birth for the foreign-born population - France (%)
Place of birth for the foreign-born population - Germany (%)
Place of birth for the foreign-born population - Netherlands (%)
Place of birth for the foreign-born population - Switzerland (%)
Place of birth for the foreign-born population - Other Western Europe (%)
Place of birth for the foreign-born population - Greece (%)
Place of birth for the foreign-born population - Italy (%)
Place of birth for the foreign-born population - Portugal (%)
Place of birth for the foreign-born population - Spain (%)
Place of birth for the foreign-born population - Other Southern Europe (%)
Place of birth for the foreign-born population - Albania (%)
Place of birth for the foreign-born population - Belarus (%)
Place of birth for the foreign-born population - Bosnia and Herzegovina (%)
Place of birth for the foreign-born population - Bulgaria (%)
Place of birth for the foreign-born population - Croatia (%)
Place of birth for the foreign-born population - Czechoslovakia (%)
Place of birth for the foreign-born population - Hungary (%)
Place of birth for the foreign-born population - Latvia (%)
Place of birth for the foreign-born population - Lithuania (%)
Place of birth for the foreign-born population - North Macedonia (Macedonia) (%)
Place of birth for the foreign-born population - Moldova (%)
Place of birth for the foreign-born population - Poland (%)
Place of birth for the foreign-born population - Romania (%)
Place of birth for the foreign-born population - Russia (%)
Place of birth for the foreign-born population - Serbia (%)
Place of birth for the foreign-born population - Ukraine (%)
Place of birth for the foreign-born population - Other Eastern Europe (%)
Place of birth for the foreign-born population - China (%)
Place of birth for the foreign-born population - Hong Kong (%)
Place of birth for the foreign-born population - Taiwan (%)
Place of birth for the foreign-born population - Japan (%)
Place of birth for the foreign-born population - Korea (%)
Place of birth for the foreign-born population - Other Eastern Asia (%)
Place of birth for the foreign-born population - Afghanistan (%)
Place of birth for the foreign-born population - Bangladesh (%)
Place of birth for the foreign-born population - India (%)
Place of birth for the foreign-born population - Iran (%)
Place of birth for the foreign-born population - Kazakhstan (%)
Place of birth for the foreign-born population - Nepal (%)
Place of birth for the foreign-born population - Pakistan (%)
Place of birth for the foreign-born population - Sri Lanka (%)
Place of birth for the foreign-born population - Uzbekistan (%)
Place of birth for the foreign-born population - Other South Central Asia (%)
Place of birth for the foreign-born population - Burma (%)
Place of birth for the foreign-born population - Cambodia (%)
Place of birth for the foreign-born population - Indonesia (%)
Place of birth for the foreign-born population - Laos (%)
Place of birth for the foreign-born population - Malaysia (%)
Place of birth for the foreign-born population - Philippines (%)
Place of birth for the foreign-born population - Singapore (%)
Place of birth for the foreign-born population - Thailand (%)
Place of birth for the foreign-born population - Vietnam (%)
Place of birth for the foreign-born population - Other South Eastern Asia (%)
Place of birth for the foreign-born population - Armenia (%)
Place of birth for the foreign-born population - Iraq (%)
Place of birth for the foreign-born population - Israel (%)
Place of birth for the foreign-born population - Jordan (%)
Place of birth for the foreign-born population - Kuwait (%)
Place of birth for the foreign-born population - Lebanon (%)
Place of birth for the foreign-born population - Saudi Arabia (%)
Place of birth for the foreign-born population - Syria (%)
Place of birth for the foreign-born population - Turkey (%)
Place of birth for the foreign-born population - Yemen (%)
Place of birth for the foreign-born population - Other Western Asia (%)
Place of birth for the foreign-born population - Eritrea (%)
Place of birth for the foreign-born population - Ethiopia (%)
Place of birth for the foreign-born population - Kenya (%)
Place of birth for the foreign-born population - Somalia (%)
Place of birth for the foreign-born population - Uganda (%)
Place of birth for the foreign-born population - Zimbabwe (%)
Place of birth for the foreign-born population - Other Eastern Africa (%)
Place of birth for the foreign-born population - Cameroon (%)
Place of birth for the foreign-born population - Congo (%)
Place of birth for the foreign-born population - Democratic Republic of Congo (Zaire) (%)
Place of birth for the foreign-born population - Other Middle Africa (%)
Place of birth for the foreign-born population - Egypt (%)
Place of birth for the foreign-born population - Morocco (%)
Place of birth for the foreign-born population - Sudan (%)
Place of birth for the foreign-born population - Other Northern Africa (%)
Place of birth for the foreign-born population - South Africa (%)
Place of birth for the foreign-born population - Other Southern Africa (%)
Place of birth for the foreign-born population - Cabo Verde (%)
Place of birth for the foreign-born population - Ghana (%)
Place of birth for the foreign-born population - Liberia (%)
Place of birth for the foreign-born population - Nigeria (%)
Place of birth for the foreign-born population - Senegal (%)
Place of birth for the foreign-born population - Sierra Leone (%)
Place of birth for the foreign-born population - Other Western Africa (%)
Place of birth for the foreign-born population - Australia (%)
Place of birth for the foreign-born population - New Zealand (%)
Place of birth for the foreign-born population - Fiji (%)
Place of birth for the foreign-born population - Micronesia (%)
Place of birth for the foreign-born population - Bahamas (%)
Place of birth for the foreign-born population - Barbados (%)
Place of birth for the foreign-born population - Cuba (%)
Place of birth for the foreign-born population - Dominica (%)
Place of birth for the foreign-born population - Dominican Republic (%)
Place of birth for the foreign-born population - Grenada (%)
Place of birth for the foreign-born population - Haiti (%)
Place of birth for the foreign-born population - Jamaica (%)
Place of birth for the foreign-born population - St. Vincent and the Grenadines (%)
Place of birth for the foreign-born population - Trinidad and Tobago (%)
Place of birth for the foreign-born population - West Indies (%)
Place of birth for the foreign-born population - Other Caribbean (%)
Place of birth for the foreign-born population - Belize (%)
Place of birth for the foreign-born population - Costa Rica (%)
Place of birth for the foreign-born population - El Salvador (%)
Place of birth for the foreign-born population - Guatemala (%)
Place of birth for the foreign-born population - Honduras (%)
Place of birth for the foreign-born population - Mexico (%)
Place of birth for the foreign-born population - Nicaragua (%)
Place of birth for the foreign-born population - Panama (%)
Place of birth for the foreign-born population - Other Central America (%)
Place of birth for the foreign-born population - Argentina (%)
Place of birth for the foreign-born population - Bolivia (%)
Place of birth for the foreign-born population - Brazil (%)
Place of birth for the foreign-born population - Chile (%)
Place of birth for the foreign-born population - Colombia (%)
Place of birth for the foreign-born population - Ecuador (%)
Place of birth for the foreign-born population - Guyana (%)
Place of birth for the foreign-born population - Peru (%)
Place of birth for the foreign-born population - Uruguay (%)
Place of birth for the foreign-born population - Venezuela (%)
Place of birth for the foreign-born population - Other South America (%)
Place of birth for the foreign-born population - Canada (%)
Place of birth for the foreign-born population - Other Northern America (%)
Place of birth for the foreign-born population - Other (%)
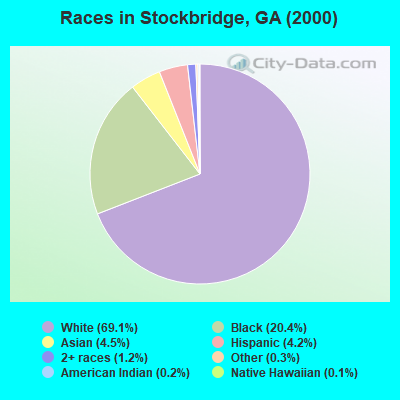
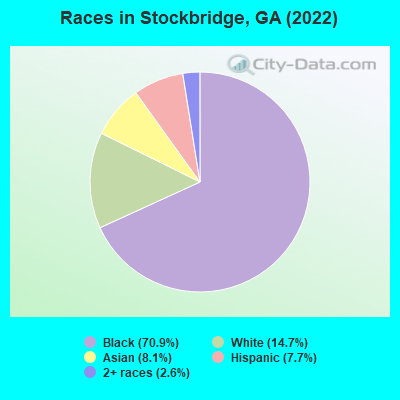
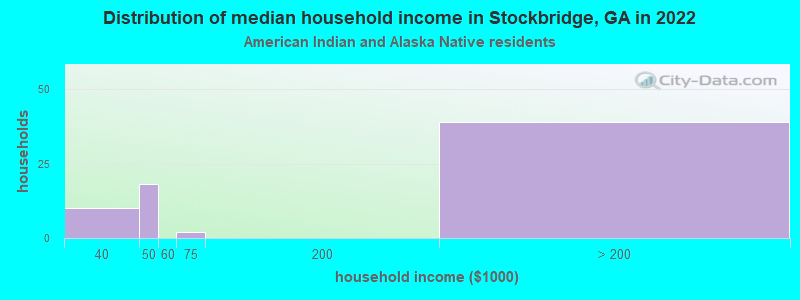
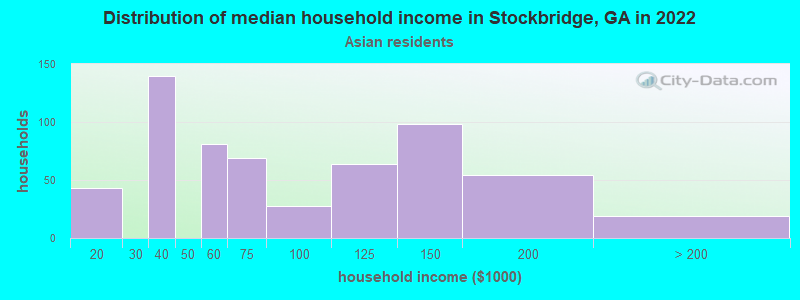
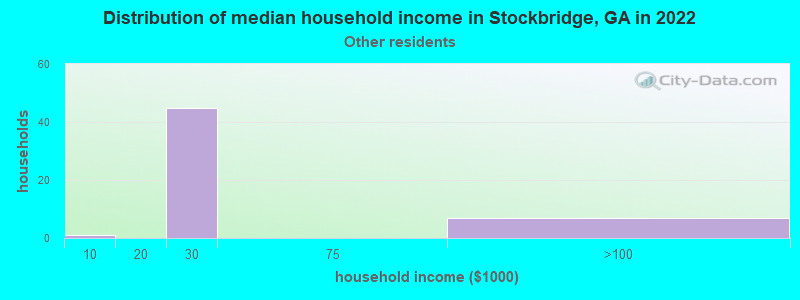
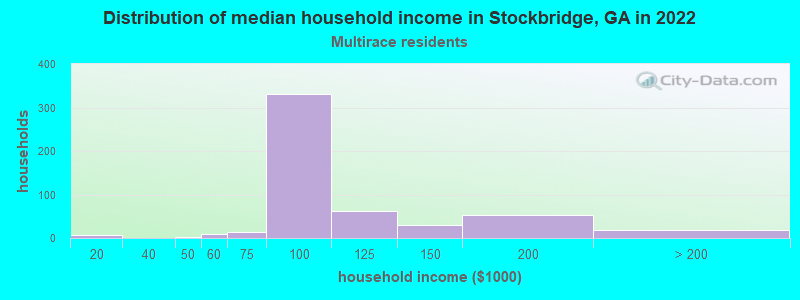
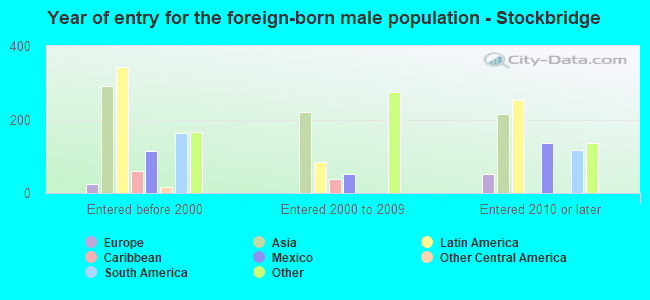
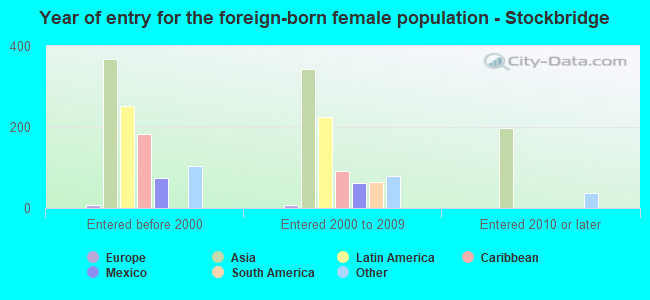
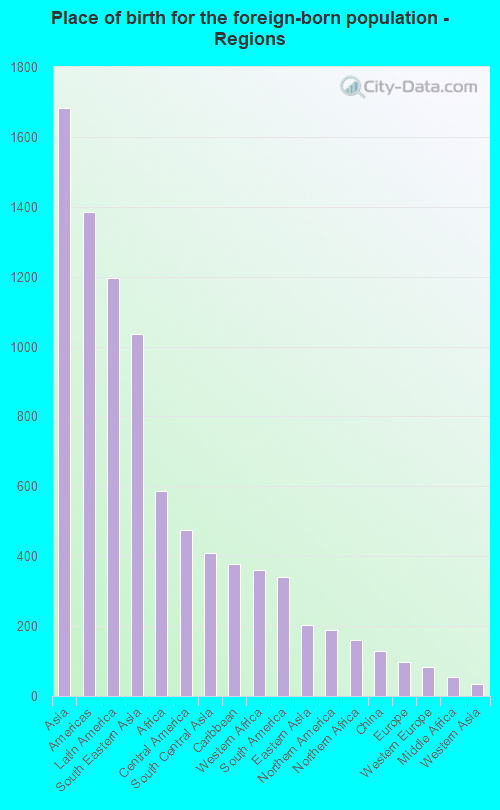
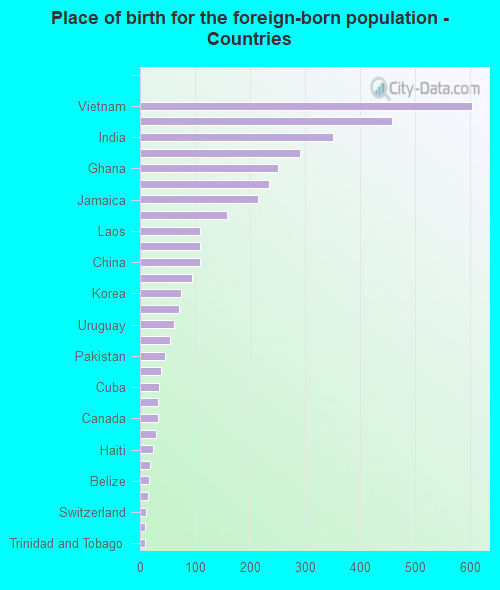
According to 2022 data, the most numerous races in Stockbridge, GA are White alone (4,381 residents), Black alone (21,095 residents), and Hispanic (2,298 residents). 83.8% of Stockbridge residents speak English at home. 12.6% of Stockbridge, GA residents are foreign-born (5.6% born in Asia, 4.0% born in Latin America, 1.9% born in Africa), which is 20.7% greater than the foreign-born rate of 10.0% across the entire state of Georgia.
Race distribution in Stockbridge
2000 2022
5,128,661 62.6% White alone 2,331,465 28.5% Black alone 435,227 5.3% Hispanic 171,513 2.1% Asian alone 87,364 1.1% Two or more races 17,670 0.2% American Indian alone 11,275 0.1% Other race alone 3,278 0.04% Native Hawaiian and Other
5,415,657 49.6% White alone 3,349,240 30.7% Black alone 1,132,604 10.4% Hispanic 479,156 4.4% Asian alone 462,923 4.2% Two or more races 54,416 0.5% Other race alone 11,923 0.1% American Indian alone 6,957 0.06% Native Hawaiian and Other
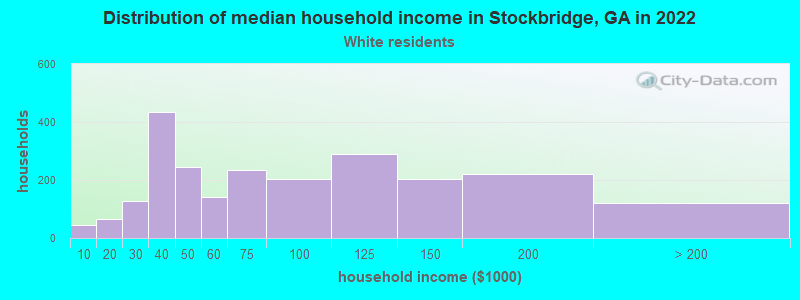
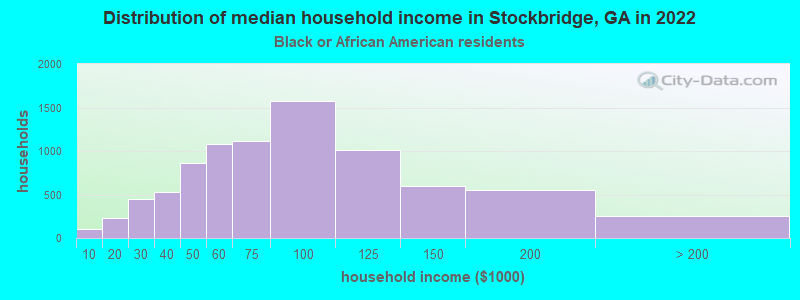
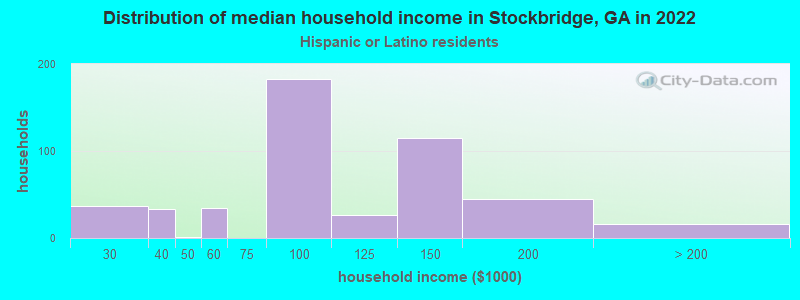
Income and house value in Stockbridge Median household income in 2022 $66,034 White non-Hispanic householders$71,728 Black householders$84,484 Asian householders$26,119 Some other race householders$90,925 Two or more races householders$92,762 Hispanic or Latino race householdersMedian 2022 house value $284,722 White Non-Hispanic householders$328,086 Black or African American householders $538,633 Asian householders$392,277 Some other race householders$347,772 Two or more races householders$303,266 Hispanic or Latino householders
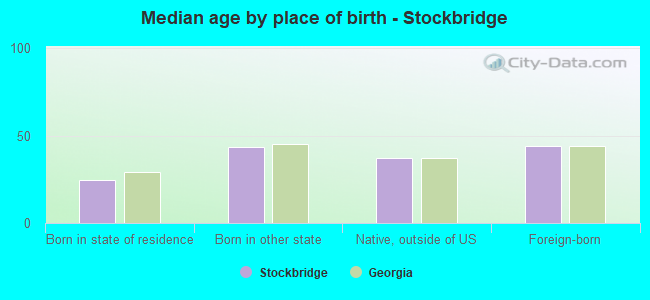
Median age by race in Stockbridge
42.0 Median age for White residents49.0 39.7 36.9 Median age for Black or African American residents32.8 39.9 52.8 Median age for American Indian / Alaska Native residents-545,119,704.8 41.6 38.2 Median age for Asian residents33.2 42.4 -657,243,815.6 Median age for Native Hawaiian / Pacific Islander residents-666,666,666.0 -662,857,142.2 3.6 Median age for Other race residents4.5 -485,540,334.4 21.9 Median age for Two or more races residents25.1 21.3 45.9 Median age for White alone residents52.2 40.8 21.9 Median age for Hispanic or Latino residents21.8 19.1
Owner/renter occupied households by race in Stockbridge
House owners and renters - White residents 1,407 64.6% Owner occupied771 35.4% Renter occupiedHouse owners and renters - Black or African American residents 3,977 47.6% Owner occupied4,384 52.4% Renter occupiedHouse owners and renters - American Indian / Alaska Native residents 53 79.4% Owner occupied14 20.6% Renter occupiedHouse owners and renters - Asian residents 547 91.0% Owner occupied54 9.0% Renter occupiedHouse owners and renters - Other race residents 8 20.2% Owner occupied31 79.8% Renter occupiedHouse owners and renters - Two or more races residents 444 89.8% Owner occupied50 10.2% Renter occupiedHouse owners and renters - White alone residents 1,276 63.7% Owner occupied726 36.3% Renter occupiedHouse owners and renters - Hispanic or Latino residents 407 68.5% Owner occupied187 31.5% Renter occupied
Language usage in Stockbridge
English speakers - Total 83.8% of residents of Stockbridge speak English at home.
5.9% of residents speak Spanish at home 1,183 71.5% Speak English very well471 28.5% Speak English less than very well11.0% of residents speak other language at home 1,682 54.6% Speak English very well1,401 45.4% Speak English less than very well
English speakers - Born in the United States 93.9% of residents of Stockbridge speak English at home.
3.2% of residents speak Spanish at home 341 83.6% Speak English very well67 16.4% Speak English less than very well1.6% of residents speak other language at home 169 84.5% Speak English very well31 15.5% Speak English less than very well
English speakers - Native, born elsewhere 34.2% of residents of Stockbridge speak English at home.
43.8% of residents speak Spanish at home 181 57.3% Speak English very well135 42.7% Speak English less than very well25.2% of residents speak other language at home 182 100.0% Speak English less than very well
English speakers - Foreign-born 31.7% of residents of Stockbridge speak English at home.
11.7% of residents speak Spanish at home 219 47.0% Speak English very well247 53.0% Speak English less than very well57.4% of residents speak other language at home 956 41.7% Speak English very well1,336 58.3% Speak English less than very well
White (Caucasian) - Speak only English Native:
86.5% (3,906)Foreign-born:
18.1% (76)
White (Caucasian) - Speak another language Native:
12.7% (575)Foreign-born:
79.3% (334)
Black or African American - Speak only English Native:
98.2% (18,619)Foreign-born:
73.0% (786)
Black or African American - Speak another language Native:
1.7% (318)Foreign-born:
26.3% (284)
Asian - Speak only English Native:
34.9% (184)Foreign-born:
12.4% (230)
Asian - Speak another language Native:
60.6% (319)Foreign-born:
86.5% (1,607)
Other race - Speak another language Native:
100.0% (1)Foreign-born:
100.0% (51)
Two or more races - Speak only English Native:
52.0% (722)Foreign-born:
37.3% (162)
Two or more races - Speak another language Native:
32.8% (456)Foreign-born:
59.7% (259)
White alone - Speak only English Native:
95.1% (3,736)Foreign-born:
10.6% (44)
White alone - Speak another language Native:
6.5% (254)Foreign-born:
100.0% (416)
Hispanic or Latino - Speak only English Native:
41.5% (657)Foreign-born:
4.1% (19)
Hispanic or Latino - Speak another language Native:
55.8% (882)Foreign-born:
95.3% (449)
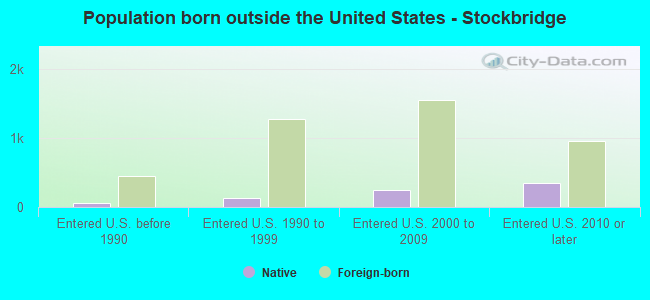
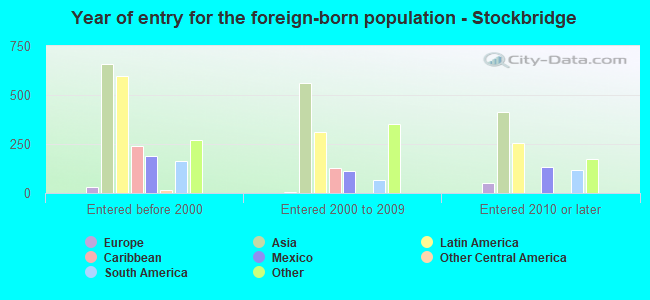
Foreign-born residents in Stockbridge 3,753 residents are foreign born (5.6% Asia , 4.0% Latin America , 1.9% Africa ).
This city:
12.6%Georgia:
10.4%
Marital status for residents in Stockbridge Marital status - White (Caucasian) population 15 years and over
Males 30.6% Never married55.5% Now married0.5% Separated2.7% Widowed10.8% DivorcedFemales 44.7% Never married36.6% Now married2.7% Separated9.1% Widowed6.8% DivorcedWomen who gave birth in the past 12 months Now married:
0.0% (0)Unmarried:
100.0% (10)
Women who did not give birth in the past 12 months Now married:
31.1% (513)Unmarried:
68.9% (1,134)
Marital status - Black or African American population 15 years and over
Males 48.9% Never married42.2% Now married0.3% Separated1.7% Widowed6.8% DivorcedFemales 46.5% Never married29.9% Now married1.5% Separated4.1% Widowed18.0% DivorcedWomen who gave birth in the past 12 months Now married:
72.7% (383)Unmarried:
27.3% (144)
Women who did not give birth in the past 12 months Now married:
26.0% (1,423)Unmarried:
74.0% (4,053)
Marital status - American Indian / Alaska Native population 15 years and over
Males 0.0% Never married0.0% Now married0.0% Separated0.0% Widowed100.0% DivorcedFemales 4.2% Never married60.4% Now married0.0% Separated35.4% Widowed0.0% DivorcedWomen who gave birth in the past 12 months Now married:
100.0% (24)Unmarried:
0.0% (0)
Women who did not give birth in the past 12 months Now married:
0.0% (0)Unmarried:
100.0% (3)
Marital status - Asian population 15 years and over
Males 40.1% Never married50.9% Now married4.0% Separated3.7% Widowed1.2% DivorcedFemales 28.1% Never married40.4% Now married4.4% Separated7.0% Widowed20.0% DivorcedWomen who gave birth in the past 12 months Now married:
100.0% (3)Unmarried:
0.0% (0)
Women who did not give birth in the past 12 months Now married:
43.8% (219)Unmarried:
56.2% (281)
Marital status - Other race population 15 years and over
Males 0.0% Never married0.0% Now married0.0% Separated0.0% Widowed100.0% DivorcedFemales 0.0% Never married0.0% Now married0.0% Separated0.0% Widowed100.0% DivorcedWomen who gave birth in the past 12 months Now married:
0.0% (0)Unmarried:
100.0% (1)
Women who did not give birth in the past 12 months Now married:
0.0% (0)Unmarried:
100.0% (6)
Marital status - Two or more races population 15 years and over
Males 46.2% Never married41.2% Now married3.1% Separated9.6% Widowed0.0% DivorcedFemales 52.9% Never married33.3% Now married11.1% Separated0.0% Widowed2.8% DivorcedWomen who did not give birth in the past 12 months Now married:
42.0% (253)Unmarried:
58.0% (349)
Marital status - White alone, not Hispanic / Latino population 15 years and over
Males 27.4% Never married56.1% Now married0.6% Separated3.2% Widowed12.8% DivorcedFemales 41.5% Never married37.6% Now married1.5% Separated11.1% Widowed8.3% DivorcedWomen who gave birth in the past 12 months Now married:
0.0% (0)Unmarried:
100.0% (10)
Women who did not give birth in the past 12 months Now married:
33.4% (456)Unmarried:
66.6% (910)
Marital status - Hispanic or Latino population 15 years and over
Males 51.2% Never married40.6% Now married2.8% Separated0.1% Widowed5.2% DivorcedFemales 49.3% Never married43.9% Now married6.1% Separated0.0% Widowed0.8% DivorcedWomen who gave birth in the past 12 months Now married:
0.0% (0)Unmarried:
100.0% (1)
Women who did not give birth in the past 12 months Now married:
37.6% (247)Unmarried:
62.4% (411)
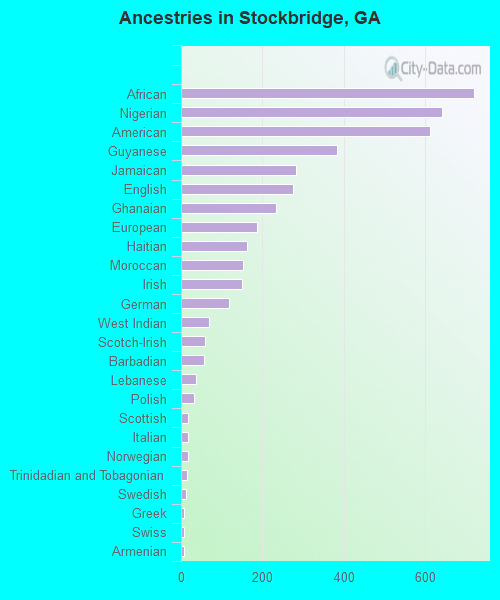
Ancestries in Stockbridge
720 3.4% African640 3.0% Nigerian612 2.9% American383 1.8% Guyanese283 1.3% Jamaican274 1.3% English234 1.1% Ghanaian186 0.9% European163 0.8% Haitian152 0.7% Moroccan150 0.7% Irish119 0.6% German69 0.3% West Indian60 0.3% Scotch-Irish57 0.3% Barbadian37 0.2% Lebanese32 0.2% Polish17 0.08% Scottish16 0.08% Italian16 0.08% Norwegian15 0.07% Trinidadian and Tobagonian13 0.06% Swedish8 0.04% Greek8 0.04% Swiss7 0.03% Armenian
Geographical mobility in Stockbridge Same house 1 year ago 4,632 90.0% White (Caucasian)17,269 81.5% Black or African American69 83.8% American Indian / Alaska Native2,087 93.5% Asian128 99.7% Other race1,539 77.9% Two or more races3,905 89.6% White alone, not Hispanic / Latino2,050 89.5% Hispanic or LatinoMoved within same county 185 3.6% White / Caucasian841 4.0% Black or African American99 4.4% Asian59 3.0% Two or more races106 2.4% White alone, not Hispanic / Latino193 8.4% Hispanic or LatinoMoved within same state 218 4.2% White / Caucasian1,952 9.2% Black or African American16 19.7% American Indian / Alaska Native22 1.0% Asian178 9.0% Two or more races223 5.1% White alone, not Hispanic / Latino37 1.6% Hispanic or LatinoMoved from different state 45 0.9% White / Caucasian857 4.0% Black or African American109 5.5% Two or more races45 1.0% White alone, not Hispanic / Latino
Children Nativity (place of birth) in Stockbridge
Children under 6 years - Living with two parents Both parents native 258 100.0% NativeBoth parents foreign-born 128 100.0% NativeOne native, one foreign-born parent 128 100.0% NativeChildren under 6 years - Living with one parent Native parent 1,010 100.0% NativeForeign-born parent 87 85.3% Native15 14.7% Foreign-bornChildren 6 to 17 years - Living with two parents Both parents native 1,369 98.6% Native20 1.4% Foreign-bornBoth parents foreign-born 538 77.7% Native154 22.3% Foreign-bornOne native, one foreign-born parent 369 100.0% NativeChildren 6 to 17 years - Living with one parent Native parent 2,004 100.0% NativeForeign-born parent 221 56.2% Native172 43.8% Foreign-born
Grandparents responsible for own grandchildren in Stockbridge
Grandparents (30 to 59 years) White / Caucasian 8 100.0% Responsible for grandchildrenBlack or African American 47 28.9% Responsible for grandchildren115 71.1% Not responsible for grandchildrenAsian 33 100.0% Responsible for grandchildrenWhite alone, not Hispanic / Latino 8 100.0% Responsible for grandchildrenGrandparents (60 years and over) White / Caucasian 19 100.0% Not responsible for grandchildrenBlack or African American 70 41.2% Responsible for grandchildren100 58.8% Not responsible for grandchildrenAsian 93 100.0% Not responsible for grandchildrenWhite alone, not Hispanic / Latino 21 100.0% Not responsible for grandchildren