Races in Stone Ridge, Virginia (VA) Detailed Stats
Data:
Races - White alone (%)
Races - White alone (% change since 2000)
Races - Black alone (%)
Races - Black alone (% change since 2000)
Races - American Indian alone (%)
Races - American Indian alone (% change since 2000)
Races - Asian alone (%)
Races - Asian alone (% change since 2000)
Races - Hispanic (%)
Races - Hispanic (% change since 2000)
Races - Native Hawaiian and Other Pacific Islander alone (%)
Races - Native Hawaiian and Other Pacific Islander alone (% change since 2000)
Races - Two or more races(%)
Races - Two or more races(% change since 2000)
Races - Other race alone (%)
Races - Other race alone (% change since 2000)
Racial diversity
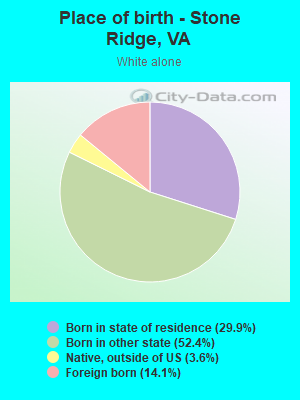
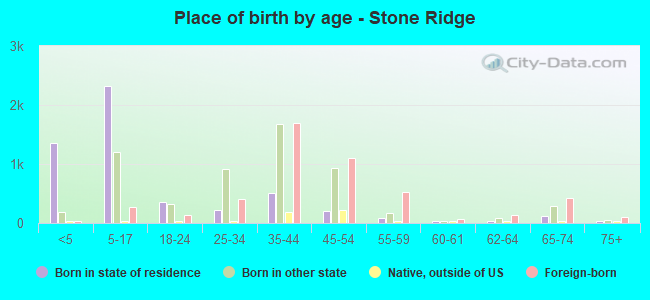
Place of birth - Born in state of residence (%)
Place of birth - Born in state of residence (%) - White
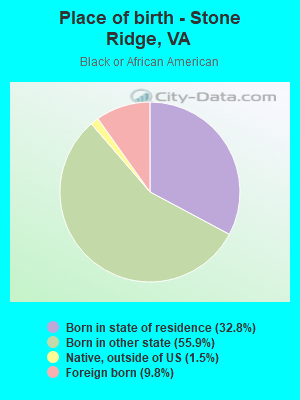
Place of birth - Born in state of residence (%) - Black or African American
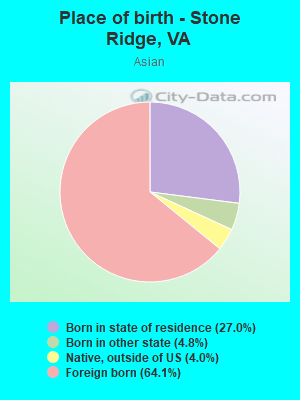
Place of birth - Born in state of residence (%) - Asian
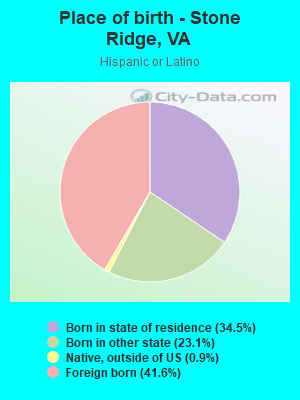
Place of birth - Born in state of residence (%) - Hispanic or Latino
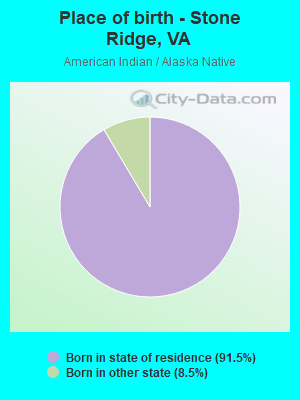
Place of birth - Born in state of residence (%) - American Indian and Alaska Native
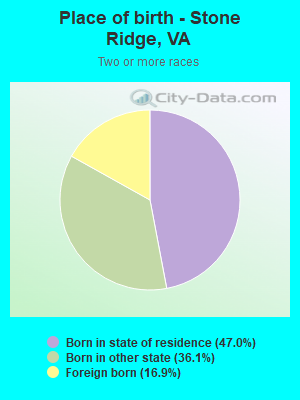
Place of birth - Born in state of residence (%) - Multirace
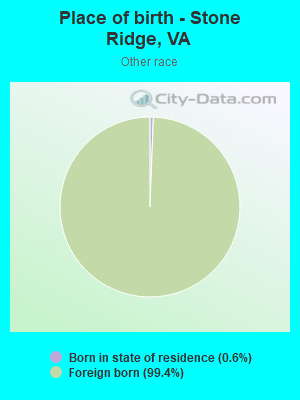
Place of birth - Born in state of residence (%) - Other Race
Place of birth - Born in other state (%)
Place of birth - Born in other state (%) - White
Place of birth - Born in other state (%) - Black or African American
Place of birth - Born in other state (%) - Asian
Place of birth - Born in other state (%) - Hispanic or Latino
Place of birth - Born in other state (%) - American Indian and Alaska Native
Place of birth - Born in other state (%) - Multirace
Place of birth - Born in other state (%) - Other Race
Place of birth - Native, outside of US (%)
Place of birth - Native, outside of US (%) - White
Place of birth - Native, outside of US (%) - Black or African American
Place of birth - Native, outside of US (%) - Asian
Place of birth - Native, outside of US (%) - Hispanic or Latino
Place of birth - Native, outside of US (%) - American Indian and Alaska Native
Place of birth - Native, outside of US (%) - Multirace
Place of birth - Native, outside of US (%) - Other Race
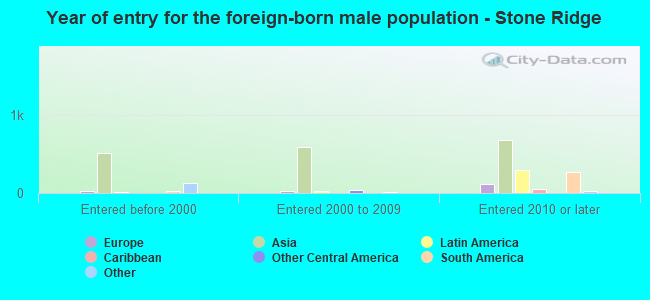
Place of birth - Foreign born (%)
Place of birth - Foreign born (%) - White
Place of birth - Foreign born (%) - Black or African American
Place of birth - Foreign born (%) - Asian
Place of birth - Foreign born (%) - Hispanic or Latino
Place of birth - Foreign born (%) - American Indian and Alaska Native
Place of birth - Foreign born (%) - Multirace
Place of birth - Foreign born (%) - Other Race
Residents speaking English at home (%)
Residents speaking English at home - Born in the United States (%)
Residents speaking English at home - Native, born elsewhere (%)
Residents speaking English at home - Foreign born (%)
Residents speaking Spanish at home (%)
Residents speaking Spanish at home - Born in the United States (%)
Residents speaking Spanish at home - Native, born elsewhere (%)
Residents speaking Spanish at home - Foreign born (%)
Residents speaking other language at home (%)
Residents speaking other language at home - Born in the United States (%)
Residents speaking other language at home - Native, born elsewhere (%)
Residents speaking other language at home - Foreign born (%)
Marital status - Never married (%)
Marital status - Now married (%)
Marital status - Separated (%)
Marital status - Widowed (%)
Marital status - Divorced (%)
Ancestries Reported - Arab (%)
Ancestries Reported - Czech (%)
Ancestries Reported - Danish (%)
Ancestries Reported - Dutch (%)
Ancestries Reported - English (%)
Ancestries Reported - French (%)
Ancestries Reported - French Canadian (%)
Ancestries Reported - German (%)
Ancestries Reported - Greek (%)
Ancestries Reported - Hungarian (%)
Ancestries Reported - Irish (%)
Ancestries Reported - Italian (%)
Ancestries Reported - Lithuanian (%)
Ancestries Reported - Norwegian (%)
Ancestries Reported - Polish (%)
Ancestries Reported - Portuguese (%)
Ancestries Reported - Russian (%)
Ancestries Reported - Scotch-Irish (%)
Ancestries Reported - Scottish (%)
Ancestries Reported - Slovak (%)
Ancestries Reported - Subsaharan African (%)
Ancestries Reported - Swedish (%)
Ancestries Reported - Swiss (%)
Ancestries Reported - Ukrainian (%)
Ancestries Reported - United States (%)
Ancestries Reported - Welsh (%)
Ancestries Reported - West Indian (%)
Ancestries Reported - Other (%)
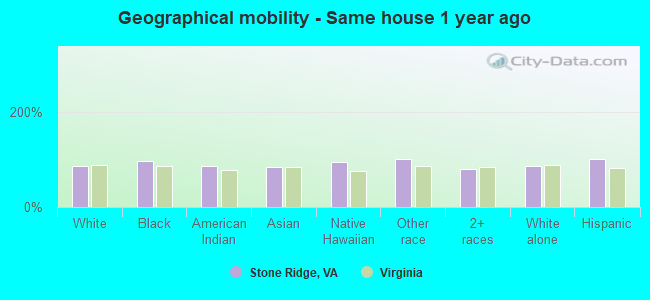
Geographical mobility - Same house 1 year ago (%)
Geographical mobility - Same house 1 year ago (%) - White
Geographical mobility - Same house 1 year ago (%) - Black or African American
Geographical mobility - Same house 1 year ago (%) - Asian
Geographical mobility - Same house 1 year ago (%) - Hispanic or Latino
Geographical mobility - Same house 1 year ago (%) - American Indian and Alaska Native
Geographical mobility - Same house 1 year ago (%) - Multirace
Geographical mobility - Same house 1 year ago (%) - Other Race
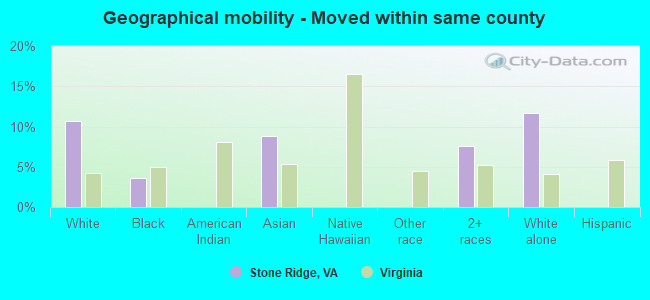
Geographical mobility - Moved within same county (%)
Geographical mobility - Moved within same county (%) - White
Geographical mobility - Moved within same county (%) - Black or African American
Geographical mobility - Moved within same county (%) - Asian
Geographical mobility - Moved within same county (%) - Hispanic or Latino
Geographical mobility - Moved within same county (%) - American Indian and Alaska Native
Geographical mobility - Moved within same county (%) - Multirace
Geographical mobility - Moved within same county (%) - Other Race
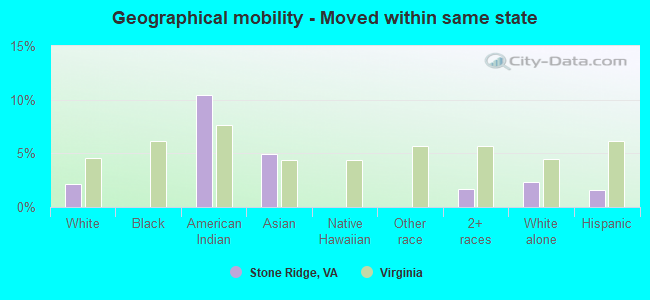
Geographical mobility - Moved from different county within same state (%)
Geographical mobility - Moved from different county within same state (%) - White
Geographical mobility - Moved from different county within same state (%) - Black or African American
Geographical mobility - Moved from different county within same state (%) - Asian
Geographical mobility - Moved from different county within same state (%) - Hispanic or Latino
Geographical mobility - Moved from different county within same state (%) - American Indian and Alaska Native
Geographical mobility - Moved from different county within same state (%) - Multirace
Geographical mobility - Moved from different county within same state (%) - Other Race
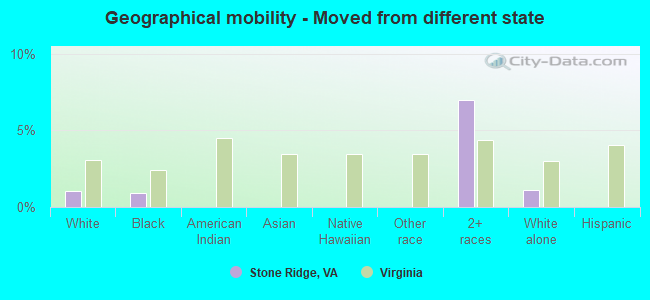
Geographical mobility - Moved from different state (%)
Geographical mobility - Moved from different state (%) - White
Geographical mobility - Moved from different state (%) - Black or African American
Geographical mobility - Moved from different state (%) - Asian
Geographical mobility - Moved from different state (%) - Hispanic or Latino
Geographical mobility - Moved from different state (%) - American Indian and Alaska Native
Geographical mobility - Moved from different state (%) - Multirace
Geographical mobility - Moved from different state (%) - Other Race
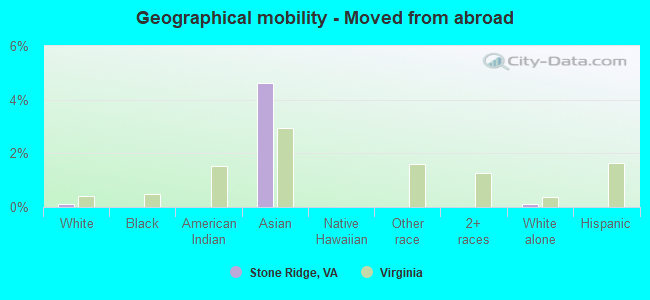
Geographical mobility - Moved from abroad (%)
Geographical mobility - Moved from abroad (%) - White
Geographical mobility - Moved from abroad (%) - Black or African American
Geographical mobility - Moved from abroad (%) - Asian
Geographical mobility - Moved from abroad (%) - Hispanic or Latino
Geographical mobility - Moved from abroad (%) - American Indian and Alaska Native
Geographical mobility - Moved from abroad (%) - Multirace
Geographical mobility - Moved from abroad (%) - Other Race
Place of birth for the foreign-born population - Ireland (%)
Place of birth for the foreign-born population - Denmark (%)
Place of birth for the foreign-born population - Norway (%)
Place of birth for the foreign-born population - Sweden (%)
Place of birth for the foreign-born population - United Kingdom (%)
Place of birth for the foreign-born population - England (%)
Place of birth for the foreign-born population - Scotland (%)
Place of birth for the foreign-born population - Other Northern Europe (%)
Place of birth for the foreign-born population - Austria (%)
Place of birth for the foreign-born population - Belgium (%)
Place of birth for the foreign-born population - France (%)
Place of birth for the foreign-born population - Germany (%)
Place of birth for the foreign-born population - Netherlands (%)
Place of birth for the foreign-born population - Switzerland (%)
Place of birth for the foreign-born population - Other Western Europe (%)
Place of birth for the foreign-born population - Greece (%)
Place of birth for the foreign-born population - Italy (%)
Place of birth for the foreign-born population - Portugal (%)
Place of birth for the foreign-born population - Spain (%)
Place of birth for the foreign-born population - Other Southern Europe (%)
Place of birth for the foreign-born population - Albania (%)
Place of birth for the foreign-born population - Belarus (%)
Place of birth for the foreign-born population - Bosnia and Herzegovina (%)
Place of birth for the foreign-born population - Bulgaria (%)
Place of birth for the foreign-born population - Croatia (%)
Place of birth for the foreign-born population - Czechoslovakia (%)
Place of birth for the foreign-born population - Hungary (%)
Place of birth for the foreign-born population - Latvia (%)
Place of birth for the foreign-born population - Lithuania (%)
Place of birth for the foreign-born population - North Macedonia (Macedonia) (%)
Place of birth for the foreign-born population - Moldova (%)
Place of birth for the foreign-born population - Poland (%)
Place of birth for the foreign-born population - Romania (%)
Place of birth for the foreign-born population - Russia (%)
Place of birth for the foreign-born population - Serbia (%)
Place of birth for the foreign-born population - Ukraine (%)
Place of birth for the foreign-born population - Other Eastern Europe (%)
Place of birth for the foreign-born population - China (%)
Place of birth for the foreign-born population - Hong Kong (%)
Place of birth for the foreign-born population - Taiwan (%)
Place of birth for the foreign-born population - Japan (%)
Place of birth for the foreign-born population - Korea (%)
Place of birth for the foreign-born population - Other Eastern Asia (%)
Place of birth for the foreign-born population - Afghanistan (%)
Place of birth for the foreign-born population - Bangladesh (%)
Place of birth for the foreign-born population - India (%)
Place of birth for the foreign-born population - Iran (%)
Place of birth for the foreign-born population - Kazakhstan (%)
Place of birth for the foreign-born population - Nepal (%)
Place of birth for the foreign-born population - Pakistan (%)
Place of birth for the foreign-born population - Sri Lanka (%)
Place of birth for the foreign-born population - Uzbekistan (%)
Place of birth for the foreign-born population - Other South Central Asia (%)
Place of birth for the foreign-born population - Burma (%)
Place of birth for the foreign-born population - Cambodia (%)
Place of birth for the foreign-born population - Indonesia (%)
Place of birth for the foreign-born population - Laos (%)
Place of birth for the foreign-born population - Malaysia (%)
Place of birth for the foreign-born population - Philippines (%)
Place of birth for the foreign-born population - Singapore (%)
Place of birth for the foreign-born population - Thailand (%)
Place of birth for the foreign-born population - Vietnam (%)
Place of birth for the foreign-born population - Other South Eastern Asia (%)
Place of birth for the foreign-born population - Armenia (%)
Place of birth for the foreign-born population - Iraq (%)
Place of birth for the foreign-born population - Israel (%)
Place of birth for the foreign-born population - Jordan (%)
Place of birth for the foreign-born population - Kuwait (%)
Place of birth for the foreign-born population - Lebanon (%)
Place of birth for the foreign-born population - Saudi Arabia (%)
Place of birth for the foreign-born population - Syria (%)
Place of birth for the foreign-born population - Turkey (%)
Place of birth for the foreign-born population - Yemen (%)
Place of birth for the foreign-born population - Other Western Asia (%)
Place of birth for the foreign-born population - Eritrea (%)
Place of birth for the foreign-born population - Ethiopia (%)
Place of birth for the foreign-born population - Kenya (%)
Place of birth for the foreign-born population - Somalia (%)
Place of birth for the foreign-born population - Uganda (%)
Place of birth for the foreign-born population - Zimbabwe (%)
Place of birth for the foreign-born population - Other Eastern Africa (%)
Place of birth for the foreign-born population - Cameroon (%)
Place of birth for the foreign-born population - Congo (%)
Place of birth for the foreign-born population - Democratic Republic of Congo (Zaire) (%)
Place of birth for the foreign-born population - Other Middle Africa (%)
Place of birth for the foreign-born population - Egypt (%)
Place of birth for the foreign-born population - Morocco (%)
Place of birth for the foreign-born population - Sudan (%)
Place of birth for the foreign-born population - Other Northern Africa (%)
Place of birth for the foreign-born population - South Africa (%)
Place of birth for the foreign-born population - Other Southern Africa (%)
Place of birth for the foreign-born population - Cabo Verde (%)
Place of birth for the foreign-born population - Ghana (%)
Place of birth for the foreign-born population - Liberia (%)
Place of birth for the foreign-born population - Nigeria (%)
Place of birth for the foreign-born population - Senegal (%)
Place of birth for the foreign-born population - Sierra Leone (%)
Place of birth for the foreign-born population - Other Western Africa (%)
Place of birth for the foreign-born population - Australia (%)
Place of birth for the foreign-born population - New Zealand (%)
Place of birth for the foreign-born population - Fiji (%)
Place of birth for the foreign-born population - Micronesia (%)
Place of birth for the foreign-born population - Bahamas (%)
Place of birth for the foreign-born population - Barbados (%)
Place of birth for the foreign-born population - Cuba (%)
Place of birth for the foreign-born population - Dominica (%)
Place of birth for the foreign-born population - Dominican Republic (%)
Place of birth for the foreign-born population - Grenada (%)
Place of birth for the foreign-born population - Haiti (%)
Place of birth for the foreign-born population - Jamaica (%)
Place of birth for the foreign-born population - St. Vincent and the Grenadines (%)
Place of birth for the foreign-born population - Trinidad and Tobago (%)
Place of birth for the foreign-born population - West Indies (%)
Place of birth for the foreign-born population - Other Caribbean (%)
Place of birth for the foreign-born population - Belize (%)
Place of birth for the foreign-born population - Costa Rica (%)
Place of birth for the foreign-born population - El Salvador (%)
Place of birth for the foreign-born population - Guatemala (%)
Place of birth for the foreign-born population - Honduras (%)
Place of birth for the foreign-born population - Mexico (%)
Place of birth for the foreign-born population - Nicaragua (%)
Place of birth for the foreign-born population - Panama (%)
Place of birth for the foreign-born population - Other Central America (%)
Place of birth for the foreign-born population - Argentina (%)
Place of birth for the foreign-born population - Bolivia (%)
Place of birth for the foreign-born population - Brazil (%)
Place of birth for the foreign-born population - Chile (%)
Place of birth for the foreign-born population - Colombia (%)
Place of birth for the foreign-born population - Ecuador (%)
Place of birth for the foreign-born population - Guyana (%)
Place of birth for the foreign-born population - Peru (%)
Place of birth for the foreign-born population - Uruguay (%)
Place of birth for the foreign-born population - Venezuela (%)
Place of birth for the foreign-born population - Other South America (%)
Place of birth for the foreign-born population - Canada (%)
Place of birth for the foreign-born population - Other Northern America (%)
Place of birth for the foreign-born population - Other (%)
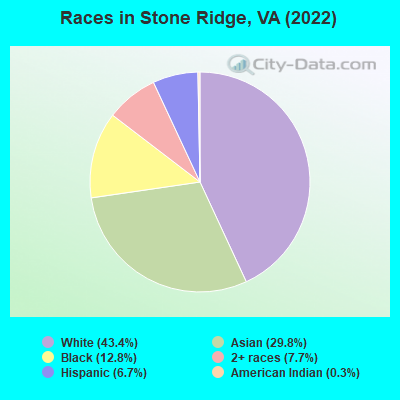
According to 2022 data, the most numerous races in Stone Ridge, VA are White alone (7,156 residents), Black alone (2,106 residents), and Hispanic (1,097 residents). 63.0% of Stone Ridge residents speak English at home.
Race distribution in Stone Ridge 7,156 43.4% White alone 4,907 29.8% Asian alone 2,106 12.8% Black alone 1,275 7.7% Two or more races 1,097 6.7% Hispanic 52 0.3% American Indian alone 9 0.05% Native Hawaiian and Other
2000 2022
4,965,637 70.2% White alone 1,376,378 19.4% Black alone 329,540 4.7% Hispanic 259,277 3.7% Asian alone 114,022 1.6% Two or more races 18,596 0.3% American Indian alone 11,685 0.2% Other race alone 3,380 0.05% Native Hawaiian and Other
5,095,130 58.7% White alone 1,594,785 18.4% Black alone 905,750 10.4% Hispanic 602,881 6.9% Asian alone 406,047 4.7% Two or more races 60,419 0.7% Other race alone 11,738 0.1% American Indian alone 6,869 0.08% Native Hawaiian and Other
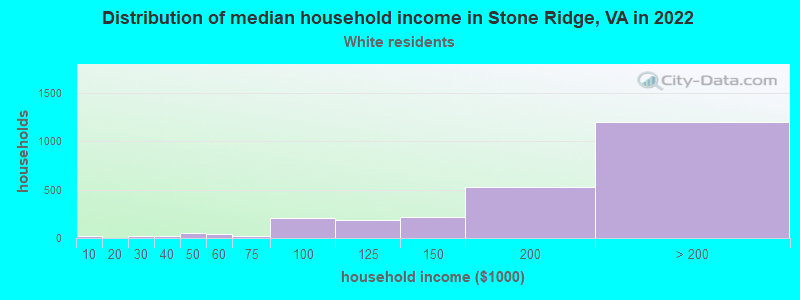
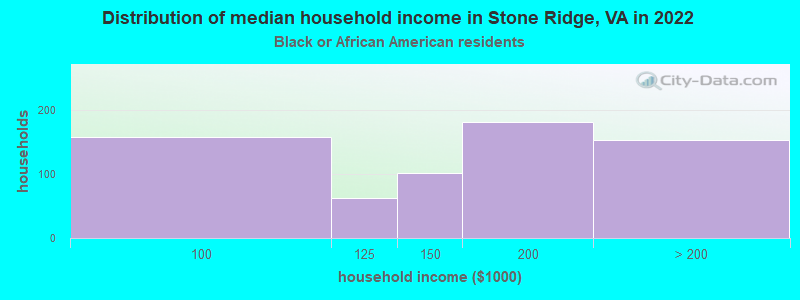
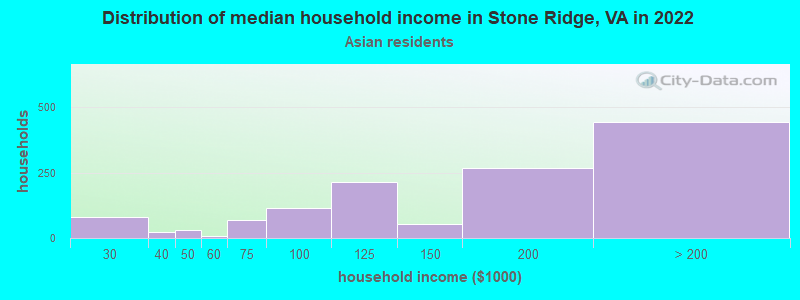
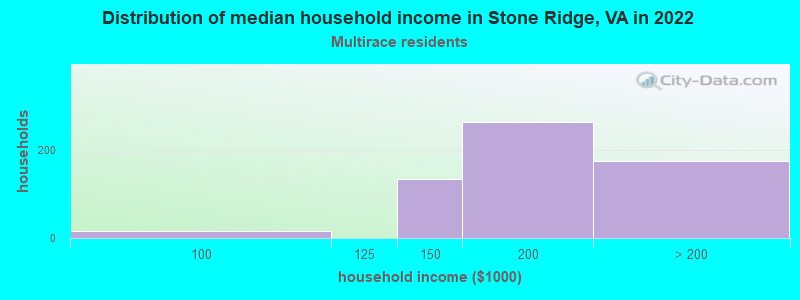
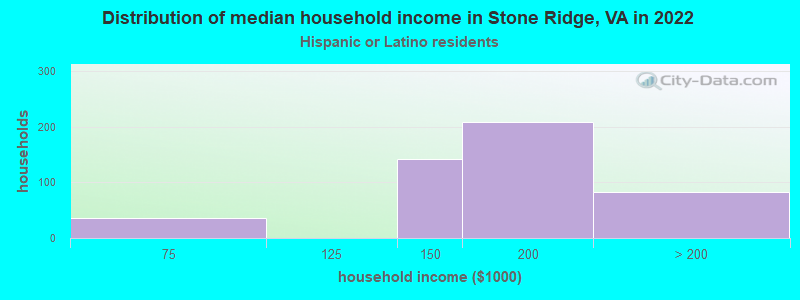
Income and house value in Stone Ridge Median household income in 2022 over $200,000 White non-Hispanic householders$144,122 Black householders$158,349 Asian householders$190,854 Two or more races householders$194,353 Hispanic or Latino race householders
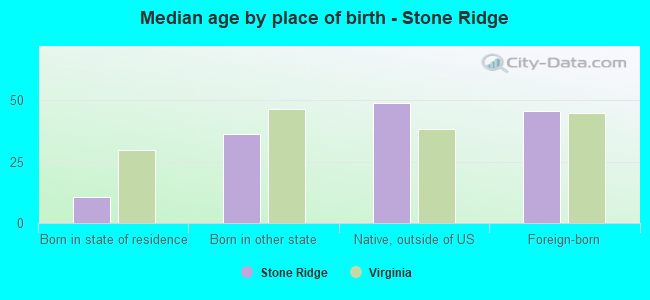
Median age by race in Stone Ridge
37.2 Median age for White residents38.1 36.9 32.6 Median age for Black or African American residents8.9 41.9 28.4 Median age for American Indian / Alaska Native residents51.1 23.6 38.8 Median age for Asian residents39.8 38.3 -1,157,453,935.2 Median age for Native Hawaiian / Pacific Islander residents-541,531,822.5 -714,150,046.8 28.7 Median age for Other race residents-755,386,564.5 24.9 14.5 Median age for Two or more races residents53.1 9.9 36.8 Median age for White alone residents38.2 34.9 44.8 Median age for Hispanic or Latino residents44.9 29.0
Owner/renter occupied households by race in Stone Ridge
House owners and renters - White residents 2,286 90.5% Owner occupied240 9.5% Renter occupiedHouse owners and renters - Black or African American residents 530 82.7% Owner occupied111 17.3% Renter occupiedHouse owners and renters - American Indian / Alaska Native residents 11 100.0% Owner occupiedHouse owners and renters - Asian residents 1,098 88.4% Owner occupied143 11.6% Renter occupiedHouse owners and renters - Native Hawaiian / Pacific Islander residents 12 100.0% Owner occupiedHouse owners and renters - Other race residents 50 100.0% Owner occupiedHouse owners and renters - Two or more races residents 437 78.6% Owner occupied119 21.4% Renter occupiedHouse owners and renters - White alone residents 2,170 89.8% Owner occupied246 10.2% Renter occupiedHouse owners and renters - Hispanic or Latino residents 415 100.0% Owner occupied
Language usage in Stone Ridge
English speakers - Total 63.0% of residents of Stone Ridge speak English at home.
4.2% of residents speak Spanish at home 451 71.9% Speak English very well176 28.1% Speak English less than very well33.7% of residents speak other language at home 3,656 73.1% Speak English very well1,346 26.9% Speak English less than very well
English speakers - Born in the United States 91.0% of residents of Stone Ridge speak English at home.
0.7% of residents speak Spanish at home 39 100.0% Speak English very well9.0% of residents speak other language at home 508 100.0% Speak English very well
English speakers - Native, born elsewhere 71.0% of residents of Stone Ridge speak English at home.
4.5% of residents speak Spanish at home 13 61.9% Speak English very well8 38.1% Speak English less than very well
English speakers - Foreign-born 8.6% of residents of Stone Ridge speak English at home.
11.3% of residents speak Spanish at home 394 71.0% Speak English very well161 29.0% Speak English less than very well82.7% of residents speak other language at home 2,798 68.9% Speak English very well1,264 31.1% Speak English less than very well
White (Caucasian) - Speak only English Native:
95.0% (5,272)Foreign-born:
6.0% (55)
White (Caucasian) - Speak another language Native:
5.0% (276)Foreign-born:
96.3% (886)
Black or African American - Speak only English Native:
97.8% (1,548)Foreign-born:
51.3% (105)
Black or African American - Speak another language Native:
0.9% (14)Foreign-born:
35.6% (73)
Asian - Speak only English Native:
62.0% (881)Foreign-born:
7.1% (225)
Asian - Speak another language Native:
35.7% (508)Foreign-born:
92.9% (2,965)
Two or more races - Speak another language Native:
7.8% (111)Foreign-born:
99.1% (326)
White alone - Speak only English Native:
93.6% (5,115)Foreign-born:
5.6% (55)
White alone - Speak another language Native:
6.6% (362)Foreign-born:
100.0% (998)
Hispanic or Latino - Speak only English Native:
88.1% (513)Foreign-born:
5.6% (25)
Hispanic or Latino - Speak another language Native:
13.8% (81)Foreign-born:
94.1% (422)
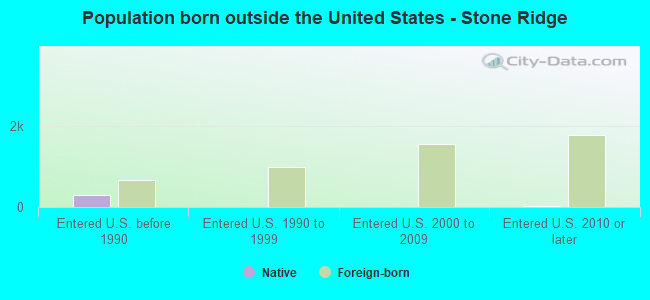
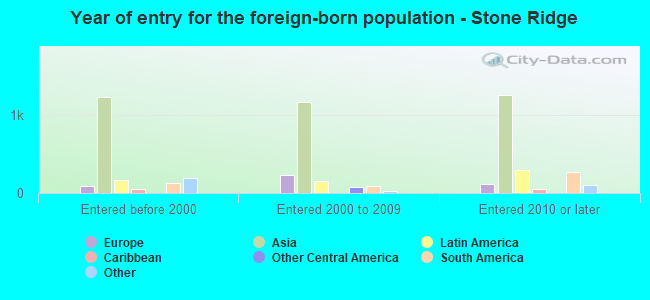
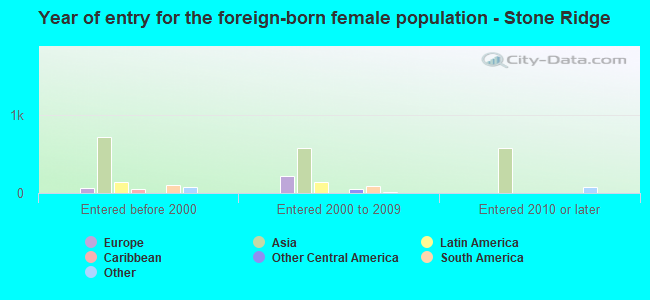
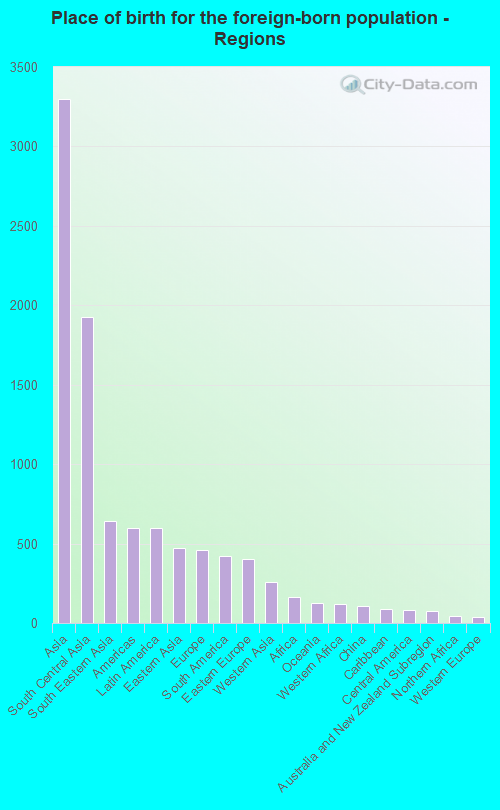
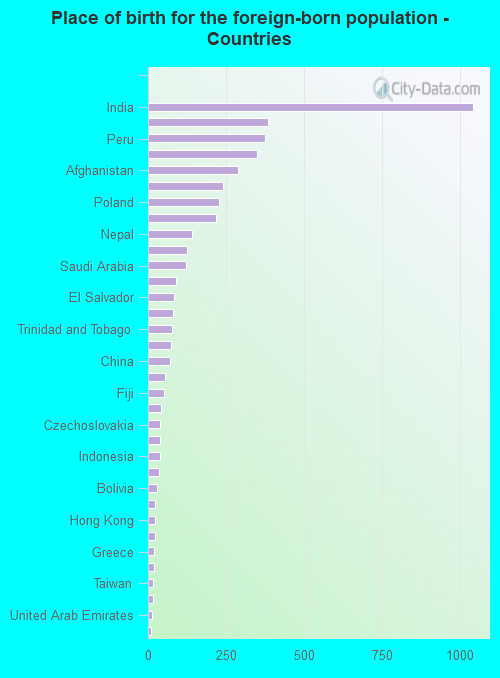
Foreign-born residents in Stone Ridge
Marital status for residents in Stone Ridge Marital status - White (Caucasian) population 15 years and over
Males 17.9% Never married77.1% Now married0.7% Separated0.7% Widowed3.5% DivorcedFemales 20.9% Never married70.7% Now married0.5% Separated2.6% Widowed5.4% DivorcedWomen who gave birth in the past 12 months Now married:
100.0% (58)Unmarried:
0.0% (0)
Women who did not give birth in the past 12 months Now married:
67.8% (1,281)Unmarried:
32.2% (609)
Marital status - Black or African American population 15 years and over
Males 11.1% Never married88.9% Now married0.0% Separated0.0% Widowed0.0% DivorcedFemales 44.6% Never married31.4% Now married0.0% Separated10.5% Widowed13.5% DivorcedWomen who did not give birth in the past 12 months Now married:
21.0% (149)Unmarried:
79.0% (560)
Marital status - American Indian / Alaska Native population 15 years and over
Males 0.0% Never married100.0% Now married0.0% Separated0.0% Widowed0.0% DivorcedFemales 82.7% Never married17.3% Now married0.0% Separated0.0% Widowed0.0% DivorcedWomen who gave birth in the past 12 months Now married:
100.0% (10)Unmarried:
0.0% (0)
Women who did not give birth in the past 12 months Now married:
0.0% (0)Unmarried:
100.0% (46)
Marital status - Asian population 15 years and over
Males 17.3% Never married80.6% Now married1.0% Separated1.1% Widowed0.0% DivorcedFemales 13.2% Never married66.4% Now married0.0% Separated13.3% Widowed7.1% DivorcedWomen who gave birth in the past 12 months Now married:
100.0% (170)Unmarried:
0.0% (0)
Women who did not give birth in the past 12 months Now married:
73.5% (856)Unmarried:
26.5% (308)
Marital status - Other race population 15 years and over
Males 42.6% Never married57.4% Now married0.0% Separated0.0% Widowed0.0% DivorcedFemales 27.7% Never married67.3% Now married0.0% Separated0.0% Widowed5.0% DivorcedWomen who did not give birth in the past 12 months Now married:
62.2% (57)Unmarried:
37.8% (35)
Marital status - Two or more races population 15 years and over
Males 39.1% Never married60.9% Now married0.0% Separated0.0% Widowed0.0% DivorcedFemales 39.2% Never married37.6% Now married0.0% Separated0.0% Widowed23.2% DivorcedWomen who did not give birth in the past 12 months Now married:
26.4% (43)Unmarried:
73.6% (121)
Marital status - White alone, not Hispanic / Latino population 15 years and over
Males 18.8% Never married78.4% Now married0.8% Separated0.8% Widowed1.2% DivorcedFemales 21.7% Never married69.5% Now married0.5% Separated2.7% Widowed5.6% DivorcedWomen who gave birth in the past 12 months Now married:
100.0% (52)Unmarried:
0.0% (0)
Women who did not give birth in the past 12 months Now married:
67.8% (1,350)Unmarried:
32.2% (641)
Marital status - Hispanic or Latino population 15 years and over
Males 15.0% Never married73.6% Now married0.0% Separated0.0% Widowed11.4% DivorcedFemales 34.6% Never married58.2% Now married0.0% Separated0.0% Widowed7.2% DivorcedWomen who gave birth in the past 12 months Now married:
100.0% (9)Unmarried:
0.0% (0)
Women who did not give birth in the past 12 months Now married:
29.5% (47)Unmarried:
70.5% (113)
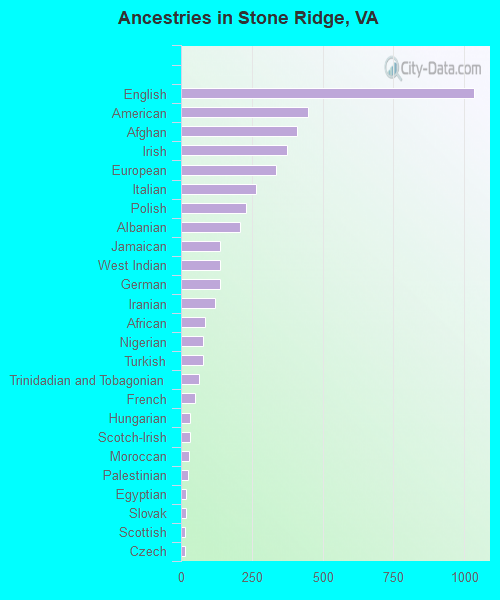
Ancestries in Stone Ridge
1,036 12.0% English449 5.2% American410 4.7% Afghan373 4.3% Irish335 3.9% European264 3.0% Italian230 2.7% Polish208 2.4% Albanian139 1.6% Jamaican139 1.6% West Indian138 1.6% German119 1.4% Iranian83 1.0% African78 0.9% Nigerian76 0.9% Turkish63 0.7% Trinidadian and Tobagonian50 0.6% French33 0.4% Hungarian31 0.4% Scotch-Irish27 0.3% Moroccan24 0.3% Palestinian19 0.2% Egyptian17 0.2% Slovak15 0.2% Scottish13 0.2% Czech8 0.09% Swedish5 0.06% Russian
Geographical mobility in Stone Ridge Same house 1 year ago 6,166 86.2% White (Caucasian)1,896 97.1% Black or African American93 85.5% American Indian / Alaska Native4,014 82.9% Asian14 95.3% Native Hawaiian / Pacific Islander207 100.0% Other race1,614 79.9% Two or more races6,032 85.1% White alone, not Hispanic / Latino1,112 100.0% Hispanic or LatinoMoved within same county 761 10.6% White / Caucasian70 3.6% Black or African American425 8.8% Asian152 7.5% Two or more races823 11.6% White alone, not Hispanic / LatinoMoved within same state 151 2.1% White / Caucasian11 10.5% American Indian / Alaska Native239 4.9% Asian34 1.7% Two or more races167 2.4% White alone, not Hispanic / Latino17 1.6% Hispanic or LatinoMoved from different state 76 1.1% White / Caucasian18 0.9% Black or African American141 7.0% Two or more races79 1.1% White alone, not Hispanic / LatinoMoved from abroad 8 0.1% White224 4.6% Asian9 0.1% White alone, not Hispanic / Latino
Children Nativity (place of birth) in Stone Ridge
Children under 6 years - Living with two parents Both parents native 1,052 100.0% NativeBoth parents foreign-born 409 93.1% Native30 6.9% Foreign-bornOne native, one foreign-born parent 258 100.0% NativeChildren under 6 years - Living with one parent Native parent 52 100.0% NativeForeign-born parent 24 100.0% NativeChildren 6 to 17 years - Living with two parents Both parents native 1,388 100.0% NativeBoth parents foreign-born 1,009 83.4% Native201 16.6% Foreign-bornOne native, one foreign-born parent 149 77.2% Native44 22.8% Foreign-bornChildren 6 to 17 years - Living with one parent Native parent 422 100.0% NativeForeign-born parent 207 53.2% Native182 46.8% Foreign-born
Grandparents responsible for own grandchildren in Stone Ridge
Grandparents (30 to 59 years) White / Caucasian 103 100.0% Not responsible for grandchildrenWhite alone, not Hispanic / Latino 100 100.0% Not responsible for grandchildrenHispanic or Latino 15 100.0% Not responsible for grandchildren
Grandparents (60 years and over) White / Caucasian 16 100.0% Not responsible for grandchildrenWhite alone, not Hispanic / Latino 17 100.0% Not responsible for grandchildrenHispanic or Latino 6 100.0% Not responsible for grandchildren