Races in Stoneham, Massachusetts (MA) Detailed Stats
Data:
Races - White alone (%)
Races - White alone (% change since 2000)
Races - Black alone (%)
Races - Black alone (% change since 2000)
Races - American Indian alone (%)
Races - American Indian alone (% change since 2000)
Races - Asian alone (%)
Races - Asian alone (% change since 2000)
Races - Hispanic (%)
Races - Hispanic (% change since 2000)
Races - Native Hawaiian and Other Pacific Islander alone (%)
Races - Native Hawaiian and Other Pacific Islander alone (% change since 2000)
Races - Two or more races(%)
Races - Two or more races(% change since 2000)
Races - Other race alone (%)
Races - Other race alone (% change since 2000)
Racial diversity
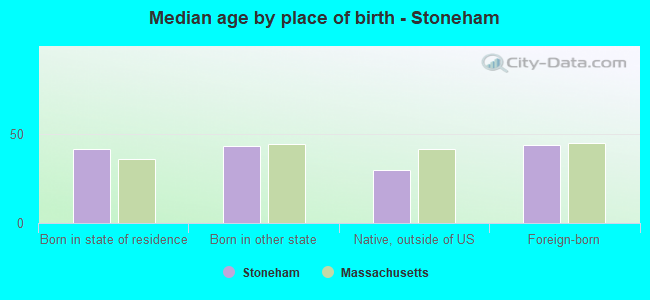
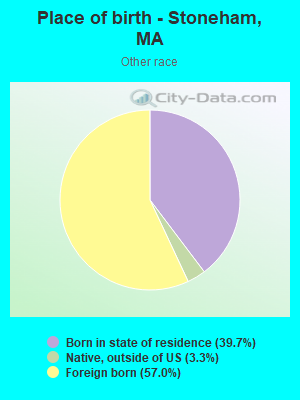
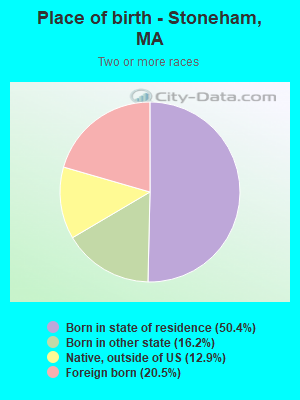
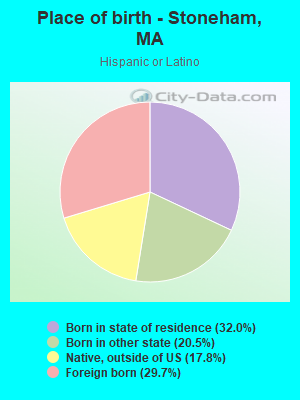
Place of birth - Born in state of residence (%)
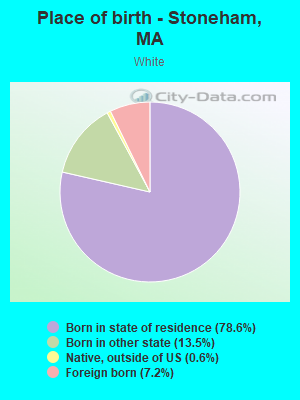
Place of birth - Born in state of residence (%) - White
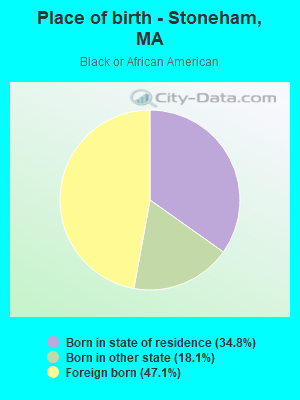
Place of birth - Born in state of residence (%) - Black or African American
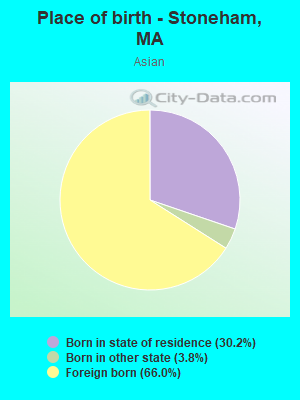
Place of birth - Born in state of residence (%) - Asian
Place of birth - Born in state of residence (%) - Hispanic or Latino
Place of birth - Born in state of residence (%) - American Indian and Alaska Native
Place of birth - Born in state of residence (%) - Multirace
Place of birth - Born in state of residence (%) - Other Race
Place of birth - Born in other state (%)
Place of birth - Born in other state (%) - White
Place of birth - Born in other state (%) - Black or African American
Place of birth - Born in other state (%) - Asian
Place of birth - Born in other state (%) - Hispanic or Latino
Place of birth - Born in other state (%) - American Indian and Alaska Native
Place of birth - Born in other state (%) - Multirace
Place of birth - Born in other state (%) - Other Race
Place of birth - Native, outside of US (%)
Place of birth - Native, outside of US (%) - White
Place of birth - Native, outside of US (%) - Black or African American
Place of birth - Native, outside of US (%) - Asian
Place of birth - Native, outside of US (%) - Hispanic or Latino
Place of birth - Native, outside of US (%) - American Indian and Alaska Native
Place of birth - Native, outside of US (%) - Multirace
Place of birth - Native, outside of US (%) - Other Race
Place of birth - Foreign born (%)
Place of birth - Foreign born (%) - White
Place of birth - Foreign born (%) - Black or African American
Place of birth - Foreign born (%) - Asian
Place of birth - Foreign born (%) - Hispanic or Latino
Place of birth - Foreign born (%) - American Indian and Alaska Native
Place of birth - Foreign born (%) - Multirace
Place of birth - Foreign born (%) - Other Race
Residents speaking English at home (%)
Residents speaking English at home - Born in the United States (%)
Residents speaking English at home - Native, born elsewhere (%)
Residents speaking English at home - Foreign born (%)
Residents speaking Spanish at home (%)
Residents speaking Spanish at home - Born in the United States (%)
Residents speaking Spanish at home - Native, born elsewhere (%)
Residents speaking Spanish at home - Foreign born (%)
Residents speaking other language at home (%)
Residents speaking other language at home - Born in the United States (%)
Residents speaking other language at home - Native, born elsewhere (%)
Residents speaking other language at home - Foreign born (%)
Marital status - Never married (%)
Marital status - Now married (%)
Marital status - Separated (%)
Marital status - Widowed (%)
Marital status - Divorced (%)
Ancestries Reported - Arab (%)
Ancestries Reported - Czech (%)
Ancestries Reported - Danish (%)
Ancestries Reported - Dutch (%)
Ancestries Reported - English (%)
Ancestries Reported - French (%)
Ancestries Reported - French Canadian (%)
Ancestries Reported - German (%)
Ancestries Reported - Greek (%)
Ancestries Reported - Hungarian (%)
Ancestries Reported - Irish (%)
Ancestries Reported - Italian (%)
Ancestries Reported - Lithuanian (%)
Ancestries Reported - Norwegian (%)
Ancestries Reported - Polish (%)
Ancestries Reported - Portuguese (%)
Ancestries Reported - Russian (%)
Ancestries Reported - Scotch-Irish (%)
Ancestries Reported - Scottish (%)
Ancestries Reported - Slovak (%)
Ancestries Reported - Subsaharan African (%)
Ancestries Reported - Swedish (%)
Ancestries Reported - Swiss (%)
Ancestries Reported - Ukrainian (%)
Ancestries Reported - United States (%)
Ancestries Reported - Welsh (%)
Ancestries Reported - West Indian (%)
Ancestries Reported - Other (%)
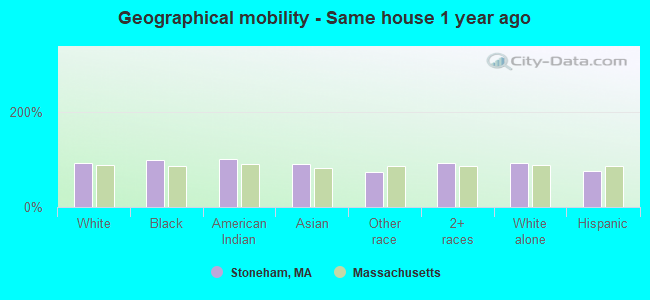
Geographical mobility - Same house 1 year ago (%)
Geographical mobility - Same house 1 year ago (%) - White
Geographical mobility - Same house 1 year ago (%) - Black or African American
Geographical mobility - Same house 1 year ago (%) - Asian
Geographical mobility - Same house 1 year ago (%) - Hispanic or Latino
Geographical mobility - Same house 1 year ago (%) - American Indian and Alaska Native
Geographical mobility - Same house 1 year ago (%) - Multirace
Geographical mobility - Same house 1 year ago (%) - Other Race
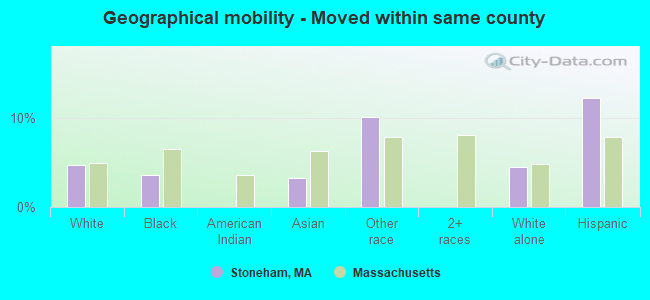
Geographical mobility - Moved within same county (%)
Geographical mobility - Moved within same county (%) - White
Geographical mobility - Moved within same county (%) - Black or African American
Geographical mobility - Moved within same county (%) - Asian
Geographical mobility - Moved within same county (%) - Hispanic or Latino
Geographical mobility - Moved within same county (%) - American Indian and Alaska Native
Geographical mobility - Moved within same county (%) - Multirace
Geographical mobility - Moved within same county (%) - Other Race
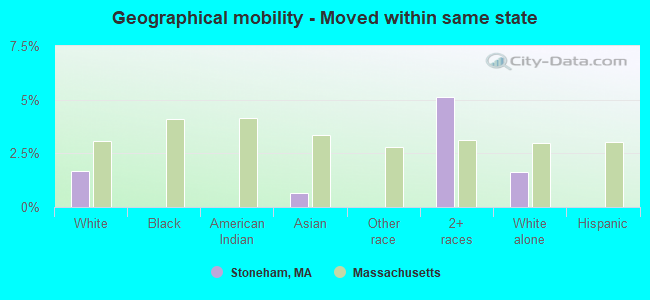
Geographical mobility - Moved from different county within same state (%)
Geographical mobility - Moved from different county within same state (%) - White
Geographical mobility - Moved from different county within same state (%) - Black or African American
Geographical mobility - Moved from different county within same state (%) - Asian
Geographical mobility - Moved from different county within same state (%) - Hispanic or Latino
Geographical mobility - Moved from different county within same state (%) - American Indian and Alaska Native
Geographical mobility - Moved from different county within same state (%) - Multirace
Geographical mobility - Moved from different county within same state (%) - Other Race
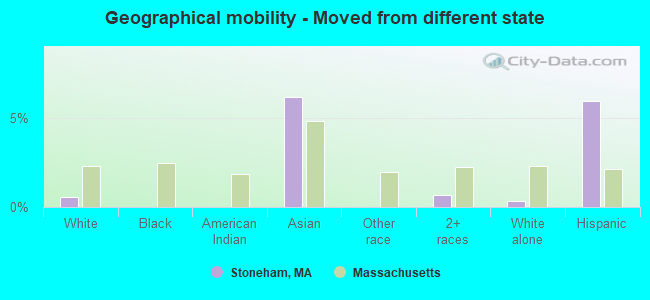
Geographical mobility - Moved from different state (%)
Geographical mobility - Moved from different state (%) - White
Geographical mobility - Moved from different state (%) - Black or African American
Geographical mobility - Moved from different state (%) - Asian
Geographical mobility - Moved from different state (%) - Hispanic or Latino
Geographical mobility - Moved from different state (%) - American Indian and Alaska Native
Geographical mobility - Moved from different state (%) - Multirace
Geographical mobility - Moved from different state (%) - Other Race
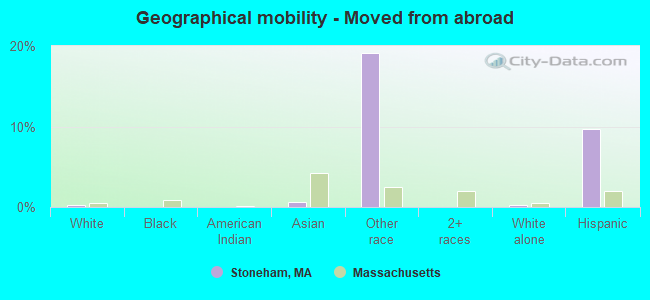
Geographical mobility - Moved from abroad (%)
Geographical mobility - Moved from abroad (%) - White
Geographical mobility - Moved from abroad (%) - Black or African American
Geographical mobility - Moved from abroad (%) - Asian
Geographical mobility - Moved from abroad (%) - Hispanic or Latino
Geographical mobility - Moved from abroad (%) - American Indian and Alaska Native
Geographical mobility - Moved from abroad (%) - Multirace
Geographical mobility - Moved from abroad (%) - Other Race
Place of birth for the foreign-born population - Ireland (%)
Place of birth for the foreign-born population - Denmark (%)
Place of birth for the foreign-born population - Norway (%)
Place of birth for the foreign-born population - Sweden (%)
Place of birth for the foreign-born population - United Kingdom (%)
Place of birth for the foreign-born population - England (%)
Place of birth for the foreign-born population - Scotland (%)
Place of birth for the foreign-born population - Other Northern Europe (%)
Place of birth for the foreign-born population - Austria (%)
Place of birth for the foreign-born population - Belgium (%)
Place of birth for the foreign-born population - France (%)
Place of birth for the foreign-born population - Germany (%)
Place of birth for the foreign-born population - Netherlands (%)
Place of birth for the foreign-born population - Switzerland (%)
Place of birth for the foreign-born population - Other Western Europe (%)
Place of birth for the foreign-born population - Greece (%)
Place of birth for the foreign-born population - Italy (%)
Place of birth for the foreign-born population - Portugal (%)
Place of birth for the foreign-born population - Spain (%)
Place of birth for the foreign-born population - Other Southern Europe (%)
Place of birth for the foreign-born population - Albania (%)
Place of birth for the foreign-born population - Belarus (%)
Place of birth for the foreign-born population - Bosnia and Herzegovina (%)
Place of birth for the foreign-born population - Bulgaria (%)
Place of birth for the foreign-born population - Croatia (%)
Place of birth for the foreign-born population - Czechoslovakia (%)
Place of birth for the foreign-born population - Hungary (%)
Place of birth for the foreign-born population - Latvia (%)
Place of birth for the foreign-born population - Lithuania (%)
Place of birth for the foreign-born population - North Macedonia (Macedonia) (%)
Place of birth for the foreign-born population - Moldova (%)
Place of birth for the foreign-born population - Poland (%)
Place of birth for the foreign-born population - Romania (%)
Place of birth for the foreign-born population - Russia (%)
Place of birth for the foreign-born population - Serbia (%)
Place of birth for the foreign-born population - Ukraine (%)
Place of birth for the foreign-born population - Other Eastern Europe (%)
Place of birth for the foreign-born population - China (%)
Place of birth for the foreign-born population - Hong Kong (%)
Place of birth for the foreign-born population - Taiwan (%)
Place of birth for the foreign-born population - Japan (%)
Place of birth for the foreign-born population - Korea (%)
Place of birth for the foreign-born population - Other Eastern Asia (%)
Place of birth for the foreign-born population - Afghanistan (%)
Place of birth for the foreign-born population - Bangladesh (%)
Place of birth for the foreign-born population - India (%)
Place of birth for the foreign-born population - Iran (%)
Place of birth for the foreign-born population - Kazakhstan (%)
Place of birth for the foreign-born population - Nepal (%)
Place of birth for the foreign-born population - Pakistan (%)
Place of birth for the foreign-born population - Sri Lanka (%)
Place of birth for the foreign-born population - Uzbekistan (%)
Place of birth for the foreign-born population - Other South Central Asia (%)
Place of birth for the foreign-born population - Burma (%)
Place of birth for the foreign-born population - Cambodia (%)
Place of birth for the foreign-born population - Indonesia (%)
Place of birth for the foreign-born population - Laos (%)
Place of birth for the foreign-born population - Malaysia (%)
Place of birth for the foreign-born population - Philippines (%)
Place of birth for the foreign-born population - Singapore (%)
Place of birth for the foreign-born population - Thailand (%)
Place of birth for the foreign-born population - Vietnam (%)
Place of birth for the foreign-born population - Other South Eastern Asia (%)
Place of birth for the foreign-born population - Armenia (%)
Place of birth for the foreign-born population - Iraq (%)
Place of birth for the foreign-born population - Israel (%)
Place of birth for the foreign-born population - Jordan (%)
Place of birth for the foreign-born population - Kuwait (%)
Place of birth for the foreign-born population - Lebanon (%)
Place of birth for the foreign-born population - Saudi Arabia (%)
Place of birth for the foreign-born population - Syria (%)
Place of birth for the foreign-born population - Turkey (%)
Place of birth for the foreign-born population - Yemen (%)
Place of birth for the foreign-born population - Other Western Asia (%)
Place of birth for the foreign-born population - Eritrea (%)
Place of birth for the foreign-born population - Ethiopia (%)
Place of birth for the foreign-born population - Kenya (%)
Place of birth for the foreign-born population - Somalia (%)
Place of birth for the foreign-born population - Uganda (%)
Place of birth for the foreign-born population - Zimbabwe (%)
Place of birth for the foreign-born population - Other Eastern Africa (%)
Place of birth for the foreign-born population - Cameroon (%)
Place of birth for the foreign-born population - Congo (%)
Place of birth for the foreign-born population - Democratic Republic of Congo (Zaire) (%)
Place of birth for the foreign-born population - Other Middle Africa (%)
Place of birth for the foreign-born population - Egypt (%)
Place of birth for the foreign-born population - Morocco (%)
Place of birth for the foreign-born population - Sudan (%)
Place of birth for the foreign-born population - Other Northern Africa (%)
Place of birth for the foreign-born population - South Africa (%)
Place of birth for the foreign-born population - Other Southern Africa (%)
Place of birth for the foreign-born population - Cabo Verde (%)
Place of birth for the foreign-born population - Ghana (%)
Place of birth for the foreign-born population - Liberia (%)
Place of birth for the foreign-born population - Nigeria (%)
Place of birth for the foreign-born population - Senegal (%)
Place of birth for the foreign-born population - Sierra Leone (%)
Place of birth for the foreign-born population - Other Western Africa (%)
Place of birth for the foreign-born population - Australia (%)
Place of birth for the foreign-born population - New Zealand (%)
Place of birth for the foreign-born population - Fiji (%)
Place of birth for the foreign-born population - Micronesia (%)
Place of birth for the foreign-born population - Bahamas (%)
Place of birth for the foreign-born population - Barbados (%)
Place of birth for the foreign-born population - Cuba (%)
Place of birth for the foreign-born population - Dominica (%)
Place of birth for the foreign-born population - Dominican Republic (%)
Place of birth for the foreign-born population - Grenada (%)
Place of birth for the foreign-born population - Haiti (%)
Place of birth for the foreign-born population - Jamaica (%)
Place of birth for the foreign-born population - St. Vincent and the Grenadines (%)
Place of birth for the foreign-born population - Trinidad and Tobago (%)
Place of birth for the foreign-born population - West Indies (%)
Place of birth for the foreign-born population - Other Caribbean (%)
Place of birth for the foreign-born population - Belize (%)
Place of birth for the foreign-born population - Costa Rica (%)
Place of birth for the foreign-born population - El Salvador (%)
Place of birth for the foreign-born population - Guatemala (%)
Place of birth for the foreign-born population - Honduras (%)
Place of birth for the foreign-born population - Mexico (%)
Place of birth for the foreign-born population - Nicaragua (%)
Place of birth for the foreign-born population - Panama (%)
Place of birth for the foreign-born population - Other Central America (%)
Place of birth for the foreign-born population - Argentina (%)
Place of birth for the foreign-born population - Bolivia (%)
Place of birth for the foreign-born population - Brazil (%)
Place of birth for the foreign-born population - Chile (%)
Place of birth for the foreign-born population - Colombia (%)
Place of birth for the foreign-born population - Ecuador (%)
Place of birth for the foreign-born population - Guyana (%)
Place of birth for the foreign-born population - Peru (%)
Place of birth for the foreign-born population - Uruguay (%)
Place of birth for the foreign-born population - Venezuela (%)
Place of birth for the foreign-born population - Other South America (%)
Place of birth for the foreign-born population - Canada (%)
Place of birth for the foreign-born population - Other Northern America (%)
Place of birth for the foreign-born population - Other (%)
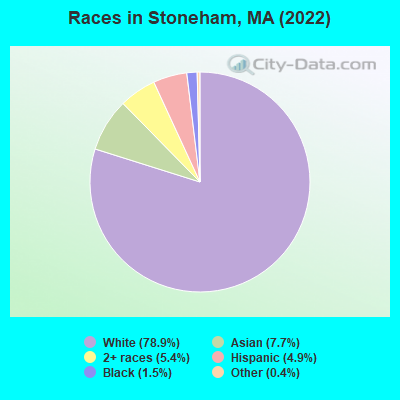
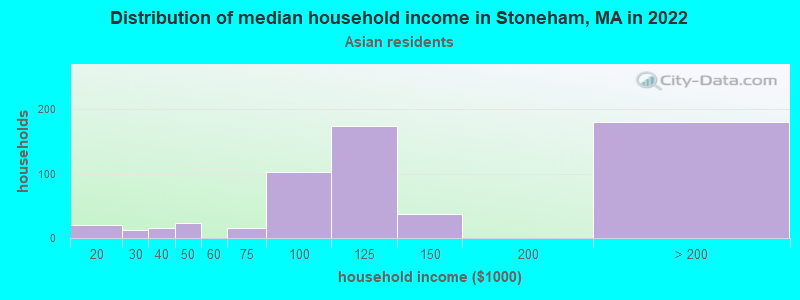
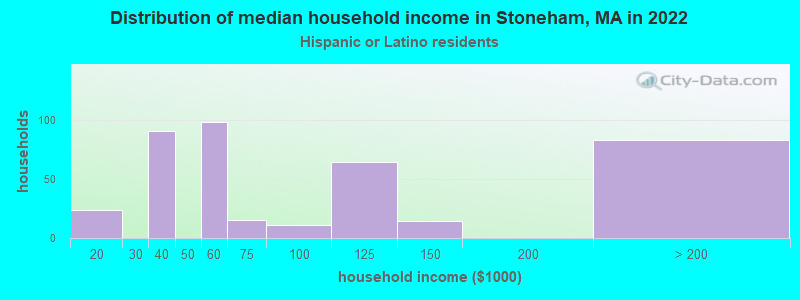
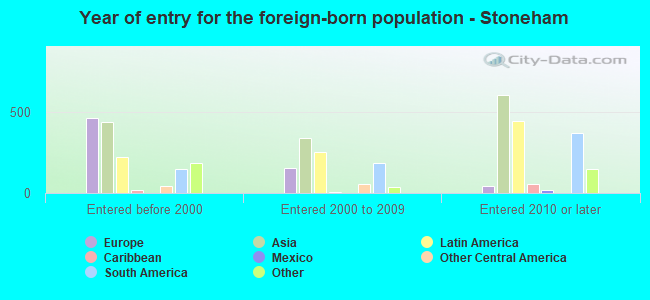
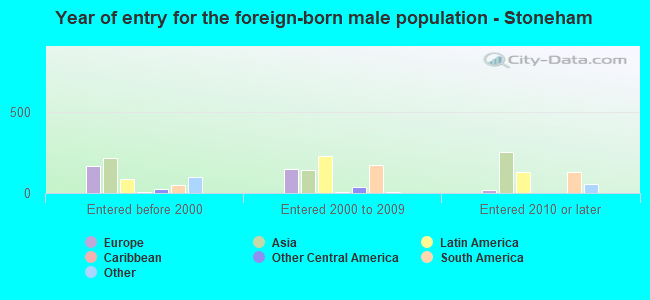
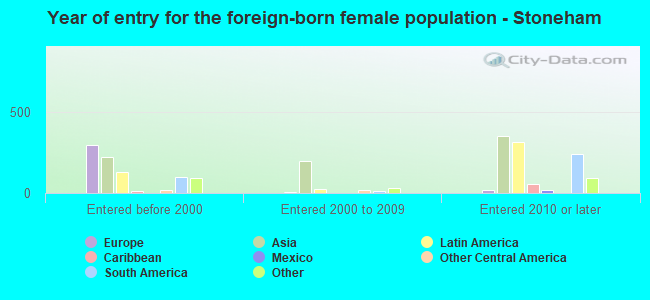
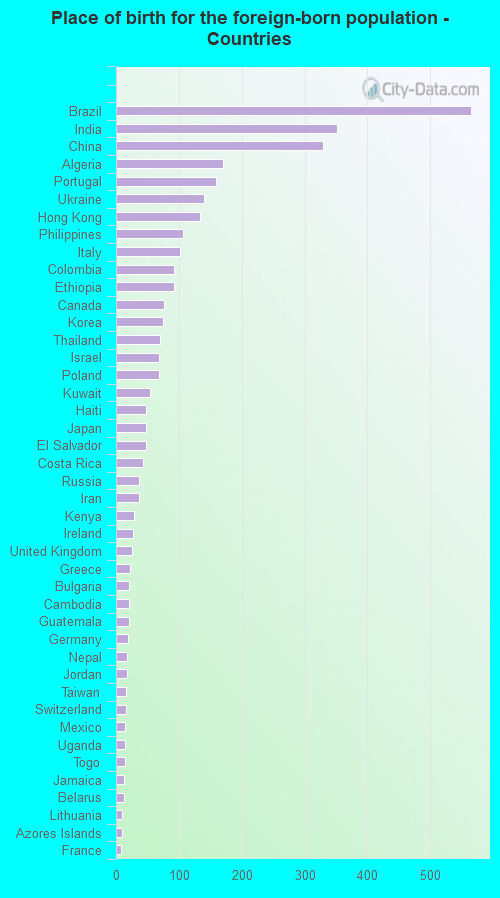
According to 2022 data, the most numerous races in Stoneham, MA are White alone (18,063 residents), Hispanic (1,129 residents), and Asian alone (1,775 residents). 79.0% of Stoneham residents speak English at home. 14.6% of Stoneham, MA residents are foreign-born (5.9% born in Asia, 3.6% born in Latin America, 2.8% born in Europe), which is 23.3% less than the foreign-born rate of 18.0% across the entire state of Massachusetts.
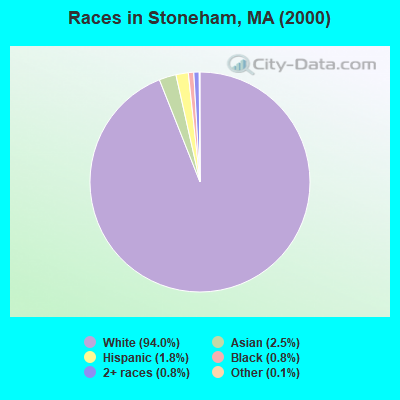
Race distribution in Stoneham
2000 2022
5,198,359 81.9% White alone 428,729 6.8% Hispanic 318,329 5.0% Black alone 236,786 3.7% Asian alone 110,338 1.7% Two or more races 43,586 0.7% Other race alone 11,264 0.2% American Indian alone 1,706 0.03% Native Hawaiian and Other
4,676,627 67.0% White alone 911,038 13.0% Hispanic 501,463 7.2% Asian alone 459,740 6.6% Black alone 341,889 4.9% Two or more races 84,403 1.2% Other race alone 5,838 0.08% American Indian alone 976 0.01% Native Hawaiian and Other
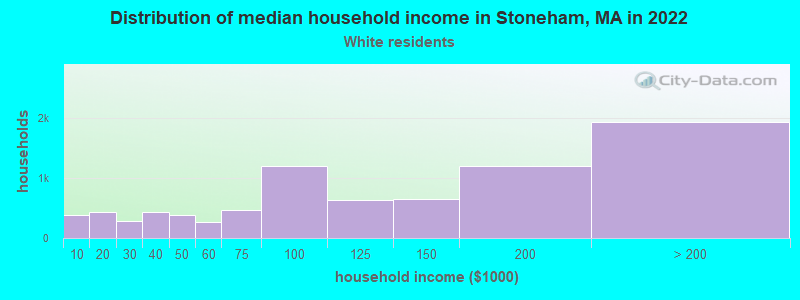
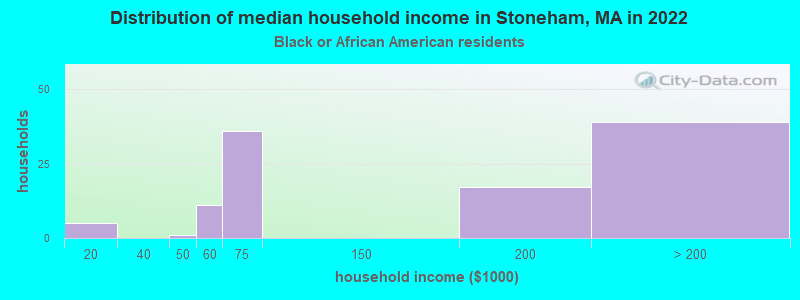
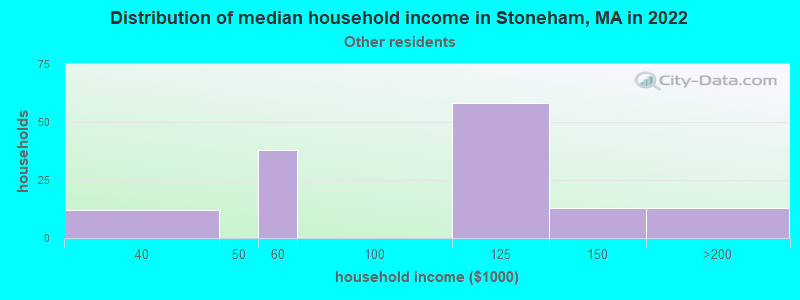
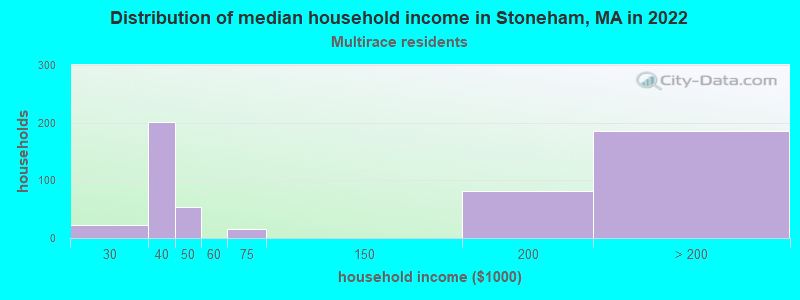
Income and house value in Stoneham Median household income in 2022 $112,978 White non-Hispanic householders$105,388 Asian householders$99,708 Some other race householders$57,870 Hispanic or Latino race householdersMedian 2022 house value $680,549 White Non-Hispanic householders$555,786 Black or African American householders$635,103 American Indian or Alaska Native householders $923,017 Asian householders$529,253 Some other race householders$642,160 Two or more races householders$560,020 Hispanic or Latino householders
Median age by race in Stoneham
45.3 Median age for White residents44.3 46.8 35.1 Median age for Black or African American residents29.3 35.1 -761,044,175.9 Median age for American Indian / Alaska Native residents-751,004,015.3 -1,078,313,251.9 36.6 Median age for Asian residents38.6 35.0 -514,227,641.8 Median age for Native Hawaiian / Pacific Islander residents-513,131,312.6 -508,717,948.2 31.2 Median age for Other race residents38.7 30.0 28.0 Median age for Two or more races residents20.7 28.7 45.2 Median age for White alone residents43.8 46.9 26.8 Median age for Hispanic or Latino residents29.1 26.5
Owner/renter occupied households by race in Stoneham
House owners and renters - White residents 5,791 70.0% Owner occupied2,486 30.0% Renter occupiedHouse owners and renters - Black or African American residents 64 60.2% Owner occupied42 39.8% Renter occupiedHouse owners and renters - Asian residents 352 62.3% Owner occupied213 37.7% Renter occupiedHouse owners and renters - Other race residents 95 56.9% Owner occupied72 43.1% Renter occupiedHouse owners and renters - Two or more races residents 249 43.4% Owner occupied324 56.6% Renter occupiedHouse owners and renters - White alone residents 5,795 70.4% Owner occupied2,437 29.6% Renter occupiedHouse owners and renters - Hispanic or Latino residents 109 24.6% Owner occupied336 75.4% Renter occupied
Language usage in Stoneham
English speakers - Total 79.0% of residents of Stoneham speak English at home.
3.0% of residents speak Spanish at home 338 53.1% Speak English very well299 46.9% Speak English less than very well17.5% of residents speak other language at home 2,455 65.0% Speak English very well1,323 35.0% Speak English less than very well
English speakers - Born in the United States 93.5% of residents of Stoneham speak English at home.
1.6% of residents speak Spanish at home 45 97.8% Speak English very well1 2.2% Speak English less than very well4.7% of residents speak other language at home 78 57.8% Speak English very well57 42.2% Speak English less than very well
English speakers - Native, born elsewhere 14.4% of residents of Stoneham speak English at home.
62.5% of residents speak Spanish at home 94 47.0% Speak English very well106 53.0% Speak English less than very well31.2% of residents speak other language at home 48 48.0% Speak English very well52 52.0% Speak English less than very well
English speakers - Foreign-born 14.4% of residents of Stoneham speak English at home.
7.2% of residents speak Spanish at home 100 41.5% Speak English very well141 58.5% Speak English less than very well78.4% of residents speak other language at home 1,471 56.1% Speak English very well1,151 43.9% Speak English less than very well
White (Caucasian) - Speak only English Native:
95.4% (15,227)Foreign-born:
22.5% (297)
White (Caucasian) - Speak another language Native:
4.7% (751)Foreign-born:
77.6% (1,023)
Black or African American - Speak only English Native:
83.0% (123)Foreign-born:
7.4% (12)
Black or African American - Speak another language Native:
15.9% (24)Foreign-born:
91.6% (149)
Asian - Speak only English Native:
53.2% (261)Foreign-born:
12.2% (142)
Asian - Speak another language Native:
46.8% (230)Foreign-born:
87.6% (1,018)
Other race - Speak another language Native:
57.1% (120)Foreign-born:
99.3% (266)
Two or more races - Speak only English Native:
69.0% (758)Foreign-born:
4.0% (14)
Two or more races - Speak another language Native:
31.0% (340)Foreign-born:
96.3% (334)
White alone - Speak only English Native:
95.2% (15,088)Foreign-born:
22.6% (297)
White alone - Speak another language Native:
4.8% (753)Foreign-born:
77.8% (1,022)
Hispanic or Latino - Speak another language Native:
46.9% (328)Foreign-born:
100.0% (335)
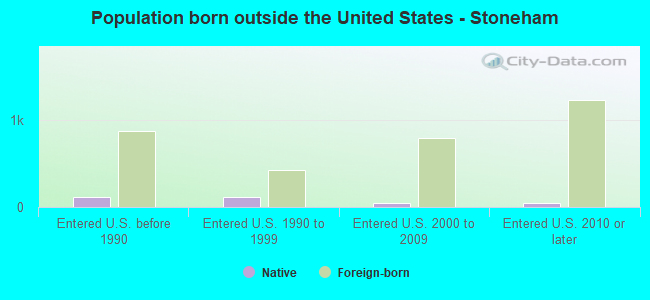
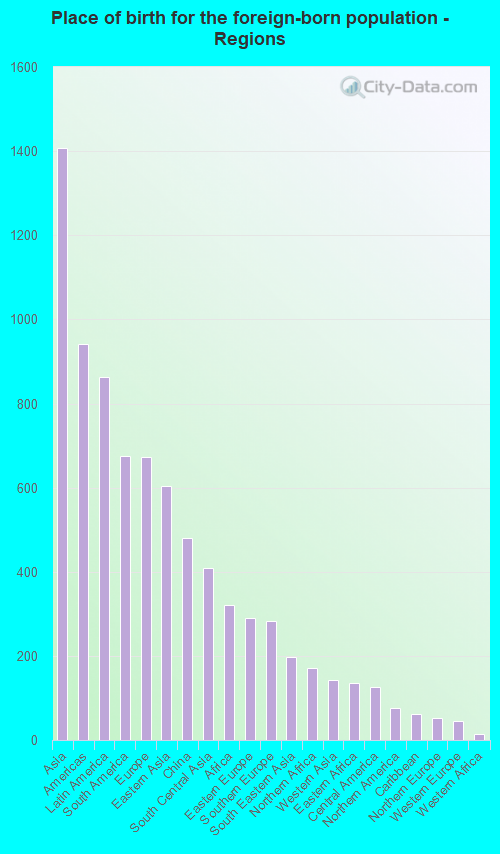
Foreign-born residents in Stoneham 3,344 residents are foreign born (5.9% Asia , 3.6% Latin America , 2.8% Europe ).
This city:
14.6%Massachusetts:
17.6%
Marital status for residents in Stoneham Marital status - White (Caucasian) population 15 years and over
Males 28.2% Never married57.6% Now married0.3% Separated3.3% Widowed10.6% DivorcedFemales 25.1% Never married53.5% Now married2.0% Separated11.6% Widowed7.7% DivorcedWomen who gave birth in the past 12 months Now married:
100.0% (305)Unmarried:
0.0% (0)
Women who did not give birth in the past 12 months Now married:
52.8% (1,708)Unmarried:
47.2% (1,528)
Marital status - Black or African American population 15 years and over
Males 42.5% Never married48.8% Now married0.0% Separated0.8% Widowed7.9% DivorcedFemales 19.6% Never married51.9% Now married0.0% Separated17.1% Widowed11.4% DivorcedWomen who did not give birth in the past 12 months Now married:
69.7% (67)Unmarried:
30.3% (29)
Marital status - Asian population 15 years and over
Males 17.1% Never married74.1% Now married8.8% Separated0.0% Widowed0.0% DivorcedFemales 25.3% Never married64.5% Now married0.0% Separated1.0% Widowed9.2% DivorcedWomen who did not give birth in the past 12 months Now married:
67.1% (420)Unmarried:
32.9% (207)
Marital status - Other race population 15 years and over
Males 13.1% Never married86.9% Now married0.0% Separated0.0% Widowed0.0% DivorcedFemales 29.9% Never married45.9% Now married0.0% Separated0.0% Widowed24.2% DivorcedWomen who gave birth in the past 12 months Now married:
53.6% (18)Unmarried:
46.4% (15)
Women who did not give birth in the past 12 months Now married:
36.8% (57)Unmarried:
63.2% (98)
Marital status - Two or more races population 15 years and over
Males 52.9% Never married47.1% Now married0.0% Separated0.0% Widowed0.0% DivorcedFemales 60.9% Never married39.1% Now married0.0% Separated0.0% Widowed0.0% DivorcedWomen who gave birth in the past 12 months Now married:
100.0% (67)Unmarried:
0.0% (0)
Women who did not give birth in the past 12 months Now married:
29.2% (146)Unmarried:
70.8% (354)
Marital status - White alone, not Hispanic / Latino population 15 years and over
Males 28.2% Never married57.9% Now married0.3% Separated3.3% Widowed10.3% DivorcedFemales 24.4% Never married54.8% Now married1.2% Separated11.6% Widowed8.0% DivorcedWomen who gave birth in the past 12 months Now married:
100.0% (311)Unmarried:
0.0% (0)
Women who did not give birth in the past 12 months Now married:
54.0% (1,722)Unmarried:
46.0% (1,469)
Marital status - Hispanic or Latino population 15 years and over
Males 31.0% Never married55.2% Now married0.0% Separated0.0% Widowed13.8% DivorcedFemales 52.8% Never married21.6% Now married11.6% Separated4.2% Widowed9.8% DivorcedWomen who gave birth in the past 12 months Now married:
63.9% (24)Unmarried:
36.1% (13)
Women who did not give birth in the past 12 months Now married:
20.7% (76)Unmarried:
79.3% (290)
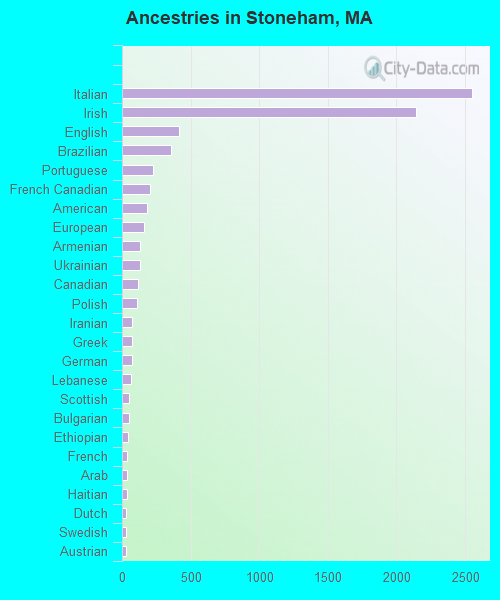
Ancestries in Stoneham
2,547 24.1% Italian2,140 20.3% Irish419 4.0% English355 3.4% Brazilian223 2.1% Portuguese205 1.9% French Canadian184 1.7% American157 1.5% European128 1.2% Armenian128 1.2% Ukrainian118 1.1% Canadian109 1.0% Polish74 0.7% Iranian73 0.7% Greek71 0.7% German62 0.6% Lebanese54 0.5% Scottish53 0.5% Bulgarian46 0.4% Ethiopian40 0.4% French34 0.3% Arab33 0.3% Haitian31 0.3% Dutch30 0.3% Swedish28 0.3% Austrian25 0.2% Northern European24 0.2% Russian23 0.2% Scotch-Irish18 0.2% Lithuanian13 0.1% Eastern European12 0.1% Kenyan8 0.08% Palestinian7 0.07% Slovak5 0.05% Celtic4 0.04% British
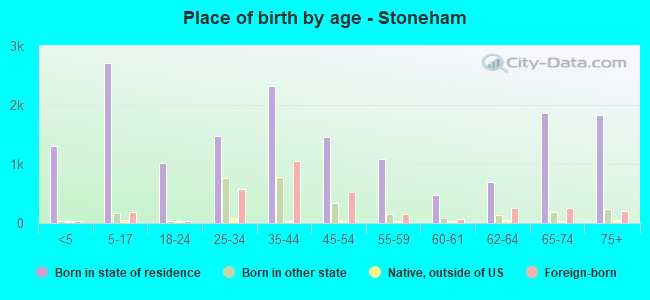
Children Nativity (place of birth) in Stoneham
Children under 6 years - Living with two parents Both parents native 1,106 100.0% NativeBoth parents foreign-born 228 100.0% NativeOne native, one foreign-born parent 90 100.0% NativeChildren under 6 years - Living with one parent Native parent 141 100.0% NativeChildren 6 to 17 years - Living with two parents Both parents native 1,438 99.0% Native15 1.0% Foreign-bornBoth parents foreign-born 485 82.7% Native102 17.3% Foreign-bornOne native, one foreign-born parent 172 100.0% NativeChildren 6 to 17 years - Living with one parent Native parent 398 90.1% Native44 9.9% Foreign-bornForeign-born parent 68 78.8% Native18 21.2% Foreign-born
Grandparents responsible for own grandchildren in Stoneham
Grandparents (30 to 59 years) White / Caucasian 45 100.0% Not responsible for grandchildrenOther race 47 100.0% Not responsible for grandchildrenWhite alone, not Hispanic / Latino 50 100.0% Not responsible for grandchildrenHispanic or Latino 13 100.0% Not responsible for grandchildrenGrandparents (60 years and over) White / Caucasian 59 42.1% Responsible for grandchildren82 57.9% Not responsible for grandchildrenWhite alone, not Hispanic / Latino 60 42.4% Responsible for grandchildren81 57.6% Not responsible for grandchildren