Races in Stony Point, New York (NY) Detailed Stats
Data:
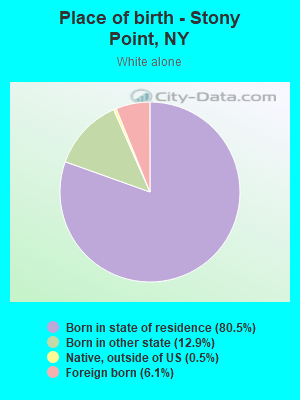
Races - White alone (%)
Races - White alone (% change since 2000)
Races - Black alone (%)
Races - Black alone (% change since 2000)
Races - American Indian alone (%)
Races - American Indian alone (% change since 2000)
Races - Asian alone (%)
Races - Asian alone (% change since 2000)
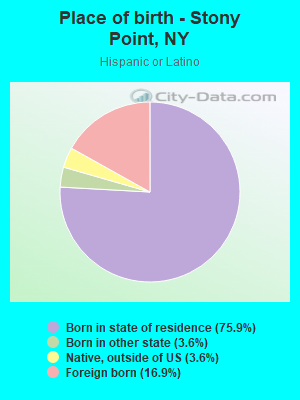
Races - Hispanic (%)
Races - Hispanic (% change since 2000)
Races - Native Hawaiian and Other Pacific Islander alone (%)
Races - Native Hawaiian and Other Pacific Islander alone (% change since 2000)
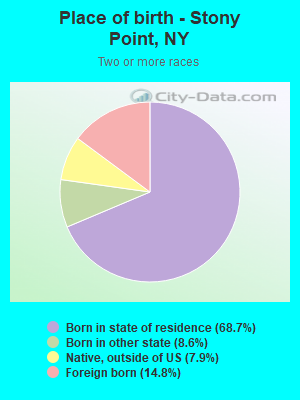
Races - Two or more races(%)
Races - Two or more races(% change since 2000)
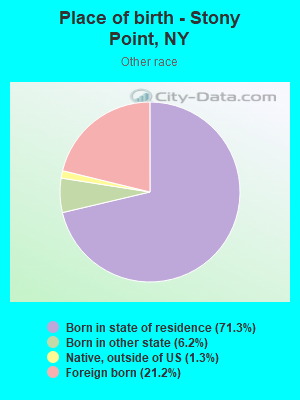
Races - Other race alone (%)
Races - Other race alone (% change since 2000)
Racial diversity
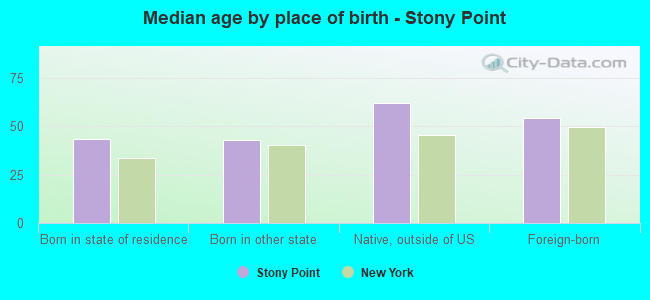
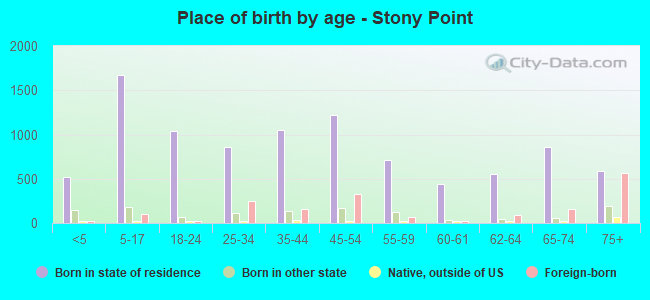
Place of birth - Born in state of residence (%)
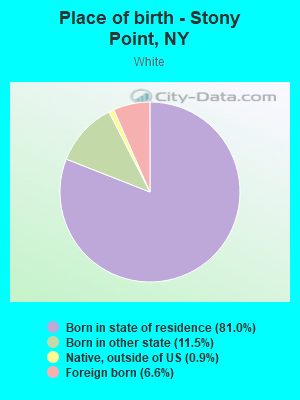
Place of birth - Born in state of residence (%) - White
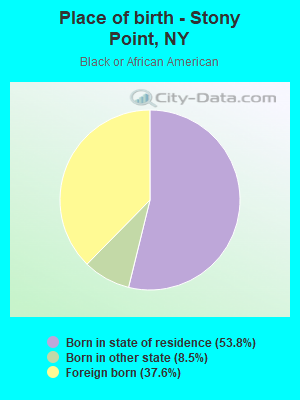
Place of birth - Born in state of residence (%) - Black or African American
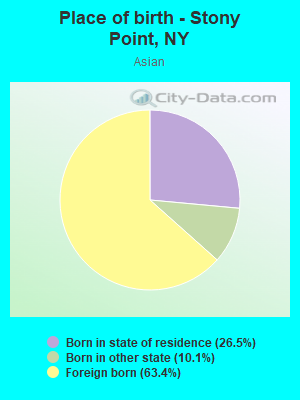
Place of birth - Born in state of residence (%) - Asian
Place of birth - Born in state of residence (%) - Hispanic or Latino
Place of birth - Born in state of residence (%) - American Indian and Alaska Native
Place of birth - Born in state of residence (%) - Multirace
Place of birth - Born in state of residence (%) - Other Race
Place of birth - Born in other state (%)
Place of birth - Born in other state (%) - White
Place of birth - Born in other state (%) - Black or African American
Place of birth - Born in other state (%) - Asian
Place of birth - Born in other state (%) - Hispanic or Latino
Place of birth - Born in other state (%) - American Indian and Alaska Native
Place of birth - Born in other state (%) - Multirace
Place of birth - Born in other state (%) - Other Race
Place of birth - Native, outside of US (%)
Place of birth - Native, outside of US (%) - White
Place of birth - Native, outside of US (%) - Black or African American
Place of birth - Native, outside of US (%) - Asian
Place of birth - Native, outside of US (%) - Hispanic or Latino
Place of birth - Native, outside of US (%) - American Indian and Alaska Native
Place of birth - Native, outside of US (%) - Multirace
Place of birth - Native, outside of US (%) - Other Race
Place of birth - Foreign born (%)
Place of birth - Foreign born (%) - White
Place of birth - Foreign born (%) - Black or African American
Place of birth - Foreign born (%) - Asian
Place of birth - Foreign born (%) - Hispanic or Latino
Place of birth - Foreign born (%) - American Indian and Alaska Native
Place of birth - Foreign born (%) - Multirace
Place of birth - Foreign born (%) - Other Race
Residents speaking English at home (%)
Residents speaking English at home - Born in the United States (%)
Residents speaking English at home - Native, born elsewhere (%)
Residents speaking English at home - Foreign born (%)
Residents speaking Spanish at home (%)
Residents speaking Spanish at home - Born in the United States (%)
Residents speaking Spanish at home - Native, born elsewhere (%)
Residents speaking Spanish at home - Foreign born (%)
Residents speaking other language at home (%)
Residents speaking other language at home - Born in the United States (%)
Residents speaking other language at home - Native, born elsewhere (%)
Residents speaking other language at home - Foreign born (%)
Marital status - Never married (%)
Marital status - Now married (%)
Marital status - Separated (%)
Marital status - Widowed (%)
Marital status - Divorced (%)
Ancestries Reported - Arab (%)
Ancestries Reported - Czech (%)
Ancestries Reported - Danish (%)
Ancestries Reported - Dutch (%)
Ancestries Reported - English (%)
Ancestries Reported - French (%)
Ancestries Reported - French Canadian (%)
Ancestries Reported - German (%)
Ancestries Reported - Greek (%)
Ancestries Reported - Hungarian (%)
Ancestries Reported - Irish (%)
Ancestries Reported - Italian (%)
Ancestries Reported - Lithuanian (%)
Ancestries Reported - Norwegian (%)
Ancestries Reported - Polish (%)
Ancestries Reported - Portuguese (%)
Ancestries Reported - Russian (%)
Ancestries Reported - Scotch-Irish (%)
Ancestries Reported - Scottish (%)
Ancestries Reported - Slovak (%)
Ancestries Reported - Subsaharan African (%)
Ancestries Reported - Swedish (%)
Ancestries Reported - Swiss (%)
Ancestries Reported - Ukrainian (%)
Ancestries Reported - United States (%)
Ancestries Reported - Welsh (%)
Ancestries Reported - West Indian (%)
Ancestries Reported - Other (%)
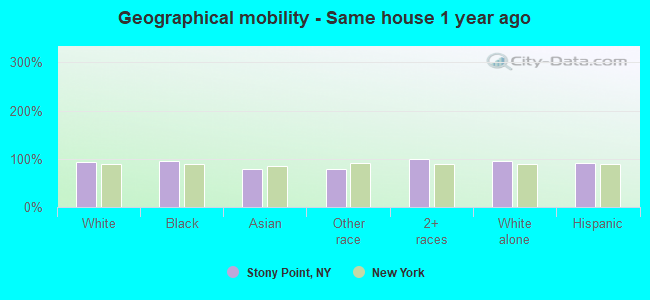
Geographical mobility - Same house 1 year ago (%)
Geographical mobility - Same house 1 year ago (%) - White
Geographical mobility - Same house 1 year ago (%) - Black or African American
Geographical mobility - Same house 1 year ago (%) - Asian
Geographical mobility - Same house 1 year ago (%) - Hispanic or Latino
Geographical mobility - Same house 1 year ago (%) - American Indian and Alaska Native
Geographical mobility - Same house 1 year ago (%) - Multirace
Geographical mobility - Same house 1 year ago (%) - Other Race
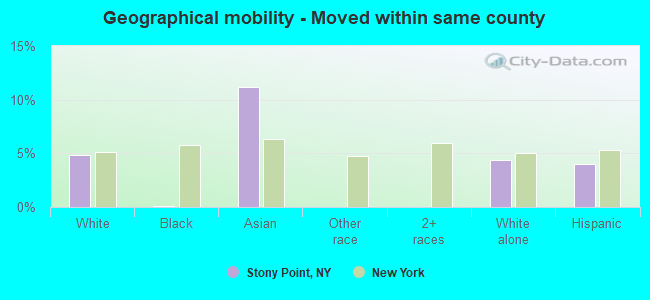
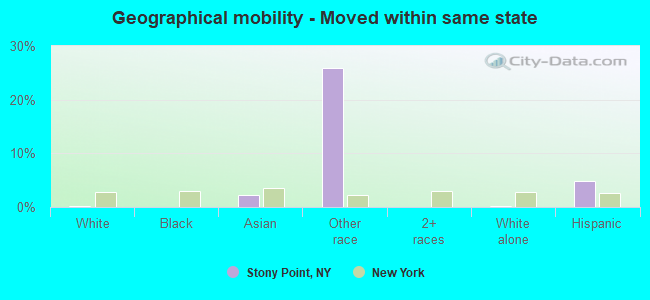
Geographical mobility - Moved within same county (%)
Geographical mobility - Moved within same county (%) - White
Geographical mobility - Moved within same county (%) - Black or African American
Geographical mobility - Moved within same county (%) - Asian
Geographical mobility - Moved within same county (%) - Hispanic or Latino
Geographical mobility - Moved within same county (%) - American Indian and Alaska Native
Geographical mobility - Moved within same county (%) - Multirace
Geographical mobility - Moved within same county (%) - Other Race
Geographical mobility - Moved from different county within same state (%)
Geographical mobility - Moved from different county within same state (%) - White
Geographical mobility - Moved from different county within same state (%) - Black or African American
Geographical mobility - Moved from different county within same state (%) - Asian
Geographical mobility - Moved from different county within same state (%) - Hispanic or Latino
Geographical mobility - Moved from different county within same state (%) - American Indian and Alaska Native
Geographical mobility - Moved from different county within same state (%) - Multirace
Geographical mobility - Moved from different county within same state (%) - Other Race
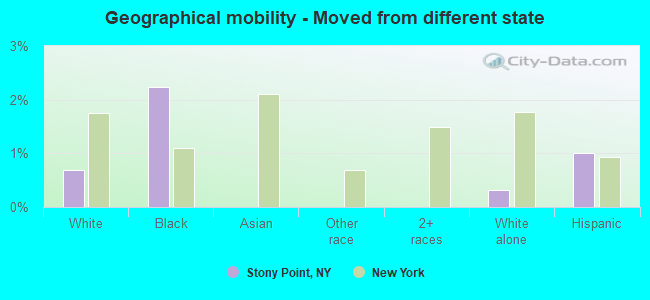
Geographical mobility - Moved from different state (%)
Geographical mobility - Moved from different state (%) - White
Geographical mobility - Moved from different state (%) - Black or African American
Geographical mobility - Moved from different state (%) - Asian
Geographical mobility - Moved from different state (%) - Hispanic or Latino
Geographical mobility - Moved from different state (%) - American Indian and Alaska Native
Geographical mobility - Moved from different state (%) - Multirace
Geographical mobility - Moved from different state (%) - Other Race
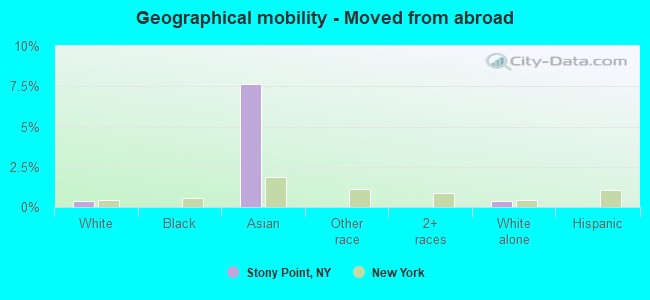
Geographical mobility - Moved from abroad (%)
Geographical mobility - Moved from abroad (%) - White
Geographical mobility - Moved from abroad (%) - Black or African American
Geographical mobility - Moved from abroad (%) - Asian
Geographical mobility - Moved from abroad (%) - Hispanic or Latino
Geographical mobility - Moved from abroad (%) - American Indian and Alaska Native
Geographical mobility - Moved from abroad (%) - Multirace
Geographical mobility - Moved from abroad (%) - Other Race
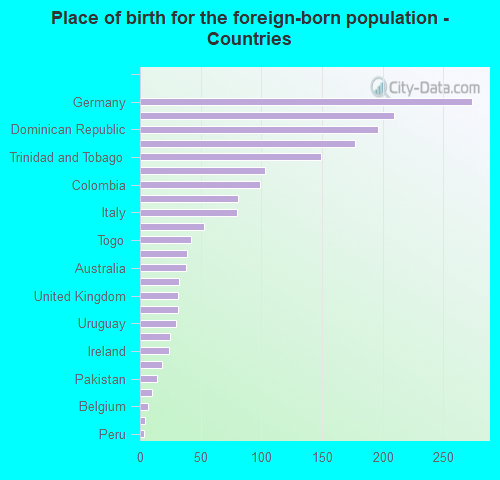
Place of birth for the foreign-born population - Ireland (%)
Place of birth for the foreign-born population - Denmark (%)
Place of birth for the foreign-born population - Norway (%)
Place of birth for the foreign-born population - Sweden (%)
Place of birth for the foreign-born population - United Kingdom (%)
Place of birth for the foreign-born population - England (%)
Place of birth for the foreign-born population - Scotland (%)
Place of birth for the foreign-born population - Other Northern Europe (%)
Place of birth for the foreign-born population - Austria (%)
Place of birth for the foreign-born population - Belgium (%)
Place of birth for the foreign-born population - France (%)
Place of birth for the foreign-born population - Germany (%)
Place of birth for the foreign-born population - Netherlands (%)
Place of birth for the foreign-born population - Switzerland (%)
Place of birth for the foreign-born population - Other Western Europe (%)
Place of birth for the foreign-born population - Greece (%)
Place of birth for the foreign-born population - Italy (%)
Place of birth for the foreign-born population - Portugal (%)
Place of birth for the foreign-born population - Spain (%)
Place of birth for the foreign-born population - Other Southern Europe (%)
Place of birth for the foreign-born population - Albania (%)
Place of birth for the foreign-born population - Belarus (%)
Place of birth for the foreign-born population - Bosnia and Herzegovina (%)
Place of birth for the foreign-born population - Bulgaria (%)
Place of birth for the foreign-born population - Croatia (%)
Place of birth for the foreign-born population - Czechoslovakia (%)
Place of birth for the foreign-born population - Hungary (%)
Place of birth for the foreign-born population - Latvia (%)
Place of birth for the foreign-born population - Lithuania (%)
Place of birth for the foreign-born population - North Macedonia (Macedonia) (%)
Place of birth for the foreign-born population - Moldova (%)
Place of birth for the foreign-born population - Poland (%)
Place of birth for the foreign-born population - Romania (%)
Place of birth for the foreign-born population - Russia (%)
Place of birth for the foreign-born population - Serbia (%)
Place of birth for the foreign-born population - Ukraine (%)
Place of birth for the foreign-born population - Other Eastern Europe (%)
Place of birth for the foreign-born population - China (%)
Place of birth for the foreign-born population - Hong Kong (%)
Place of birth for the foreign-born population - Taiwan (%)
Place of birth for the foreign-born population - Japan (%)
Place of birth for the foreign-born population - Korea (%)
Place of birth for the foreign-born population - Other Eastern Asia (%)
Place of birth for the foreign-born population - Afghanistan (%)
Place of birth for the foreign-born population - Bangladesh (%)
Place of birth for the foreign-born population - India (%)
Place of birth for the foreign-born population - Iran (%)
Place of birth for the foreign-born population - Kazakhstan (%)
Place of birth for the foreign-born population - Nepal (%)
Place of birth for the foreign-born population - Pakistan (%)
Place of birth for the foreign-born population - Sri Lanka (%)
Place of birth for the foreign-born population - Uzbekistan (%)
Place of birth for the foreign-born population - Other South Central Asia (%)
Place of birth for the foreign-born population - Burma (%)
Place of birth for the foreign-born population - Cambodia (%)
Place of birth for the foreign-born population - Indonesia (%)
Place of birth for the foreign-born population - Laos (%)
Place of birth for the foreign-born population - Malaysia (%)
Place of birth for the foreign-born population - Philippines (%)
Place of birth for the foreign-born population - Singapore (%)
Place of birth for the foreign-born population - Thailand (%)
Place of birth for the foreign-born population - Vietnam (%)
Place of birth for the foreign-born population - Other South Eastern Asia (%)
Place of birth for the foreign-born population - Armenia (%)
Place of birth for the foreign-born population - Iraq (%)
Place of birth for the foreign-born population - Israel (%)
Place of birth for the foreign-born population - Jordan (%)
Place of birth for the foreign-born population - Kuwait (%)
Place of birth for the foreign-born population - Lebanon (%)
Place of birth for the foreign-born population - Saudi Arabia (%)
Place of birth for the foreign-born population - Syria (%)
Place of birth for the foreign-born population - Turkey (%)
Place of birth for the foreign-born population - Yemen (%)
Place of birth for the foreign-born population - Other Western Asia (%)
Place of birth for the foreign-born population - Eritrea (%)
Place of birth for the foreign-born population - Ethiopia (%)
Place of birth for the foreign-born population - Kenya (%)
Place of birth for the foreign-born population - Somalia (%)
Place of birth for the foreign-born population - Uganda (%)
Place of birth for the foreign-born population - Zimbabwe (%)
Place of birth for the foreign-born population - Other Eastern Africa (%)
Place of birth for the foreign-born population - Cameroon (%)
Place of birth for the foreign-born population - Congo (%)
Place of birth for the foreign-born population - Democratic Republic of Congo (Zaire) (%)
Place of birth for the foreign-born population - Other Middle Africa (%)
Place of birth for the foreign-born population - Egypt (%)
Place of birth for the foreign-born population - Morocco (%)
Place of birth for the foreign-born population - Sudan (%)
Place of birth for the foreign-born population - Other Northern Africa (%)
Place of birth for the foreign-born population - South Africa (%)
Place of birth for the foreign-born population - Other Southern Africa (%)
Place of birth for the foreign-born population - Cabo Verde (%)
Place of birth for the foreign-born population - Ghana (%)
Place of birth for the foreign-born population - Liberia (%)
Place of birth for the foreign-born population - Nigeria (%)
Place of birth for the foreign-born population - Senegal (%)
Place of birth for the foreign-born population - Sierra Leone (%)
Place of birth for the foreign-born population - Other Western Africa (%)
Place of birth for the foreign-born population - Australia (%)
Place of birth for the foreign-born population - New Zealand (%)
Place of birth for the foreign-born population - Fiji (%)
Place of birth for the foreign-born population - Micronesia (%)
Place of birth for the foreign-born population - Bahamas (%)
Place of birth for the foreign-born population - Barbados (%)
Place of birth for the foreign-born population - Cuba (%)
Place of birth for the foreign-born population - Dominica (%)
Place of birth for the foreign-born population - Dominican Republic (%)
Place of birth for the foreign-born population - Grenada (%)
Place of birth for the foreign-born population - Haiti (%)
Place of birth for the foreign-born population - Jamaica (%)
Place of birth for the foreign-born population - St. Vincent and the Grenadines (%)
Place of birth for the foreign-born population - Trinidad and Tobago (%)
Place of birth for the foreign-born population - West Indies (%)
Place of birth for the foreign-born population - Other Caribbean (%)
Place of birth for the foreign-born population - Belize (%)
Place of birth for the foreign-born population - Costa Rica (%)
Place of birth for the foreign-born population - El Salvador (%)
Place of birth for the foreign-born population - Guatemala (%)
Place of birth for the foreign-born population - Honduras (%)
Place of birth for the foreign-born population - Mexico (%)
Place of birth for the foreign-born population - Nicaragua (%)
Place of birth for the foreign-born population - Panama (%)
Place of birth for the foreign-born population - Other Central America (%)
Place of birth for the foreign-born population - Argentina (%)
Place of birth for the foreign-born population - Bolivia (%)
Place of birth for the foreign-born population - Brazil (%)
Place of birth for the foreign-born population - Chile (%)
Place of birth for the foreign-born population - Colombia (%)
Place of birth for the foreign-born population - Ecuador (%)
Place of birth for the foreign-born population - Guyana (%)
Place of birth for the foreign-born population - Peru (%)
Place of birth for the foreign-born population - Uruguay (%)
Place of birth for the foreign-born population - Venezuela (%)
Place of birth for the foreign-born population - Other South America (%)
Place of birth for the foreign-born population - Canada (%)
Place of birth for the foreign-born population - Other Northern America (%)
Place of birth for the foreign-born population - Other (%)
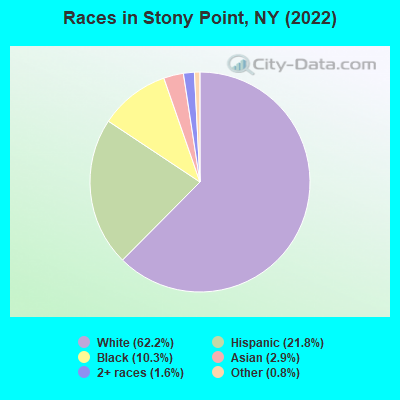
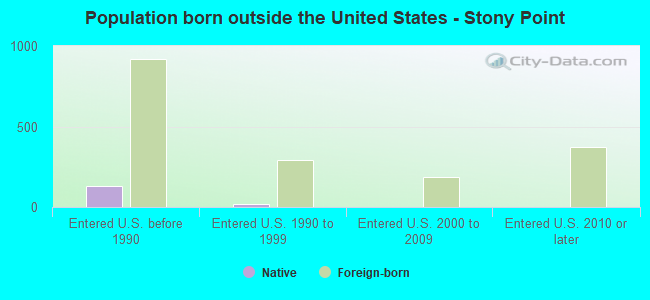
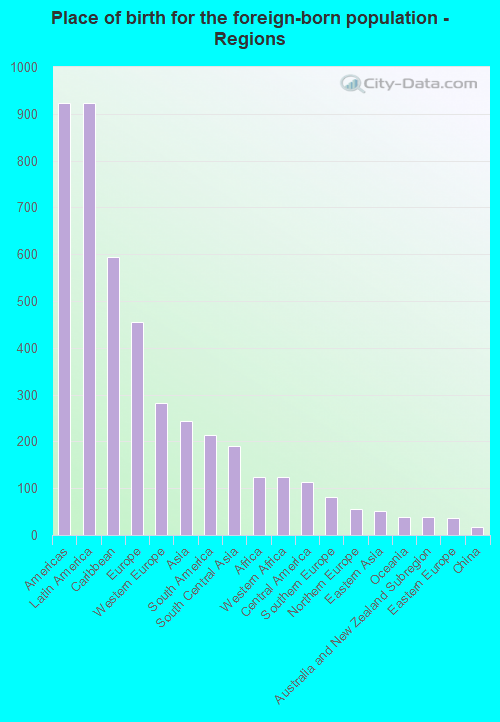
According to 2022 data, the most numerous races in Stony Point, NY are White alone (7,837 residents), Hispanic (2,751 residents), and Black alone (1,295 residents). 82.0% of Stony Point residents speak English at home. 14.2% of Stony Point, NY residents are foreign-born (7.5% born in Latin America, 3.7% born in Europe, 2.0% born in Asia), which is 55.1% less than the foreign-born rate of 22.0% across the entire state of New York.
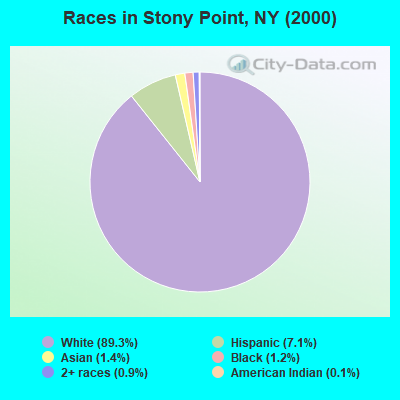
Race distribution in Stony Point
2000 2022
11,760,981 62.0% White alone 2,867,583 15.1% Hispanic 2,812,623 14.8% Black alone 1,035,926 5.5% Asian alone 366,116 1.9% Two or more races 75,499 0.4% Other race alone 52,499 0.3% American Indian alone 5,230 0.03% Native Hawaiian and Other
10,408,933 52.9% White alone 3,867,299 19.7% Hispanic 2,633,840 13.4% Black alone 1,776,286 9.0% Asian alone 732,670 3.7% Two or more races 216,110 1.1% Other race alone 35,082 0.2% American Indian alone 6,931 0.04% Native Hawaiian and Other
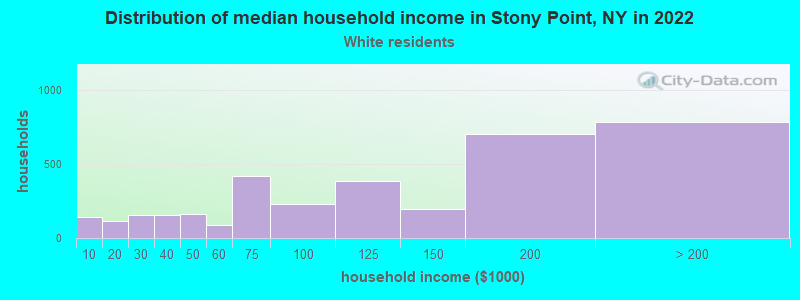
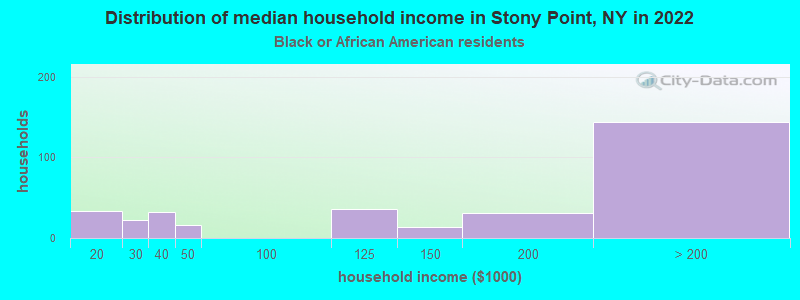
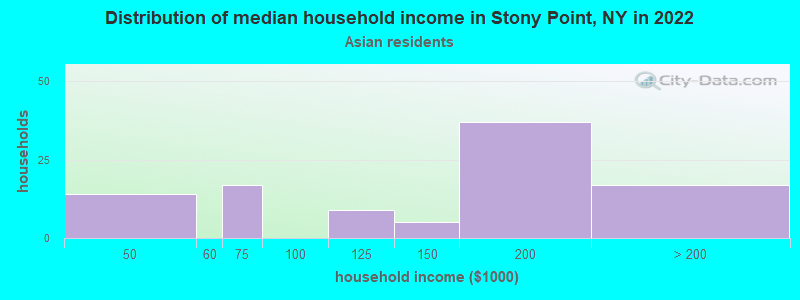
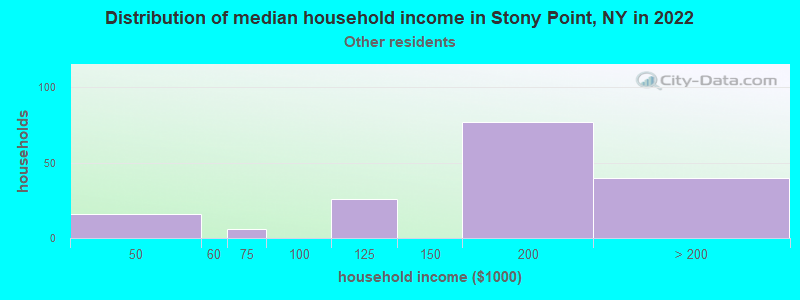
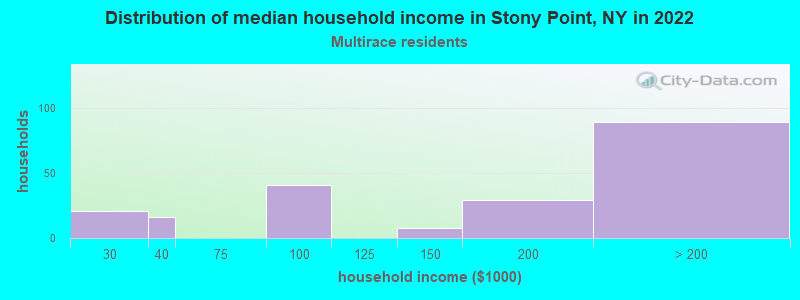
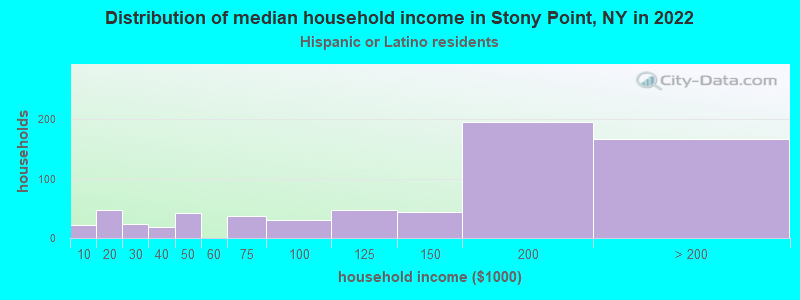
Income and house value in Stony Point Median household income in 2022 $116,520 White non-Hispanic householders$155,942 Black householders$170,959 Asian householders$153,764 Some other race householders$158,772 Two or more races householders$154,972 Hispanic or Latino race householdersMedian 2022 house value $479,645 White Non-Hispanic householders$757,839 Black or African American householders $538,728 Asian householders$466,127 Some other race householders$545,051 Two or more races householders$437,349 Hispanic or Latino householders
Median age by race in Stony Point
48.6 Median age for White residents46.3 51.2 39.0 Median age for Black or African American residents31.8 41.8 -666,666,666.0 Median age for American Indian / Alaska Native residents-750,656,167.2 -644,444,443.8 41.4 Median age for Asian residents35.2 47.3 -463,937,621.4 Median age for Native Hawaiian / Pacific Islander residents-649,572,648.9 -666,666,666.0 22.9 Median age for Other race residents16.8 25.4 26.5 Median age for Two or more races residents36.3 29.1 51.5 Median age for White alone residents47.1 54.6 27.6 Median age for Hispanic or Latino residents23.6 31.0
Owner/renter occupied households by race in Stony Point
House owners and renters - White residents 3,110 87.4% Owner occupied450 12.6% Renter occupiedHouse owners and renters - Black or African American residents 325 89.1% Owner occupied40 10.9% Renter occupiedHouse owners and renters - Asian residents 104 100.0% Owner occupiedHouse owners and renters - Other race residents 107 79.1% Owner occupied28 20.9% Renter occupiedHouse owners and renters - Two or more races residents 197 96.0% Owner occupied8 4.0% Renter occupiedHouse owners and renters - White alone residents 2,989 91.5% Owner occupied279 8.5% Renter occupiedHouse owners and renters - Hispanic or Latino residents 413 63.8% Owner occupied234 36.2% Renter occupied
Language usage in Stony Point
English speakers - Total 82.0% of residents of Stony Point speak English at home.
10.7% of residents speak Spanish at home 887 69.4% Speak English very well392 30.6% Speak English less than very well7.8% of residents speak other language at home 599 64.7% Speak English very well327 35.3% Speak English less than very well
English speakers - Born in the United States 97.4% of residents of Stony Point speak English at home.
6.4% of residents speak Spanish at home 57 78.1% Speak English very well16 21.9% Speak English less than very well0.7% of residents speak other language at home 8 100.0% Speak English very well
English speakers - Native, born elsewhere 21.2% of residents of Stony Point speak English at home.
76.9% of residents speak Spanish at home 92 76.7% Speak English very well28 23.3% Speak English less than very well7.1% of residents speak other language at home 11 100.0% Speak English very well
English speakers - Foreign-born 33.8% of residents of Stony Point speak English at home.
25.6% of residents speak Spanish at home 197 44.1% Speak English very well250 55.9% Speak English less than very well39.6% of residents speak other language at home 416 60.0% Speak English very well277 40.0% Speak English less than very well
White (Caucasian) - Speak only English Native:
95.3% (7,592)Foreign-born:
53.7% (320)
White (Caucasian) - Speak another language Native:
6.5% (516)Foreign-born:
50.8% (303)
Black or African American - Speak only English Native:
77.0% (587)Foreign-born:
39.1% (198)
Black or African American - Speak another language Native:
23.0% (175)Foreign-born:
59.2% (300)
Asian - Speak only English Native:
100.0% (103)Foreign-born:
5.7% (14)
Other race - Speak only English Native:
60.7% (310)Foreign-born:
8.4% (14)
Other race - Speak another language Native:
43.9% (224)Foreign-born:
89.4% (147)
Two or more races - Speak only English Native:
58.1% (434)Foreign-born:
1.2% (2)
Two or more races - Speak another language Native:
41.3% (309)Foreign-born:
95.3% (130)
White alone - Speak only English Native:
97.5% (6,866)Foreign-born:
63.1% (303)
White alone - Speak another language Native:
2.4% (167)Foreign-born:
38.9% (187)
Hispanic or Latino - Speak only English Native:
72.4% (1,532)Foreign-born:
8.1% (38)
Hispanic or Latino - Speak another language Native:
35.2% (745)Foreign-born:
92.2% (433)
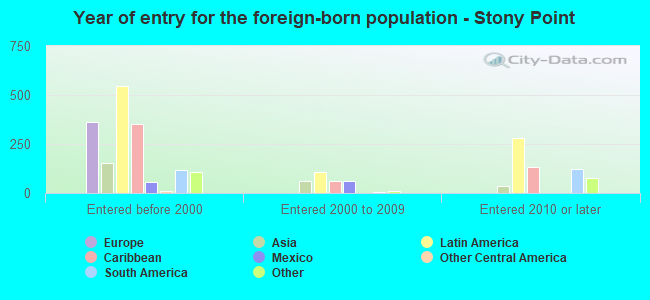
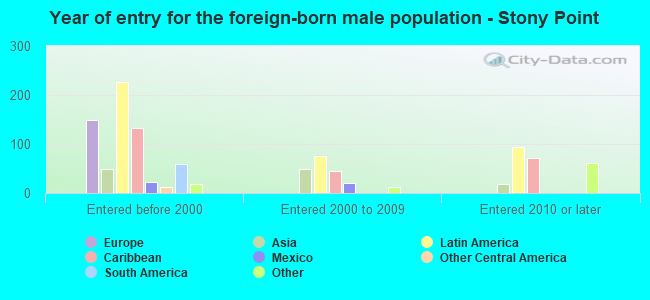
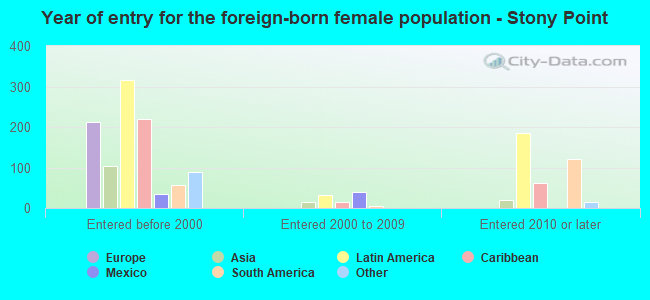
Foreign-born residents in Stony Point 1,787 residents are foreign born (7.5% Latin America , 3.7% Europe , 2.0% Asia ).
This city:
14.2%New York:
22.6%
Marital status for residents in Stony Point Marital status - White (Caucasian) population 15 years and over
Males 35.7% Never married53.3% Now married0.3% Separated2.8% Widowed7.9% DivorcedFemales 22.1% Never married54.3% Now married2.4% Separated10.2% Widowed11.1% DivorcedWomen who gave birth in the past 12 months Now married:
100.0% (78)Unmarried:
0.0% (0)
Women who did not give birth in the past 12 months Now married:
47.6% (726)Unmarried:
52.4% (799)
Marital status - Black or African American population 15 years and over
Males 26.8% Never married59.3% Now married2.7% Separated0.0% Widowed11.1% DivorcedFemales 27.4% Never married61.2% Now married0.0% Separated9.5% Widowed1.9% DivorcedWomen who gave birth in the past 12 months Now married:
100.0% (17)Unmarried:
0.0% (0)
Women who did not give birth in the past 12 months Now married:
56.0% (159)Unmarried:
44.0% (125)
Marital status - Asian population 15 years and over
Males 5.7% Never married94.3% Now married0.0% Separated0.0% Widowed0.0% DivorcedFemales 0.0% Never married100.0% Now married0.0% Separated0.0% Widowed0.0% DivorcedWomen who gave birth in the past 12 months Now married:
100.0% (29)Unmarried:
0.0% (0)
Women who did not give birth in the past 12 months Now married:
100.0% (44)Unmarried:
0.0% (0)
Marital status - Other race population 15 years and over
Males 57.8% Never married38.6% Now married0.0% Separated0.0% Widowed3.6% DivorcedFemales 35.6% Never married55.9% Now married0.0% Separated0.0% Widowed8.5% DivorcedWomen who did not give birth in the past 12 months Now married:
50.9% (82)Unmarried:
49.1% (79)
Marital status - Two or more races population 15 years and over
Males 29.5% Never married66.7% Now married0.0% Separated0.0% Widowed3.8% DivorcedFemales 36.7% Never married42.7% Now married0.0% Separated15.0% Widowed5.6% DivorcedWomen who did not give birth in the past 12 months Now married:
38.6% (101)Unmarried:
61.4% (161)
Marital status - White alone, not Hispanic / Latino population 15 years and over
Males 31.1% Never married57.2% Now married0.4% Separated2.9% Widowed8.4% DivorcedFemales 21.1% Never married56.1% Now married1.4% Separated10.8% Widowed10.6% DivorcedWomen who gave birth in the past 12 months Now married:
100.0% (28)Unmarried:
0.0% (0)
Women who did not give birth in the past 12 months Now married:
48.1% (612)Unmarried:
51.9% (659)
Marital status - Hispanic or Latino population 15 years and over
Males 55.3% Never married39.3% Now married0.0% Separated1.1% Widowed4.3% DivorcedFemales 30.7% Never married45.4% Now married4.9% Separated7.7% Widowed11.4% DivorcedWomen who gave birth in the past 12 months Now married:
100.0% (56)Unmarried:
0.0% (0)
Women who did not give birth in the past 12 months Now married:
45.9% (295)Unmarried:
54.1% (348)
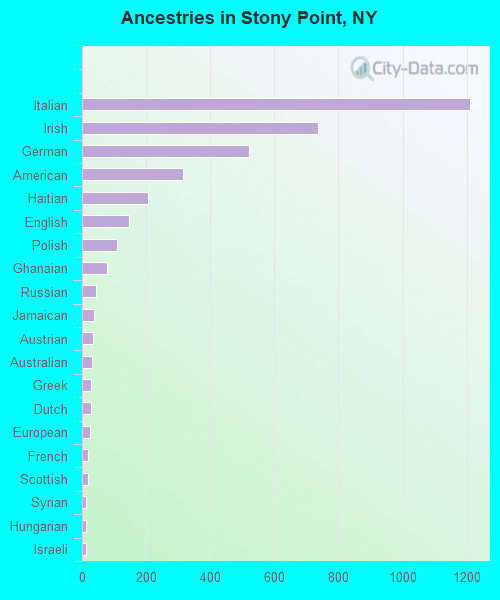
Ancestries in Stony Point
1,209 22.1% Italian735 13.4% Irish520 9.5% German315 5.8% American207 3.8% Haitian146 2.7% English110 2.0% Polish79 1.4% Ghanaian43 0.8% Russian37 0.7% Jamaican33 0.6% Austrian30 0.5% Australian29 0.5% Greek28 0.5% Dutch25 0.5% European19 0.3% French19 0.3% Scottish13 0.2% Syrian11 0.2% Hungarian11 0.2% Israeli10 0.2% Norwegian10 0.2% Scandinavian10 0.2% Swedish9 0.2% Eastern European9 0.2% Portuguese8 0.1% Belgian8 0.1% British8 0.1% Northern European6 0.1% Lebanese1 0.02% Ukrainian
Children Nativity (place of birth) in Stony Point
Children under 6 years - Living with two parents Both parents native 487 100.0% NativeBoth parents foreign-born 140 100.0% NativeOne native, one foreign-born parent 72 100.0% NativeChildren under 6 years - Living with one parent Native parent 18 100.0% NativeForeign-born parent 54 100.0% NativeChildren 6 to 17 years - Living with two parents Both parents native 812 100.0% NativeBoth parents foreign-born 144 85.3% Native25 14.7% Foreign-bornOne native, one foreign-born parent 175 100.0% NativeChildren 6 to 17 years - Living with one parent Native parent 363 100.0% NativeForeign-born parent 132 51.9% Native123 48.1% Foreign-born
Grandparents responsible for own grandchildren in Stony Point
Grandparents (30 to 59 years) White / Caucasian 20 43.9% Responsible for grandchildren25 56.1% Not responsible for grandchildrenOther race 18 100.0% Responsible for grandchildrenWhite alone, not Hispanic / Latino 30 100.0% Not responsible for grandchildrenHispanic or Latino 39 100.0% Responsible for grandchildrenGrandparents (60 years and over) White / Caucasian 4 5.8% Responsible for grandchildren66 94.2% Not responsible for grandchildrenWhite alone, not Hispanic / Latino 4 5.9% Responsible for grandchildren71 94.1% Not responsible for grandchildren