Races in Storm Lake, Iowa (IA) Detailed Stats
Data:
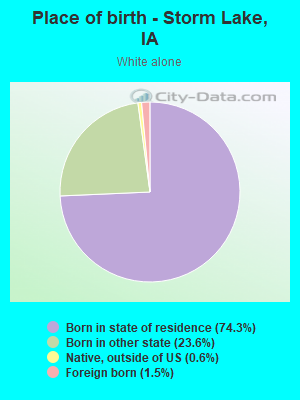
Races - White alone (%)
Races - White alone (% change since 2000)
Races - Black alone (%)
Races - Black alone (% change since 2000)
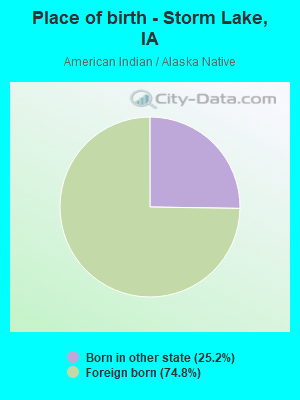
Races - American Indian alone (%)
Races - American Indian alone (% change since 2000)
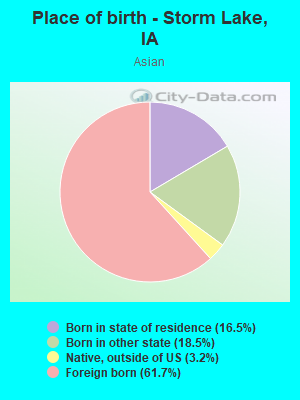
Races - Asian alone (%)
Races - Asian alone (% change since 2000)
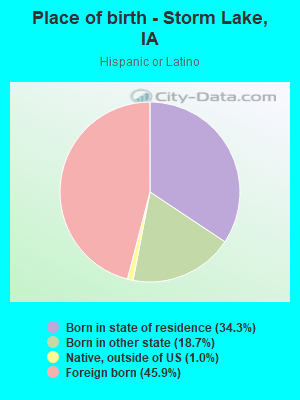
Races - Hispanic (%)
Races - Hispanic (% change since 2000)
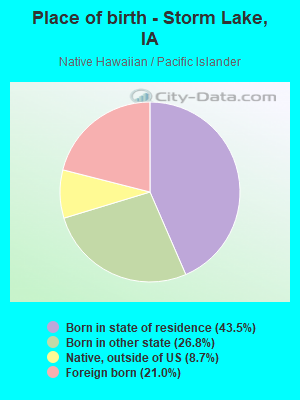
Races - Native Hawaiian and Other Pacific Islander alone (%)
Races - Native Hawaiian and Other Pacific Islander alone (% change since 2000)
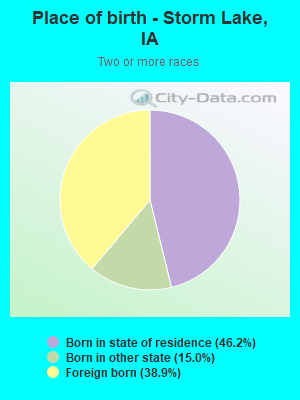
Races - Two or more races(%)
Races - Two or more races(% change since 2000)
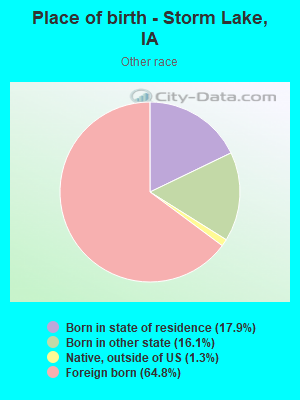
Races - Other race alone (%)
Races - Other race alone (% change since 2000)
Racial diversity
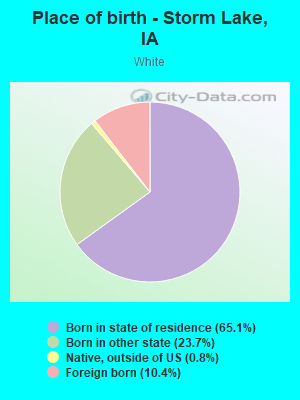
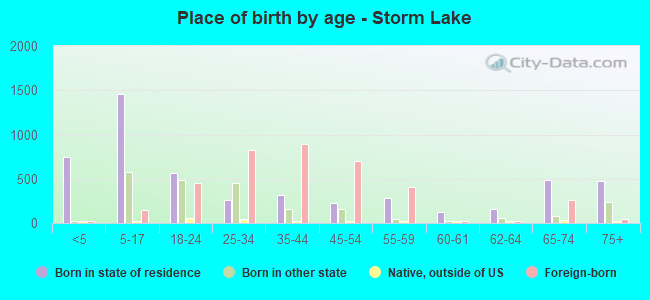
Place of birth - Born in state of residence (%)
Place of birth - Born in state of residence (%) - White
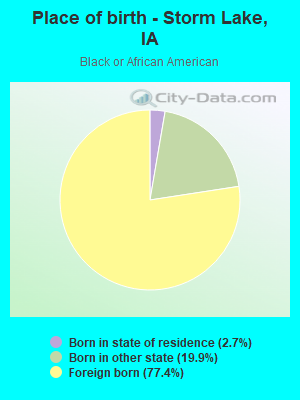
Place of birth - Born in state of residence (%) - Black or African American
Place of birth - Born in state of residence (%) - Asian
Place of birth - Born in state of residence (%) - Hispanic or Latino
Place of birth - Born in state of residence (%) - American Indian and Alaska Native
Place of birth - Born in state of residence (%) - Multirace
Place of birth - Born in state of residence (%) - Other Race
Place of birth - Born in other state (%)
Place of birth - Born in other state (%) - White
Place of birth - Born in other state (%) - Black or African American
Place of birth - Born in other state (%) - Asian
Place of birth - Born in other state (%) - Hispanic or Latino
Place of birth - Born in other state (%) - American Indian and Alaska Native
Place of birth - Born in other state (%) - Multirace
Place of birth - Born in other state (%) - Other Race
Place of birth - Native, outside of US (%)
Place of birth - Native, outside of US (%) - White
Place of birth - Native, outside of US (%) - Black or African American
Place of birth - Native, outside of US (%) - Asian
Place of birth - Native, outside of US (%) - Hispanic or Latino
Place of birth - Native, outside of US (%) - American Indian and Alaska Native
Place of birth - Native, outside of US (%) - Multirace
Place of birth - Native, outside of US (%) - Other Race
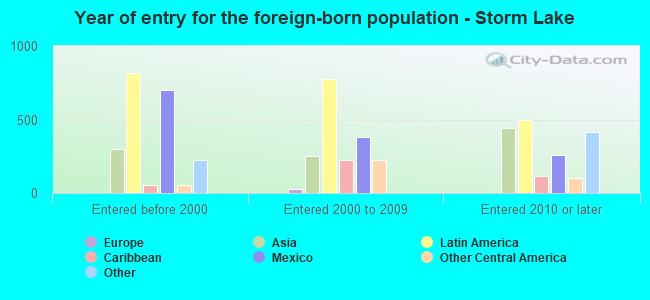
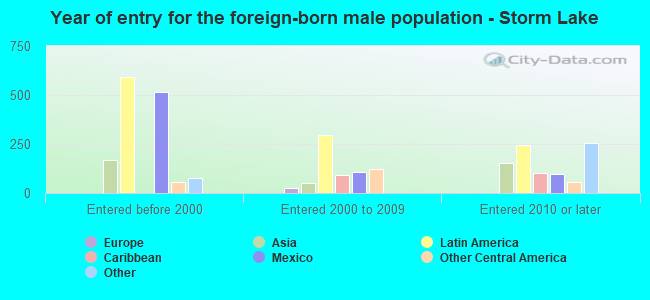
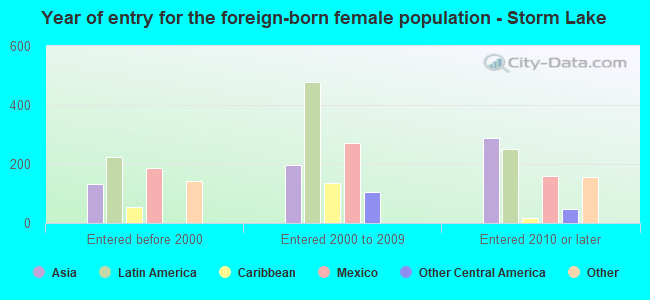
Place of birth - Foreign born (%)
Place of birth - Foreign born (%) - White
Place of birth - Foreign born (%) - Black or African American
Place of birth - Foreign born (%) - Asian
Place of birth - Foreign born (%) - Hispanic or Latino
Place of birth - Foreign born (%) - American Indian and Alaska Native
Place of birth - Foreign born (%) - Multirace
Place of birth - Foreign born (%) - Other Race
Residents speaking English at home (%)
Residents speaking English at home - Born in the United States (%)
Residents speaking English at home - Native, born elsewhere (%)
Residents speaking English at home - Foreign born (%)
Residents speaking Spanish at home (%)
Residents speaking Spanish at home - Born in the United States (%)
Residents speaking Spanish at home - Native, born elsewhere (%)
Residents speaking Spanish at home - Foreign born (%)
Residents speaking other language at home (%)
Residents speaking other language at home - Born in the United States (%)
Residents speaking other language at home - Native, born elsewhere (%)
Residents speaking other language at home - Foreign born (%)
Marital status - Never married (%)
Marital status - Now married (%)
Marital status - Separated (%)
Marital status - Widowed (%)
Marital status - Divorced (%)
Ancestries Reported - Arab (%)
Ancestries Reported - Czech (%)
Ancestries Reported - Danish (%)
Ancestries Reported - Dutch (%)
Ancestries Reported - English (%)
Ancestries Reported - French (%)
Ancestries Reported - French Canadian (%)
Ancestries Reported - German (%)
Ancestries Reported - Greek (%)
Ancestries Reported - Hungarian (%)
Ancestries Reported - Irish (%)
Ancestries Reported - Italian (%)
Ancestries Reported - Lithuanian (%)
Ancestries Reported - Norwegian (%)
Ancestries Reported - Polish (%)
Ancestries Reported - Portuguese (%)
Ancestries Reported - Russian (%)
Ancestries Reported - Scotch-Irish (%)
Ancestries Reported - Scottish (%)
Ancestries Reported - Slovak (%)
Ancestries Reported - Subsaharan African (%)
Ancestries Reported - Swedish (%)
Ancestries Reported - Swiss (%)
Ancestries Reported - Ukrainian (%)
Ancestries Reported - United States (%)
Ancestries Reported - Welsh (%)
Ancestries Reported - West Indian (%)
Ancestries Reported - Other (%)
Geographical mobility - Same house 1 year ago (%)
Geographical mobility - Same house 1 year ago (%) - White
Geographical mobility - Same house 1 year ago (%) - Black or African American
Geographical mobility - Same house 1 year ago (%) - Asian
Geographical mobility - Same house 1 year ago (%) - Hispanic or Latino
Geographical mobility - Same house 1 year ago (%) - American Indian and Alaska Native
Geographical mobility - Same house 1 year ago (%) - Multirace
Geographical mobility - Same house 1 year ago (%) - Other Race
Geographical mobility - Moved within same county (%)
Geographical mobility - Moved within same county (%) - White
Geographical mobility - Moved within same county (%) - Black or African American
Geographical mobility - Moved within same county (%) - Asian
Geographical mobility - Moved within same county (%) - Hispanic or Latino
Geographical mobility - Moved within same county (%) - American Indian and Alaska Native
Geographical mobility - Moved within same county (%) - Multirace
Geographical mobility - Moved within same county (%) - Other Race
Geographical mobility - Moved from different county within same state (%)
Geographical mobility - Moved from different county within same state (%) - White
Geographical mobility - Moved from different county within same state (%) - Black or African American
Geographical mobility - Moved from different county within same state (%) - Asian
Geographical mobility - Moved from different county within same state (%) - Hispanic or Latino
Geographical mobility - Moved from different county within same state (%) - American Indian and Alaska Native
Geographical mobility - Moved from different county within same state (%) - Multirace
Geographical mobility - Moved from different county within same state (%) - Other Race
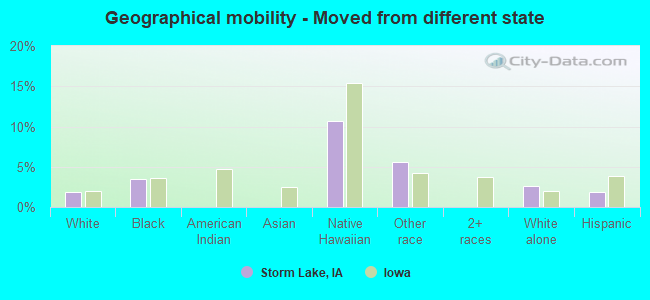
Geographical mobility - Moved from different state (%)
Geographical mobility - Moved from different state (%) - White
Geographical mobility - Moved from different state (%) - Black or African American
Geographical mobility - Moved from different state (%) - Asian
Geographical mobility - Moved from different state (%) - Hispanic or Latino
Geographical mobility - Moved from different state (%) - American Indian and Alaska Native
Geographical mobility - Moved from different state (%) - Multirace
Geographical mobility - Moved from different state (%) - Other Race
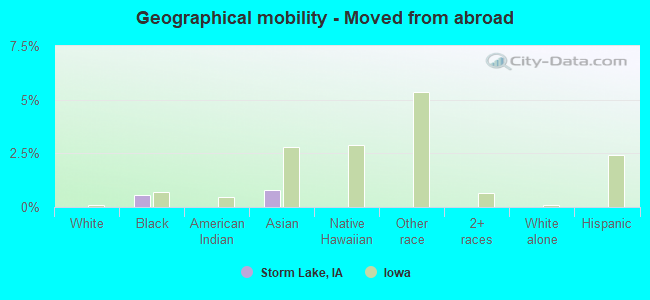
Geographical mobility - Moved from abroad (%)
Geographical mobility - Moved from abroad (%) - White
Geographical mobility - Moved from abroad (%) - Black or African American
Geographical mobility - Moved from abroad (%) - Asian
Geographical mobility - Moved from abroad (%) - Hispanic or Latino
Geographical mobility - Moved from abroad (%) - American Indian and Alaska Native
Geographical mobility - Moved from abroad (%) - Multirace
Geographical mobility - Moved from abroad (%) - Other Race
Place of birth for the foreign-born population - Ireland (%)
Place of birth for the foreign-born population - Denmark (%)
Place of birth for the foreign-born population - Norway (%)
Place of birth for the foreign-born population - Sweden (%)
Place of birth for the foreign-born population - United Kingdom (%)
Place of birth for the foreign-born population - England (%)
Place of birth for the foreign-born population - Scotland (%)
Place of birth for the foreign-born population - Other Northern Europe (%)
Place of birth for the foreign-born population - Austria (%)
Place of birth for the foreign-born population - Belgium (%)
Place of birth for the foreign-born population - France (%)
Place of birth for the foreign-born population - Germany (%)
Place of birth for the foreign-born population - Netherlands (%)
Place of birth for the foreign-born population - Switzerland (%)
Place of birth for the foreign-born population - Other Western Europe (%)
Place of birth for the foreign-born population - Greece (%)
Place of birth for the foreign-born population - Italy (%)
Place of birth for the foreign-born population - Portugal (%)
Place of birth for the foreign-born population - Spain (%)
Place of birth for the foreign-born population - Other Southern Europe (%)
Place of birth for the foreign-born population - Albania (%)
Place of birth for the foreign-born population - Belarus (%)
Place of birth for the foreign-born population - Bosnia and Herzegovina (%)
Place of birth for the foreign-born population - Bulgaria (%)
Place of birth for the foreign-born population - Croatia (%)
Place of birth for the foreign-born population - Czechoslovakia (%)
Place of birth for the foreign-born population - Hungary (%)
Place of birth for the foreign-born population - Latvia (%)
Place of birth for the foreign-born population - Lithuania (%)
Place of birth for the foreign-born population - North Macedonia (Macedonia) (%)
Place of birth for the foreign-born population - Moldova (%)
Place of birth for the foreign-born population - Poland (%)
Place of birth for the foreign-born population - Romania (%)
Place of birth for the foreign-born population - Russia (%)
Place of birth for the foreign-born population - Serbia (%)
Place of birth for the foreign-born population - Ukraine (%)
Place of birth for the foreign-born population - Other Eastern Europe (%)
Place of birth for the foreign-born population - China (%)
Place of birth for the foreign-born population - Hong Kong (%)
Place of birth for the foreign-born population - Taiwan (%)
Place of birth for the foreign-born population - Japan (%)
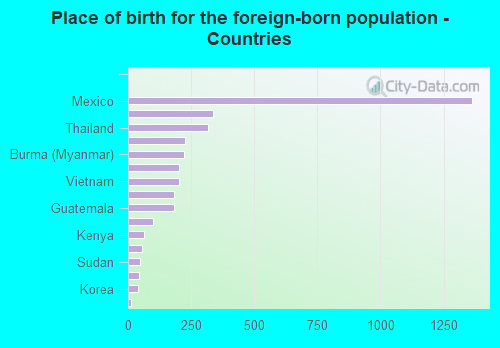
Place of birth for the foreign-born population - Korea (%)
Place of birth for the foreign-born population - Other Eastern Asia (%)
Place of birth for the foreign-born population - Afghanistan (%)
Place of birth for the foreign-born population - Bangladesh (%)
Place of birth for the foreign-born population - India (%)
Place of birth for the foreign-born population - Iran (%)
Place of birth for the foreign-born population - Kazakhstan (%)
Place of birth for the foreign-born population - Nepal (%)
Place of birth for the foreign-born population - Pakistan (%)
Place of birth for the foreign-born population - Sri Lanka (%)
Place of birth for the foreign-born population - Uzbekistan (%)
Place of birth for the foreign-born population - Other South Central Asia (%)
Place of birth for the foreign-born population - Burma (%)
Place of birth for the foreign-born population - Cambodia (%)
Place of birth for the foreign-born population - Indonesia (%)
Place of birth for the foreign-born population - Laos (%)
Place of birth for the foreign-born population - Malaysia (%)
Place of birth for the foreign-born population - Philippines (%)
Place of birth for the foreign-born population - Singapore (%)
Place of birth for the foreign-born population - Thailand (%)
Place of birth for the foreign-born population - Vietnam (%)
Place of birth for the foreign-born population - Other South Eastern Asia (%)
Place of birth for the foreign-born population - Armenia (%)
Place of birth for the foreign-born population - Iraq (%)
Place of birth for the foreign-born population - Israel (%)
Place of birth for the foreign-born population - Jordan (%)
Place of birth for the foreign-born population - Kuwait (%)
Place of birth for the foreign-born population - Lebanon (%)
Place of birth for the foreign-born population - Saudi Arabia (%)
Place of birth for the foreign-born population - Syria (%)
Place of birth for the foreign-born population - Turkey (%)
Place of birth for the foreign-born population - Yemen (%)
Place of birth for the foreign-born population - Other Western Asia (%)
Place of birth for the foreign-born population - Eritrea (%)
Place of birth for the foreign-born population - Ethiopia (%)
Place of birth for the foreign-born population - Kenya (%)
Place of birth for the foreign-born population - Somalia (%)
Place of birth for the foreign-born population - Uganda (%)
Place of birth for the foreign-born population - Zimbabwe (%)
Place of birth for the foreign-born population - Other Eastern Africa (%)
Place of birth for the foreign-born population - Cameroon (%)
Place of birth for the foreign-born population - Congo (%)
Place of birth for the foreign-born population - Democratic Republic of Congo (Zaire) (%)
Place of birth for the foreign-born population - Other Middle Africa (%)
Place of birth for the foreign-born population - Egypt (%)
Place of birth for the foreign-born population - Morocco (%)
Place of birth for the foreign-born population - Sudan (%)
Place of birth for the foreign-born population - Other Northern Africa (%)
Place of birth for the foreign-born population - South Africa (%)
Place of birth for the foreign-born population - Other Southern Africa (%)
Place of birth for the foreign-born population - Cabo Verde (%)
Place of birth for the foreign-born population - Ghana (%)
Place of birth for the foreign-born population - Liberia (%)
Place of birth for the foreign-born population - Nigeria (%)
Place of birth for the foreign-born population - Senegal (%)
Place of birth for the foreign-born population - Sierra Leone (%)
Place of birth for the foreign-born population - Other Western Africa (%)
Place of birth for the foreign-born population - Australia (%)
Place of birth for the foreign-born population - New Zealand (%)
Place of birth for the foreign-born population - Fiji (%)
Place of birth for the foreign-born population - Micronesia (%)
Place of birth for the foreign-born population - Bahamas (%)
Place of birth for the foreign-born population - Barbados (%)
Place of birth for the foreign-born population - Cuba (%)
Place of birth for the foreign-born population - Dominica (%)
Place of birth for the foreign-born population - Dominican Republic (%)
Place of birth for the foreign-born population - Grenada (%)
Place of birth for the foreign-born population - Haiti (%)
Place of birth for the foreign-born population - Jamaica (%)
Place of birth for the foreign-born population - St. Vincent and the Grenadines (%)
Place of birth for the foreign-born population - Trinidad and Tobago (%)
Place of birth for the foreign-born population - West Indies (%)
Place of birth for the foreign-born population - Other Caribbean (%)
Place of birth for the foreign-born population - Belize (%)
Place of birth for the foreign-born population - Costa Rica (%)
Place of birth for the foreign-born population - El Salvador (%)
Place of birth for the foreign-born population - Guatemala (%)
Place of birth for the foreign-born population - Honduras (%)
Place of birth for the foreign-born population - Mexico (%)
Place of birth for the foreign-born population - Nicaragua (%)
Place of birth for the foreign-born population - Panama (%)
Place of birth for the foreign-born population - Other Central America (%)
Place of birth for the foreign-born population - Argentina (%)
Place of birth for the foreign-born population - Bolivia (%)
Place of birth for the foreign-born population - Brazil (%)
Place of birth for the foreign-born population - Chile (%)
Place of birth for the foreign-born population - Colombia (%)
Place of birth for the foreign-born population - Ecuador (%)
Place of birth for the foreign-born population - Guyana (%)
Place of birth for the foreign-born population - Peru (%)
Place of birth for the foreign-born population - Uruguay (%)
Place of birth for the foreign-born population - Venezuela (%)
Place of birth for the foreign-born population - Other South America (%)
Place of birth for the foreign-born population - Canada (%)
Place of birth for the foreign-born population - Other Northern America (%)
Place of birth for the foreign-born population - Other (%)
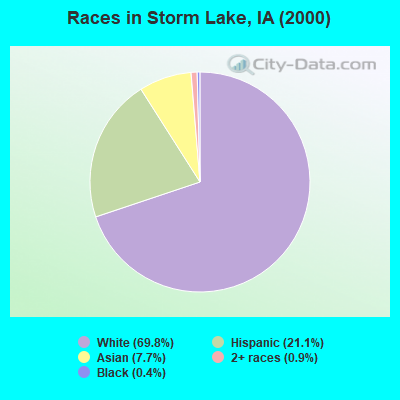
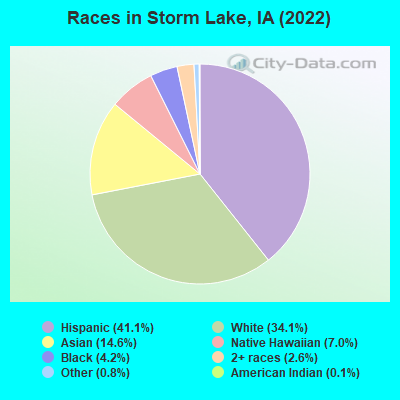
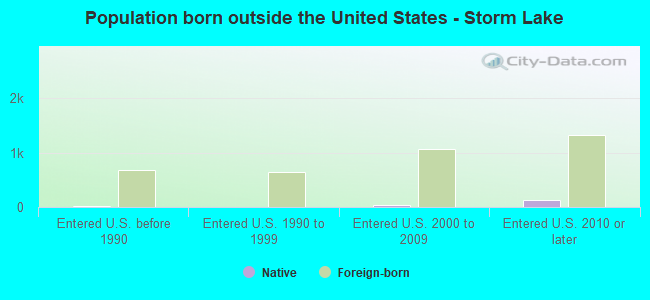
According to 2022 data, the most numerous races in Storm Lake, IA are White alone (3,833 residents), Hispanic (4,618 residents), and Black alone (472 residents). 47.6% of Storm Lake residents speak English at home. 32.5% of Storm Lake, IA residents are foreign-born (18.1% born in Latin America, 9.2% born in Asia), which is 84.6% greater than the foreign-born rate of 5.0% across the entire state of Iowa.
Race distribution in Storm Lake
2000 2022
2,710,344 92.6% White alone 82,473 2.8% Hispanic 60,744 2.1% Black alone 36,345 1.2% Asian alone 25,472 0.9% Two or more races 7,955 0.3% American Indian alone 2,103 0.07% Other race alone 888 0.03% Native Hawaiian and Other
2,650,110 82.8% White alone 218,024 6.8% Hispanic 119,004 3.7% Black alone 115,286 3.6% Two or more races 74,892 2.3% Asian alone 9,260 0.3% Other race alone 8,595 0.3% Native Hawaiian and Other 5,346 0.2% American Indian alone
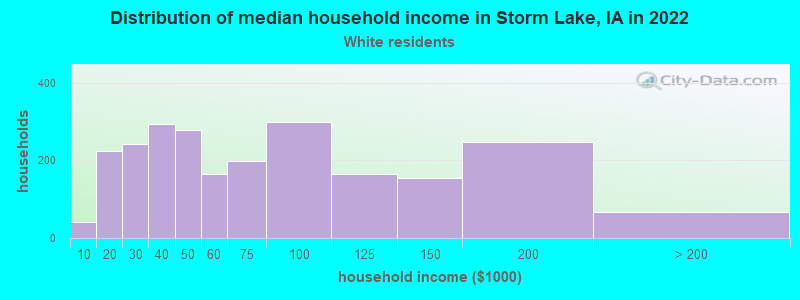
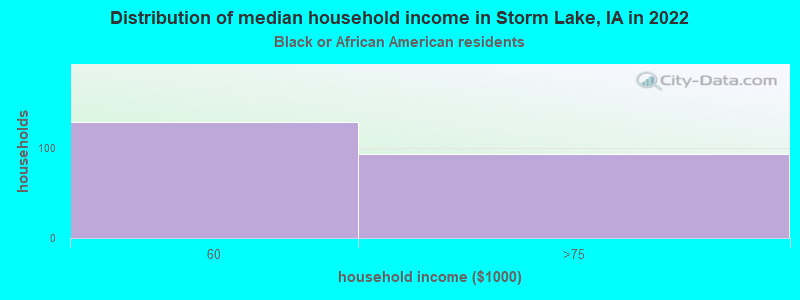
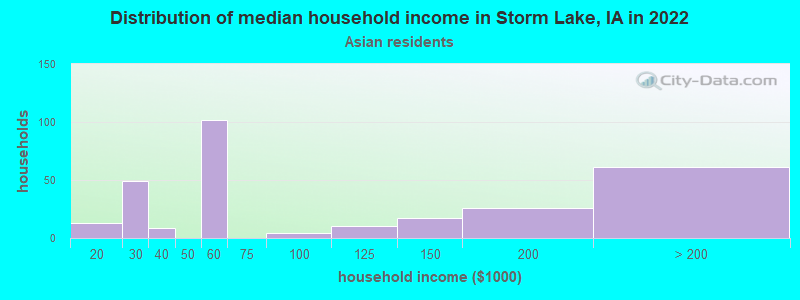
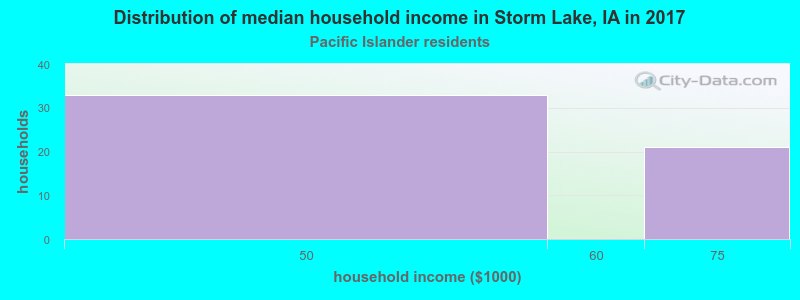
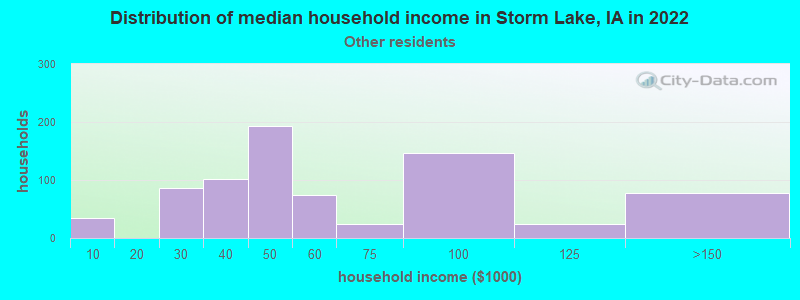
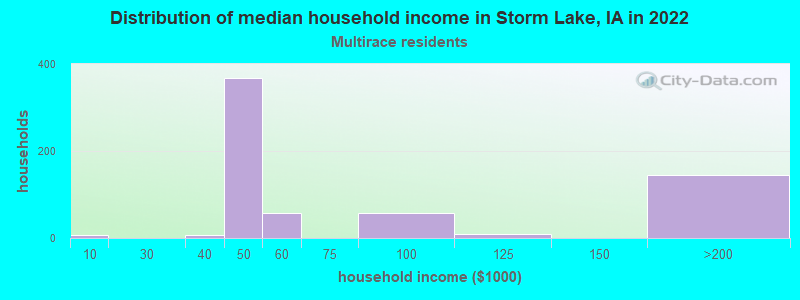
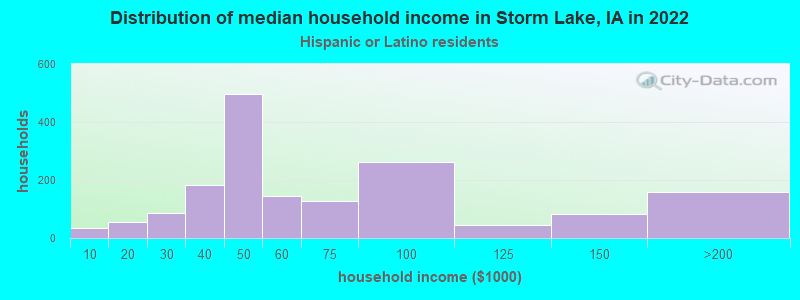
Income and house value in Storm Lake Median household income in 2022 $58,475 White non-Hispanic householders$53,666 Black householders$57,781 Asian householders$106,370 Native Hawaiian and other Pacific Islander householders$46,006 Some other race householders$51,480 Two or more races householders$53,823 Hispanic or Latino race householdersMedian 2022 house value $170,907 White Non-Hispanic householders$62,416 American Indian or Alaska Native householders $144,352 Asian householders$117,115 Some other race householders$90,333 Two or more races householders$118,704 Hispanic or Latino householders
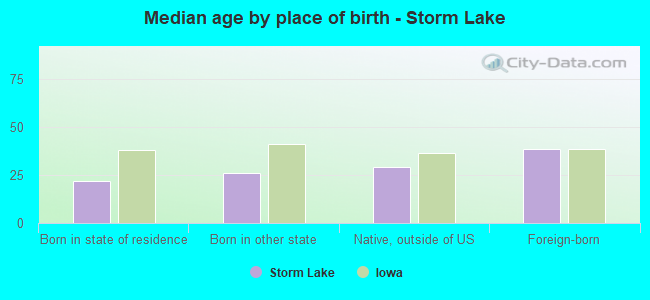
Median age by race in Storm Lake
37.9 Median age for White residents34.9 39.4 32.3 Median age for Black or African American residents31.6 28.1 32.1 Median age for American Indian / Alaska Native residents41.7 -670,912,950.5 27.0 Median age for Asian residents21.2 30.9 19.9 Median age for Native Hawaiian / Pacific Islander residents23.9 19.4 31.1 Median age for Other race residents30.8 31.3 20.5 Median age for Two or more races residents23.0 21.3 54.2 Median age for White alone residents54.9 54.1 26.6 Median age for Hispanic or Latino residents26.2 25.7
Owner/renter occupied households by race in Storm Lake
House owners and renters - White residents 1,550 64.9% Owner occupied839 35.1% Renter occupiedHouse owners and renters - Black or African American residents 54 20.2% Owner occupied215 79.8% Renter occupiedHouse owners and renters - American Indian / Alaska Native residents 18 100.0% Renter occupiedHouse owners and renters - Asian residents 233 63.8% Owner occupied132 36.2% Renter occupiedHouse owners and renters - Native Hawaiian / Pacific Islander residents 123 84.7% Owner occupied22 15.3% Renter occupiedHouse owners and renters - Other race residents 285 37.9% Owner occupied466 62.1% Renter occupiedHouse owners and renters - Two or more races residents 585 95.5% Owner occupied28 4.5% Renter occupiedHouse owners and renters - White alone residents 1,228 69.7% Owner occupied535 30.3% Renter occupiedHouse owners and renters - Hispanic or Latino residents 996 60.0% Owner occupied664 40.0% Renter occupied
Language usage in Storm Lake
English speakers - Total 47.6% of residents of Storm Lake speak English at home.
35.5% of residents speak Spanish at home 1,592 42.8% Speak English very well2,126 57.2% Speak English less than very well18.6% of residents speak other language at home 827 42.5% Speak English very well1,120 57.5% Speak English less than very well
English speakers - Born in the United States 50.9% of residents of Storm Lake speak English at home.
30.0% of residents speak Spanish at home 542 78.2% Speak English very well151 21.8% Speak English less than very well16.8% of residents speak other language at home 366 94.1% Speak English very well23 5.9% Speak English less than very well
English speakers - Native, born elsewhere 52.9% of residents of Storm Lake speak English at home.
22.1% of residents speak Spanish at home 38 100.0% Speak English less than very well22.1% of residents speak other language at home 38 100.0% Speak English less than very well
English speakers - Foreign-born 7.9% of residents of Storm Lake speak English at home.
56.9% of residents speak Spanish at home 317 14.7% Speak English very well1,842 85.3% Speak English less than very well34.8% of residents speak other language at home 327 24.7% Speak English very well995 75.3% Speak English less than very well
White (Caucasian) - Speak only English Native:
80.8% (3,801)Foreign-born:
8.6% (51)
White (Caucasian) - Speak another language Native:
15.3% (718)Foreign-born:
86.6% (514)
Black or African American - Speak only English Native:
100.0% (117)Foreign-born:
30.3% (114)
American Indian / Alaska Native - Speak another language Native:
54.8% (9)Foreign-born:
93.5% (41)
Asian - Speak only English Native:
17.4% (92)Foreign-born:
1.6% (16)
Asian - Speak another language Native:
80.6% (426)Foreign-born:
96.1% (957)
Native Hawaiian / Pacific Islander - Speak another language Native:
24.8% (73)Foreign-born:
93.3% (227)
Other race - Speak only English Native:
16.0% (96)Foreign-born:
4.8% (58)
Other race - Speak another language Native:
74.5% (446)Foreign-born:
96.6% (1,173)
Two or more races - Speak another language Native:
49.9% (454)Foreign-born:
97.8% (659)
White alone - Speak only English Native:
98.9% (3,658)Foreign-born:
99.1% (57)
Hispanic or Latino - Speak another language Native:
71.4% (1,471)Foreign-born:
100.0% (2,149)
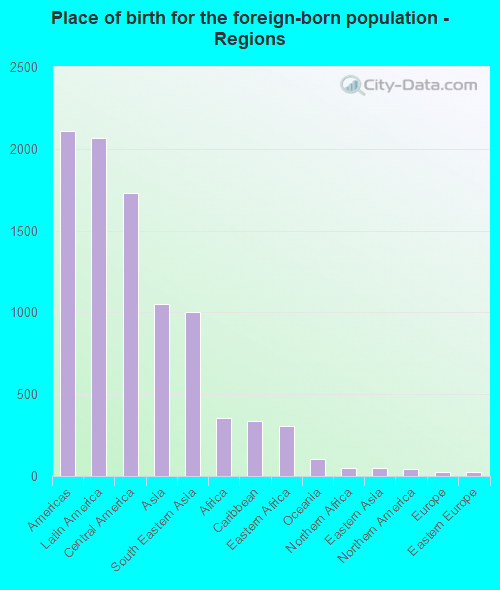
Foreign-born residents in Storm Lake 3,647 residents are foreign born (18.1% Latin America , 9.2% Asia ).
Marital status for residents in Storm Lake Marital status - White (Caucasian) population 15 years and over
Males 35.6% Never married51.4% Now married2.4% Separated5.7% Widowed5.0% DivorcedFemales 26.4% Never married46.8% Now married7.2% Separated15.6% Widowed4.0% DivorcedWomen who gave birth in the past 12 months Now married:
100.0% (141)Unmarried:
0.0% (0)
Women who did not give birth in the past 12 months Now married:
42.9% (534)Unmarried:
57.1% (709)
Marital status - Black or African American population 15 years and over
Males 15.4% Never married9.6% Now married73.1% Separated0.0% Widowed1.9% DivorcedFemales 81.1% Never married0.0% Now married0.0% Separated0.0% Widowed18.9% DivorcedWomen who did not give birth in the past 12 months Now married:
0.0% (0)Unmarried:
100.0% (253)
Marital status - American Indian / Alaska Native population 15 years and over
Males 50.0% Never married50.0% Now married0.0% Separated0.0% Widowed0.0% DivorcedFemales 100.0% Never married0.0% Now married0.0% Separated0.0% Widowed0.0% DivorcedWomen who did not give birth in the past 12 months Now married:
0.0% (0)Unmarried:
100.0% (10)
Marital status - Asian population 15 years and over
Males 59.3% Never married37.9% Now married0.0% Separated0.0% Widowed2.8% DivorcedFemales 44.0% Never married35.0% Now married0.7% Separated4.3% Widowed16.1% DivorcedWomen who did not give birth in the past 12 months Now married:
33.2% (191)Unmarried:
66.8% (384)
Marital status - Native Hawaiian / Pacific Islander population 15 years and over
Males 65.9% Never married7.6% Now married0.0% Separated0.0% Widowed26.5% DivorcedFemales 40.0% Never married22.7% Now married0.0% Separated0.0% Widowed37.3% DivorcedWomen who gave birth in the past 12 months Now married:
0.0% (0)Unmarried:
100.0% (33)
Women who did not give birth in the past 12 months Now married:
26.0% (59)Unmarried:
74.0% (168)
Marital status - Other race population 15 years and over
Males 45.7% Never married37.1% Now married0.0% Separated7.9% Widowed9.3% DivorcedFemales 49.8% Never married45.2% Now married0.0% Separated0.0% Widowed5.0% DivorcedWomen who gave birth in the past 12 months Now married:
100.0% (47)Unmarried:
0.0% (0)
Women who did not give birth in the past 12 months Now married:
42.1% (183)Unmarried:
57.9% (251)
Marital status - Two or more races population 15 years and over
Males 24.8% Never married25.7% Now married2.1% Separated0.0% Widowed47.5% DivorcedFemales 25.4% Never married55.2% Now married0.0% Separated10.8% Widowed8.6% DivorcedWomen who gave birth in the past 12 months Now married:
100.0% (79)Unmarried:
0.0% (0)
Women who did not give birth in the past 12 months Now married:
41.9% (81)Unmarried:
58.1% (112)
Marital status - White alone, not Hispanic / Latino population 15 years and over
Males 34.7% Never married50.0% Now married1.3% Separated8.3% Widowed5.7% DivorcedFemales 25.5% Never married46.4% Now married1.9% Separated20.8% Widowed5.4% DivorcedWomen who gave birth in the past 12 months Now married:
100.0% (69)Unmarried:
0.0% (0)
Women who did not give birth in the past 12 months Now married:
31.9% (248)Unmarried:
68.1% (531)
Marital status - Hispanic or Latino population 15 years and over
Males 37.0% Never married41.6% Now married2.5% Separated2.6% Widowed16.2% DivorcedFemales 36.4% Never married48.0% Now married11.2% Separated2.1% Widowed2.2% DivorcedWomen who gave birth in the past 12 months Now married:
100.0% (180)Unmarried:
0.0% (0)
Women who did not give birth in the past 12 months Now married:
51.5% (540)Unmarried:
48.5% (509)
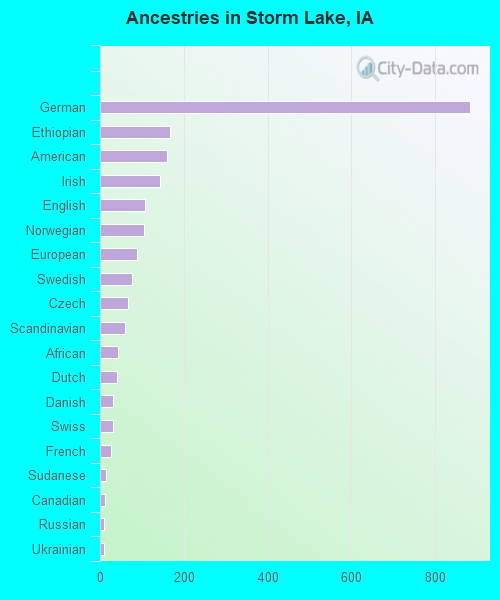
Ancestries in Storm Lake
884 11.8% German166 2.2% Ethiopian161 2.1% American142 1.9% Irish107 1.4% English104 1.4% Norwegian89 1.2% European76 1.0% Swedish66 0.9% Czech59 0.8% Scandinavian44 0.6% African41 0.5% Dutch31 0.4% Danish30 0.4% Swiss27 0.4% French15 0.2% Sudanese11 0.1% Canadian10 0.1% Russian10 0.1% Ukrainian4 0.05% Czechoslovakian3 0.04% Italian2 0.03% Eastern European
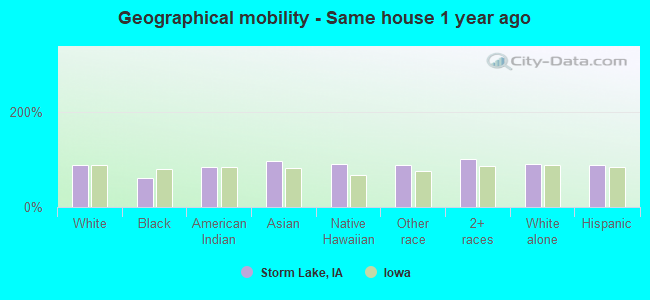
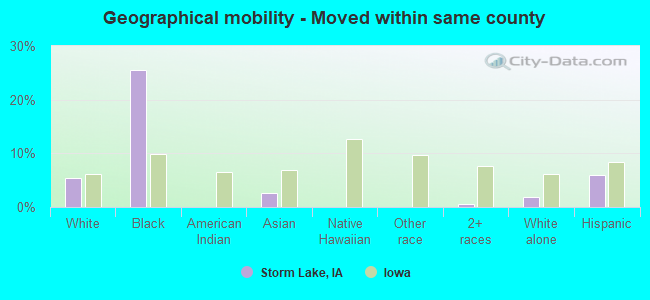
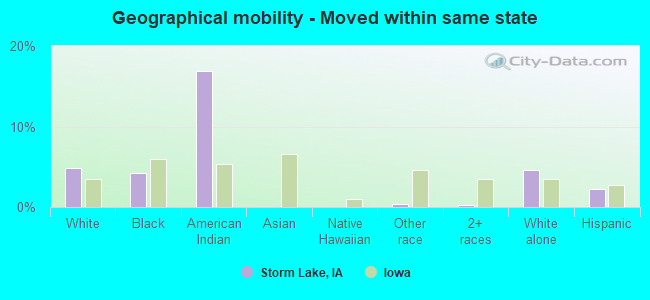
Geographical mobility in Storm Lake Same house 1 year ago 5,094 88.1% White (Caucasian)285 60.2% Black or African American38 83.1% American Indian / Alaska Native1,591 96.5% Asian368 90.3% Native Hawaiian / Pacific Islander1,573 88.6% Other race1,613 100.0% Two or more races3,479 91.4% White alone, not Hispanic / Latino3,965 89.1% Hispanic or LatinoMoved within same county 312 5.4% White / Caucasian121 25.5% Black or African American44 2.7% Asian8 0.5% Two or more races71 1.9% White alone, not Hispanic / Latino265 6.0% Hispanic or LatinoMoved within same state 278 4.8% White / Caucasian20 4.2% Black or African American8 16.9% American Indian / Alaska Native6 0.3% Other race4 0.2% Two or more races174 4.6% White alone, not Hispanic / Latino97 2.2% Hispanic or LatinoMoved from different state 107 1.9% White / Caucasian16 3.4% Black or African American43 10.6% Native Hawaiian / Pacific Islander99 5.6% Other race101 2.7% White alone, not Hispanic / Latino81 1.8% Hispanic or LatinoMoved from abroad 3 0.6% Black or African American13 0.8% Asian
Children Nativity (place of birth) in Storm Lake
Children under 6 years - Living with two parents Both parents native 352 99.9% Native0 0.1% Foreign-bornBoth parents foreign-born 166 95.6% Native8 4.4% Foreign-bornOne native, one foreign-born parent 180 100.0% NativeChildren under 6 years - Living with one parent Native parent 60 100.0% NativeForeign-born parent 73 100.0% NativeChildren 6 to 17 years - Living with two parents Both parents native 441 100.0% NativeBoth parents foreign-born 693 88.7% Native88 11.3% Foreign-bornOne native, one foreign-born parent 148 100.0% NativeChildren 6 to 17 years - Living with one parent Foreign-born parent 670 52.6% Native603 47.4% Foreign-born
Grandparents responsible for own grandchildren in Storm Lake
Grandparents (30 to 59 years) White / Caucasian 30 100.0% Not responsible for grandchildrenBlack or African American 41 100.0% Not responsible for grandchildrenAsian 17 68.1% Responsible for grandchildren8 31.9% Not responsible for grandchildrenNative Hawaiian / Pacific Islander 22 70.3% Responsible for grandchildren9 29.7% Not responsible for grandchildrenHispanic or Latino 18 100.0% Not responsible for grandchildrenGrandparents (60 years and over) White / Caucasian 35 100.0% Not responsible for grandchildrenAsian 9 38.9% Responsible for grandchildren14 61.1% Not responsible for grandchildrenHispanic or Latino 78 100.0% Not responsible for grandchildren