Races in Stratham, New Hampshire (NH) Detailed Stats
Ancestries, Foreign-born residents, place of birth

Recent posts about races in Stratham, New Hampshire on our local forum with over 2,400,000 registered users:
 | Around 95 up to Portsmouth - Looking to buy a house in good school district 475k (11 replies) |
| Yet Another Guy Looking to Relocate to Southern NH (27 replies) |
| Moving to Peterborough..from Kauai (42 replies) |
| Exeter/Stratham or Portsmouth (14 replies) |
| Interested in a house on Rt. 33 in Stratham (1 reply) |
| Relocation to NH or MA (31 replies) |
Latest news about races in Stratham, NH collected exclusively by city-data.com from local newspapers, TV, and radio stations
3.0% of Stratham, NH residents are foreign-born (1.7% born in Europe, 0.7% born in Asia, 0.4% born in North America), which is 65.5% less than the foreign-born rate of 5.0% across the entire state of New Hampshire.
Race distribution in Stratham

- 6,19497.5%White alone
- 500.8%Two or more races
- 530.8%Asian alone
- 410.6%Hispanic
- 100.2%Black alone
- 40.06%Other race alone
- 30.05%American Indian alone
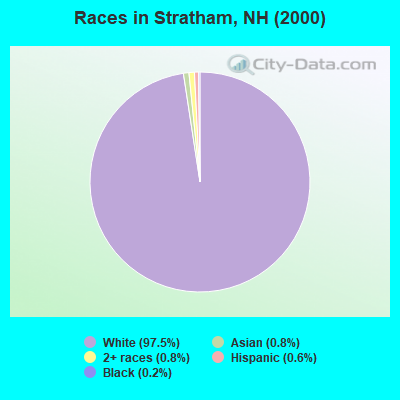
2000
2022
-
- 1,175,25295.1%White alone
- 20,4891.7%Hispanic
- 15,8031.3%Asian alone
- 11,6060.9%Two or more races
- 8,3540.7%Black alone
- 2,6980.2%American Indian alone
- 1,2540.1%Other race alone
- 3300.03%Native Hawaiian and Other
Pacific Islander alone

-
- 1,208,10186.6%White alone
- 63,4794.5%Hispanic
- 60,7244.4%Two or more races
- 36,5192.6%Asian alone
- 17,9311.3%Black alone
- 6,6150.5%Other race alone
- 1,0140.07%American Indian alone
- 8480.06%Native Hawaiian and Other
Pacific Islander alone

Income and house value in Stratham
- Median household income in 2022
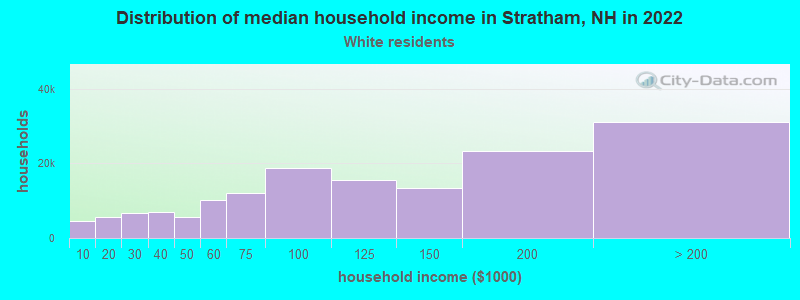
- $143,447White non-Hispanic householders
- $103,123Some other race householders
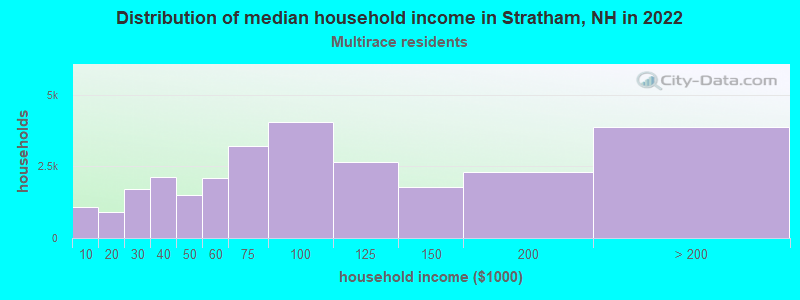
- $195,572Two or more races householders
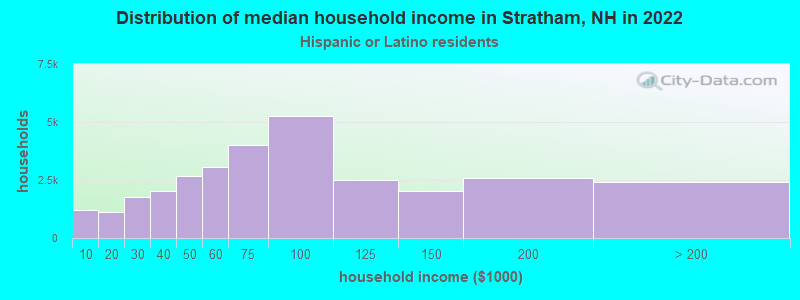
- $125,316Hispanic or Latino race householders
- Median 2022 house value
- $635,562White Non-Hispanic householders
- $496,533Some other race householders
- $420,143Two or more races householders
- $687,507Hispanic or Latino householders
Household income for White non-Hispanic householders
Household income for Two or more races householders
Household income for Hispanic or Latino race householders
Foreign-born residents in Stratham
192 residents are foreign born (1.7% Europe, 0.7% Asia, 0.4% North America).
| This city: | 3.0% |
| New Hampshire: | 4.4% |
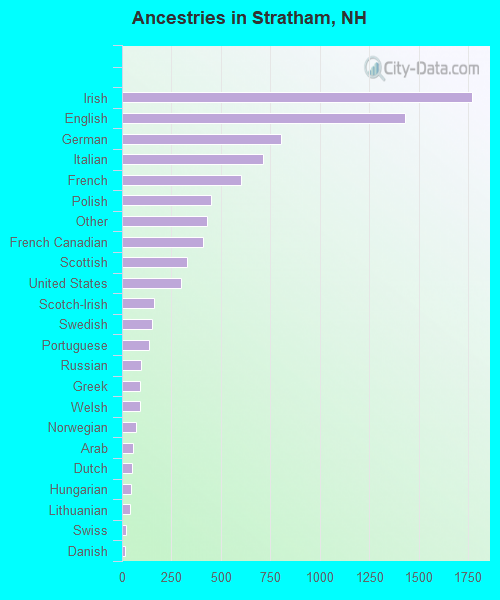
Ancestries in Stratham

- 1,76821.3%Irish
- 1,43017.2%English
- 8029.7%German
- 7128.6%Italian
- 6027.3%French
- 4515.4%Polish
- 4305.2%Other
- 4115.0%French Canadian
- 3294.0%Scottish
- 2963.6%United States
- 1642.0%Scotch-Irish
- 1511.8%Swedish
- 1361.6%Portuguese
- 981.2%Russian
- 901.1%Greek
- 901.1%Welsh
- 710.9%Norwegian
- 570.7%Arab
- 530.6%Dutch
- 450.5%Hungarian
- 410.5%Lithuanian
- 180.2%Swiss
- 170.2%Danish
- 140.2%Czech
- 80.10%Slovak
- 80.10%Ukrainian
Zip codes: 03885.