Races in Sturgeon Bay, Wisconsin (WI) Detailed Stats
Data:
Races - White alone (%)
Races - White alone (% change since 2000)
Races - Black alone (%)
Races - Black alone (% change since 2000)
Races - American Indian alone (%)
Races - American Indian alone (% change since 2000)
Races - Asian alone (%)
Races - Asian alone (% change since 2000)
Races - Hispanic (%)
Races - Hispanic (% change since 2000)
Races - Native Hawaiian and Other Pacific Islander alone (%)
Races - Native Hawaiian and Other Pacific Islander alone (% change since 2000)
Races - Two or more races(%)
Races - Two or more races(% change since 2000)
Races - Other race alone (%)
Races - Other race alone (% change since 2000)
Racial diversity
Place of birth - Born in state of residence (%)
Place of birth - Born in state of residence (%) - White
Place of birth - Born in state of residence (%) - Black or African American
Place of birth - Born in state of residence (%) - Asian
Place of birth - Born in state of residence (%) - Hispanic or Latino
Place of birth - Born in state of residence (%) - American Indian and Alaska Native
Place of birth - Born in state of residence (%) - Multirace
Place of birth - Born in state of residence (%) - Other Race
Place of birth - Born in other state (%)
Place of birth - Born in other state (%) - White
Place of birth - Born in other state (%) - Black or African American
Place of birth - Born in other state (%) - Asian
Place of birth - Born in other state (%) - Hispanic or Latino
Place of birth - Born in other state (%) - American Indian and Alaska Native
Place of birth - Born in other state (%) - Multirace
Place of birth - Born in other state (%) - Other Race
Place of birth - Native, outside of US (%)
Place of birth - Native, outside of US (%) - White
Place of birth - Native, outside of US (%) - Black or African American
Place of birth - Native, outside of US (%) - Asian
Place of birth - Native, outside of US (%) - Hispanic or Latino
Place of birth - Native, outside of US (%) - American Indian and Alaska Native
Place of birth - Native, outside of US (%) - Multirace
Place of birth - Native, outside of US (%) - Other Race
Place of birth - Foreign born (%)
Place of birth - Foreign born (%) - White
Place of birth - Foreign born (%) - Black or African American
Place of birth - Foreign born (%) - Asian
Place of birth - Foreign born (%) - Hispanic or Latino
Place of birth - Foreign born (%) - American Indian and Alaska Native
Place of birth - Foreign born (%) - Multirace
Place of birth - Foreign born (%) - Other Race
Residents speaking English at home (%)
Residents speaking English at home - Born in the United States (%)
Residents speaking English at home - Native, born elsewhere (%)
Residents speaking English at home - Foreign born (%)
Residents speaking Spanish at home (%)
Residents speaking Spanish at home - Born in the United States (%)
Residents speaking Spanish at home - Native, born elsewhere (%)
Residents speaking Spanish at home - Foreign born (%)
Residents speaking other language at home (%)
Residents speaking other language at home - Born in the United States (%)
Residents speaking other language at home - Native, born elsewhere (%)
Residents speaking other language at home - Foreign born (%)
Marital status - Never married (%)
Marital status - Now married (%)
Marital status - Separated (%)
Marital status - Widowed (%)
Marital status - Divorced (%)
Ancestries Reported - Arab (%)
Ancestries Reported - Czech (%)
Ancestries Reported - Danish (%)
Ancestries Reported - Dutch (%)
Ancestries Reported - English (%)
Ancestries Reported - French (%)
Ancestries Reported - French Canadian (%)
Ancestries Reported - German (%)
Ancestries Reported - Greek (%)
Ancestries Reported - Hungarian (%)
Ancestries Reported - Irish (%)
Ancestries Reported - Italian (%)
Ancestries Reported - Lithuanian (%)
Ancestries Reported - Norwegian (%)
Ancestries Reported - Polish (%)
Ancestries Reported - Portuguese (%)
Ancestries Reported - Russian (%)
Ancestries Reported - Scotch-Irish (%)
Ancestries Reported - Scottish (%)
Ancestries Reported - Slovak (%)
Ancestries Reported - Subsaharan African (%)
Ancestries Reported - Swedish (%)
Ancestries Reported - Swiss (%)
Ancestries Reported - Ukrainian (%)
Ancestries Reported - United States (%)
Ancestries Reported - Welsh (%)
Ancestries Reported - West Indian (%)
Ancestries Reported - Other (%)
Geographical mobility - Same house 1 year ago (%)
Geographical mobility - Same house 1 year ago (%) - White
Geographical mobility - Same house 1 year ago (%) - Black or African American
Geographical mobility - Same house 1 year ago (%) - Asian
Geographical mobility - Same house 1 year ago (%) - Hispanic or Latino
Geographical mobility - Same house 1 year ago (%) - American Indian and Alaska Native
Geographical mobility - Same house 1 year ago (%) - Multirace
Geographical mobility - Same house 1 year ago (%) - Other Race
Geographical mobility - Moved within same county (%)
Geographical mobility - Moved within same county (%) - White
Geographical mobility - Moved within same county (%) - Black or African American
Geographical mobility - Moved within same county (%) - Asian
Geographical mobility - Moved within same county (%) - Hispanic or Latino
Geographical mobility - Moved within same county (%) - American Indian and Alaska Native
Geographical mobility - Moved within same county (%) - Multirace
Geographical mobility - Moved within same county (%) - Other Race
Geographical mobility - Moved from different county within same state (%)
Geographical mobility - Moved from different county within same state (%) - White
Geographical mobility - Moved from different county within same state (%) - Black or African American
Geographical mobility - Moved from different county within same state (%) - Asian
Geographical mobility - Moved from different county within same state (%) - Hispanic or Latino
Geographical mobility - Moved from different county within same state (%) - American Indian and Alaska Native
Geographical mobility - Moved from different county within same state (%) - Multirace
Geographical mobility - Moved from different county within same state (%) - Other Race
Geographical mobility - Moved from different state (%)
Geographical mobility - Moved from different state (%) - White
Geographical mobility - Moved from different state (%) - Black or African American
Geographical mobility - Moved from different state (%) - Asian
Geographical mobility - Moved from different state (%) - Hispanic or Latino
Geographical mobility - Moved from different state (%) - American Indian and Alaska Native
Geographical mobility - Moved from different state (%) - Multirace
Geographical mobility - Moved from different state (%) - Other Race
Geographical mobility - Moved from abroad (%)
Geographical mobility - Moved from abroad (%) - White
Geographical mobility - Moved from abroad (%) - Black or African American
Geographical mobility - Moved from abroad (%) - Asian
Geographical mobility - Moved from abroad (%) - Hispanic or Latino
Geographical mobility - Moved from abroad (%) - American Indian and Alaska Native
Geographical mobility - Moved from abroad (%) - Multirace
Geographical mobility - Moved from abroad (%) - Other Race
Place of birth for the foreign-born population - Ireland (%)
Place of birth for the foreign-born population - Denmark (%)
Place of birth for the foreign-born population - Norway (%)
Place of birth for the foreign-born population - Sweden (%)
Place of birth for the foreign-born population - United Kingdom (%)
Place of birth for the foreign-born population - England (%)
Place of birth for the foreign-born population - Scotland (%)
Place of birth for the foreign-born population - Other Northern Europe (%)
Place of birth for the foreign-born population - Austria (%)
Place of birth for the foreign-born population - Belgium (%)
Place of birth for the foreign-born population - France (%)
Place of birth for the foreign-born population - Germany (%)
Place of birth for the foreign-born population - Netherlands (%)
Place of birth for the foreign-born population - Switzerland (%)
Place of birth for the foreign-born population - Other Western Europe (%)
Place of birth for the foreign-born population - Greece (%)
Place of birth for the foreign-born population - Italy (%)
Place of birth for the foreign-born population - Portugal (%)
Place of birth for the foreign-born population - Spain (%)
Place of birth for the foreign-born population - Other Southern Europe (%)
Place of birth for the foreign-born population - Albania (%)
Place of birth for the foreign-born population - Belarus (%)
Place of birth for the foreign-born population - Bosnia and Herzegovina (%)
Place of birth for the foreign-born population - Bulgaria (%)
Place of birth for the foreign-born population - Croatia (%)
Place of birth for the foreign-born population - Czechoslovakia (%)
Place of birth for the foreign-born population - Hungary (%)
Place of birth for the foreign-born population - Latvia (%)
Place of birth for the foreign-born population - Lithuania (%)
Place of birth for the foreign-born population - North Macedonia (Macedonia) (%)
Place of birth for the foreign-born population - Moldova (%)
Place of birth for the foreign-born population - Poland (%)
Place of birth for the foreign-born population - Romania (%)
Place of birth for the foreign-born population - Russia (%)
Place of birth for the foreign-born population - Serbia (%)
Place of birth for the foreign-born population - Ukraine (%)
Place of birth for the foreign-born population - Other Eastern Europe (%)
Place of birth for the foreign-born population - China (%)
Place of birth for the foreign-born population - Hong Kong (%)
Place of birth for the foreign-born population - Taiwan (%)
Place of birth for the foreign-born population - Japan (%)
Place of birth for the foreign-born population - Korea (%)
Place of birth for the foreign-born population - Other Eastern Asia (%)
Place of birth for the foreign-born population - Afghanistan (%)
Place of birth for the foreign-born population - Bangladesh (%)
Place of birth for the foreign-born population - India (%)
Place of birth for the foreign-born population - Iran (%)
Place of birth for the foreign-born population - Kazakhstan (%)
Place of birth for the foreign-born population - Nepal (%)
Place of birth for the foreign-born population - Pakistan (%)
Place of birth for the foreign-born population - Sri Lanka (%)
Place of birth for the foreign-born population - Uzbekistan (%)
Place of birth for the foreign-born population - Other South Central Asia (%)
Place of birth for the foreign-born population - Burma (%)
Place of birth for the foreign-born population - Cambodia (%)
Place of birth for the foreign-born population - Indonesia (%)
Place of birth for the foreign-born population - Laos (%)
Place of birth for the foreign-born population - Malaysia (%)
Place of birth for the foreign-born population - Philippines (%)
Place of birth for the foreign-born population - Singapore (%)
Place of birth for the foreign-born population - Thailand (%)
Place of birth for the foreign-born population - Vietnam (%)
Place of birth for the foreign-born population - Other South Eastern Asia (%)
Place of birth for the foreign-born population - Armenia (%)
Place of birth for the foreign-born population - Iraq (%)
Place of birth for the foreign-born population - Israel (%)
Place of birth for the foreign-born population - Jordan (%)
Place of birth for the foreign-born population - Kuwait (%)
Place of birth for the foreign-born population - Lebanon (%)
Place of birth for the foreign-born population - Saudi Arabia (%)
Place of birth for the foreign-born population - Syria (%)
Place of birth for the foreign-born population - Turkey (%)
Place of birth for the foreign-born population - Yemen (%)
Place of birth for the foreign-born population - Other Western Asia (%)
Place of birth for the foreign-born population - Eritrea (%)
Place of birth for the foreign-born population - Ethiopia (%)
Place of birth for the foreign-born population - Kenya (%)
Place of birth for the foreign-born population - Somalia (%)
Place of birth for the foreign-born population - Uganda (%)
Place of birth for the foreign-born population - Zimbabwe (%)
Place of birth for the foreign-born population - Other Eastern Africa (%)
Place of birth for the foreign-born population - Cameroon (%)
Place of birth for the foreign-born population - Congo (%)
Place of birth for the foreign-born population - Democratic Republic of Congo (Zaire) (%)
Place of birth for the foreign-born population - Other Middle Africa (%)
Place of birth for the foreign-born population - Egypt (%)
Place of birth for the foreign-born population - Morocco (%)
Place of birth for the foreign-born population - Sudan (%)
Place of birth for the foreign-born population - Other Northern Africa (%)
Place of birth for the foreign-born population - South Africa (%)
Place of birth for the foreign-born population - Other Southern Africa (%)
Place of birth for the foreign-born population - Cabo Verde (%)
Place of birth for the foreign-born population - Ghana (%)
Place of birth for the foreign-born population - Liberia (%)
Place of birth for the foreign-born population - Nigeria (%)
Place of birth for the foreign-born population - Senegal (%)
Place of birth for the foreign-born population - Sierra Leone (%)
Place of birth for the foreign-born population - Other Western Africa (%)
Place of birth for the foreign-born population - Australia (%)
Place of birth for the foreign-born population - New Zealand (%)
Place of birth for the foreign-born population - Fiji (%)
Place of birth for the foreign-born population - Micronesia (%)
Place of birth for the foreign-born population - Bahamas (%)
Place of birth for the foreign-born population - Barbados (%)
Place of birth for the foreign-born population - Cuba (%)
Place of birth for the foreign-born population - Dominica (%)
Place of birth for the foreign-born population - Dominican Republic (%)
Place of birth for the foreign-born population - Grenada (%)
Place of birth for the foreign-born population - Haiti (%)
Place of birth for the foreign-born population - Jamaica (%)
Place of birth for the foreign-born population - St. Vincent and the Grenadines (%)
Place of birth for the foreign-born population - Trinidad and Tobago (%)
Place of birth for the foreign-born population - West Indies (%)
Place of birth for the foreign-born population - Other Caribbean (%)
Place of birth for the foreign-born population - Belize (%)
Place of birth for the foreign-born population - Costa Rica (%)
Place of birth for the foreign-born population - El Salvador (%)
Place of birth for the foreign-born population - Guatemala (%)
Place of birth for the foreign-born population - Honduras (%)
Place of birth for the foreign-born population - Mexico (%)
Place of birth for the foreign-born population - Nicaragua (%)
Place of birth for the foreign-born population - Panama (%)
Place of birth for the foreign-born population - Other Central America (%)
Place of birth for the foreign-born population - Argentina (%)
Place of birth for the foreign-born population - Bolivia (%)
Place of birth for the foreign-born population - Brazil (%)
Place of birth for the foreign-born population - Chile (%)
Place of birth for the foreign-born population - Colombia (%)
Place of birth for the foreign-born population - Ecuador (%)
Place of birth for the foreign-born population - Guyana (%)
Place of birth for the foreign-born population - Peru (%)
Place of birth for the foreign-born population - Uruguay (%)
Place of birth for the foreign-born population - Venezuela (%)
Place of birth for the foreign-born population - Other South America (%)
Place of birth for the foreign-born population - Canada (%)
Place of birth for the foreign-born population - Other Northern America (%)
Place of birth for the foreign-born population - Other (%)
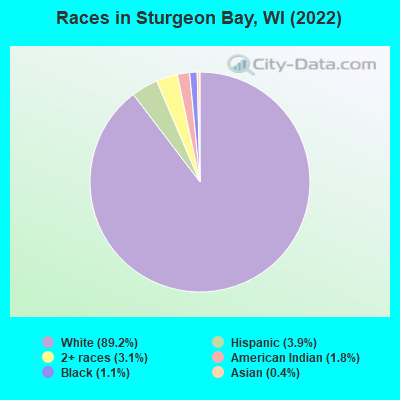
According to 2022 data, the most numerous races in Sturgeon Bay, WI are White alone (8,597 residents), Hispanic (372 residents), and Black alone (109 residents). 97.0% of Sturgeon Bay residents speak English at home. 1.8% of Sturgeon Bay, WI residents are foreign-born , which is 172.2% less than the foreign-born rate of 5.0% across the entire state of Wisconsin.
Race distribution in Sturgeon Bay
2000 2022
4,681,630 87.3% White alone 300,245 5.6% Black alone 192,921 3.6% Hispanic 87,995 1.6% Asian alone 51,921 1.0% Two or more races 43,980 0.8% American Indian alone 3,637 0.07% Other race alone 1,346 0.03% Native Hawaiian and Other
4,654,031 79.0% White alone 447,022 7.6% Hispanic 345,678 5.9% Black alone 217,532 3.7% Two or more races 172,242 2.9% Asian alone 33,762 0.6% American Indian alone 19,680 0.3% Other race alone 2,592 0.04% Native Hawaiian and Other
Income and house value in Sturgeon Bay Median household income in 2022 $55,552 White non-Hispanic householders$84,963 American Indian and Alaska Native householders$31,706 Two or more races householders$50,249 Hispanic or Latino race householdersMedian 2022 house value $208,505 White Non-Hispanic householders $196,921 Asian householders$40,542 Two or more races householders$318,549 Hispanic or Latino householders
Median age by race in Sturgeon Bay
50.3 Median age for White residents46.0 55.9 13.6 Median age for Black or African American residents13.0 35.7 27.0 Median age for American Indian / Alaska Native residents9.3 33.1 65.9 Median age for Asian residents44.2 71.3 -825,688,072.6 Median age for Native Hawaiian / Pacific Islander residents-862,745,097.2 -732,444,443.7 -708,333,332.6 Median age for Other race residents-708,609,270.8 -709,832,133.6 19.7 Median age for Two or more races residents16.7 19.8 50.2 Median age for White alone residents46.0 55.5 34.1 Median age for Hispanic or Latino residents34.2 27.1
Owner/renter occupied households by race in Sturgeon Bay
House owners and renters - White residents 3,137 69.8% Owner occupied1,354 30.2% Renter occupiedHouse owners and renters - American Indian / Alaska Native residents 99 83.4% Owner occupied20 16.6% Renter occupiedHouse owners and renters - Asian residents 10 92.0% Owner occupied1 8.0% Renter occupiedHouse owners and renters - Two or more races residents 84 100.0% Owner occupiedHouse owners and renters - White alone residents 3,065 69.0% Owner occupied1,379 31.0% Renter occupiedHouse owners and renters - Hispanic or Latino residents 125 100.0% Owner occupied
Language usage in Sturgeon Bay
English speakers - Total 97.0% of residents of Sturgeon Bay speak English at home.
1.8% of residents speak Spanish at home 167 100.0% Speak English very well1.0% of residents speak other language at home 74 79.6% Speak English very well19 20.4% Speak English less than very well
English speakers - Born in the United States 97.2% of residents of Sturgeon Bay speak English at home.
1.8% of residents speak Spanish at home 48 100.0% Speak English very well0.8% of residents speak other language at home 21 100.0% Speak English very well
English speakers - Native, born elsewhere 0.0% of residents of Sturgeon Bay speak English at home.
English speakers - Foreign-born 27.1% of residents of Sturgeon Bay speak English at home.
34.5% of residents speak Spanish at home 61 100.0% Speak English very well31.1% of residents speak other language at home 35 63.6% Speak English very well20 36.4% Speak English less than very well
White (Caucasian) - Speak only English Native:
99.4% (8,365)Foreign-born:
100.0% (18)
American Indian / Alaska Native - Speak only English Native:
94.8% (150)Foreign-born:
26.3% (28)
Asian - Speak another language Native:
91.9% (1)Foreign-born:
96.1% (34)
Two or more races - Speak only English Native:
75.9% (294)Foreign-born:
2.1% (1)
Two or more races - Speak another language Native:
23.8% (92)Foreign-born:
100.0% (63)
White alone - Speak only English Native:
98.9% (8,307)Foreign-born:
99.9% (25)
Hispanic or Latino - Speak another language Native:
23.8% (50)Foreign-born:
100.0% (94)
Foreign-born residents in Sturgeon Bay 177 residents are foreign born
This city:
1.8%Wisconsin:
5.0%
Marital status for residents in Sturgeon Bay Marital status - White (Caucasian) population 15 years and over
Males 31.6% Never married49.9% Now married0.1% Separated2.9% Widowed15.6% DivorcedFemales 15.0% Never married48.1% Now married0.9% Separated9.6% Widowed26.5% DivorcedWomen who gave birth in the past 12 months Now married:
66.3% (55)Unmarried:
33.7% (28)
Women who did not give birth in the past 12 months Now married:
54.7% (715)Unmarried:
45.3% (591)
Marital status - Black or African American population 15 years and over
Males 100.0% Never married0.0% Now married0.0% Separated0.0% Widowed0.0% DivorcedFemales 100.0% Never married0.0% Now married0.0% Separated0.0% Widowed0.0% DivorcedWomen who gave birth in the past 12 months Now married:
0.0% (0)Unmarried:
100.0% (44)
Marital status - American Indian / Alaska Native population 15 years and over
Males 17.9% Never married78.6% Now married3.6% Separated0.0% Widowed0.0% DivorcedFemales 41.2% Never married12.8% Now married0.0% Separated0.0% Widowed45.9% DivorcedWomen who did not give birth in the past 12 months Now married:
0.0% (0)Unmarried:
100.0% (122)
Marital status - Asian population 15 years and over
Males 66.7% Never married33.3% Now married0.0% Separated0.0% Widowed0.0% DivorcedFemales 3.2% Never married71.0% Now married0.0% Separated25.8% Widowed0.0% DivorcedWomen who gave birth in the past 12 months Now married:
98.6% (1)Unmarried:
0.0% (0)
Women who did not give birth in the past 12 months Now married:
66.7% (2)Unmarried:
33.3% (1)
Marital status - Two or more races population 15 years and over
Males 30.1% Never married69.9% Now married0.0% Separated0.0% Widowed0.0% DivorcedFemales 50.9% Never married28.4% Now married0.0% Separated20.1% Widowed0.6% DivorcedWomen who gave birth in the past 12 months Now married:
100.0% (43)Unmarried:
0.0% (0)
Women who did not give birth in the past 12 months Now married:
18.1% (28)Unmarried:
81.9% (128)
Marital status - White alone, not Hispanic / Latino population 15 years and over
Males 32.3% Never married48.7% Now married0.1% Separated2.9% Widowed16.0% DivorcedFemales 15.0% Never married48.1% Now married0.9% Separated9.6% Widowed26.5% DivorcedWomen who gave birth in the past 12 months Now married:
66.3% (56)Unmarried:
33.7% (29)
Women who did not give birth in the past 12 months Now married:
54.7% (729)Unmarried:
45.3% (603)
Marital status - Hispanic or Latino population 15 years and over
Males 2.0% Never married98.0% Now married0.0% Separated0.0% Widowed0.0% DivorcedFemales 56.4% Never married34.3% Now married0.0% Separated9.3% Widowed0.0% DivorcedWomen who gave birth in the past 12 months Now married:
100.0% (30)Unmarried:
0.0% (0)
Women who did not give birth in the past 12 months Now married:
19.4% (20)Unmarried:
80.6% (82)
Ancestries in Sturgeon Bay
1,598 37.4% German265 6.2% American264 6.2% English236 5.5% European214 5.0% Belgian184 4.3% Irish163 3.8% Polish153 3.6% French120 2.8% Norwegian89 2.1% Scottish52 1.2% Scandinavian51 1.2% Northern European41 1.0% French Canadian37 0.9% Finnish34 0.8% Scotch-Irish23 0.5% Alsatian22 0.5% Dutch21 0.5% Russian19 0.4% Danish17 0.4% Hungarian17 0.4% Italian16 0.4% Slovene6 0.1% Swedish3 0.07% Czech
Children Nativity (place of birth) in Sturgeon Bay
Children under 6 years - Living with two parents Both parents native 252 100.0% NativeOne native, one foreign-born parent 11 100.0% NativeChildren under 6 years - Living with one parent Native parent 127 100.0% NativeChildren 6 to 17 years - Living with two parents Both parents native 785 100.0% NativeOne native, one foreign-born parent 70 100.0% NativeChildren 6 to 17 years - Living with one parent Native parent 439 99.9% Native0 0.1% Foreign-bornForeign-born parent 2 73.8% Native1 26.2% Foreign-born
Grandparents responsible for own grandchildren in Sturgeon Bay
Grandparents (30 to 59 years) White / Caucasian 11 52.4% Responsible for grandchildren10 47.6% Not responsible for grandchildrenAsian 1 93.2% Responsible for grandchildrenWhite alone, not Hispanic / Latino 11 52.5% Responsible for grandchildren10 47.5% Not responsible for grandchildren
Grandparents (60 years and over) White / Caucasian 14 100.0% Responsible for grandchildrenWhite alone, not Hispanic / Latino 15 100.0% Responsible for grandchildren