Races in Summerville, South Carolina (SC) Detailed Stats
Data:
Races - White alone (%)
Races - White alone (% change since 2000)
Races - Black alone (%)
Races - Black alone (% change since 2000)
Races - American Indian alone (%)
Races - American Indian alone (% change since 2000)
Races - Asian alone (%)
Races - Asian alone (% change since 2000)
Races - Hispanic (%)
Races - Hispanic (% change since 2000)
Races - Native Hawaiian and Other Pacific Islander alone (%)
Races - Native Hawaiian and Other Pacific Islander alone (% change since 2000)
Races - Two or more races(%)
Races - Two or more races(% change since 2000)
Races - Other race alone (%)
Races - Other race alone (% change since 2000)
Racial diversity
Place of birth - Born in state of residence (%)
Place of birth - Born in state of residence (%) - White
Place of birth - Born in state of residence (%) - Black or African American
Place of birth - Born in state of residence (%) - Asian
Place of birth - Born in state of residence (%) - Hispanic or Latino
Place of birth - Born in state of residence (%) - American Indian and Alaska Native
Place of birth - Born in state of residence (%) - Multirace
Place of birth - Born in state of residence (%) - Other Race
Place of birth - Born in other state (%)
Place of birth - Born in other state (%) - White
Place of birth - Born in other state (%) - Black or African American
Place of birth - Born in other state (%) - Asian
Place of birth - Born in other state (%) - Hispanic or Latino
Place of birth - Born in other state (%) - American Indian and Alaska Native
Place of birth - Born in other state (%) - Multirace
Place of birth - Born in other state (%) - Other Race
Place of birth - Native, outside of US (%)
Place of birth - Native, outside of US (%) - White
Place of birth - Native, outside of US (%) - Black or African American
Place of birth - Native, outside of US (%) - Asian
Place of birth - Native, outside of US (%) - Hispanic or Latino
Place of birth - Native, outside of US (%) - American Indian and Alaska Native
Place of birth - Native, outside of US (%) - Multirace
Place of birth - Native, outside of US (%) - Other Race
Place of birth - Foreign born (%)
Place of birth - Foreign born (%) - White
Place of birth - Foreign born (%) - Black or African American
Place of birth - Foreign born (%) - Asian
Place of birth - Foreign born (%) - Hispanic or Latino
Place of birth - Foreign born (%) - American Indian and Alaska Native
Place of birth - Foreign born (%) - Multirace
Place of birth - Foreign born (%) - Other Race
Residents speaking English at home (%)
Residents speaking English at home - Born in the United States (%)
Residents speaking English at home - Native, born elsewhere (%)
Residents speaking English at home - Foreign born (%)
Residents speaking Spanish at home (%)
Residents speaking Spanish at home - Born in the United States (%)
Residents speaking Spanish at home - Native, born elsewhere (%)
Residents speaking Spanish at home - Foreign born (%)
Residents speaking other language at home (%)
Residents speaking other language at home - Born in the United States (%)
Residents speaking other language at home - Native, born elsewhere (%)
Residents speaking other language at home - Foreign born (%)
Marital status - Never married (%)
Marital status - Now married (%)
Marital status - Separated (%)
Marital status - Widowed (%)
Marital status - Divorced (%)
Ancestries Reported - Arab (%)
Ancestries Reported - Czech (%)
Ancestries Reported - Danish (%)
Ancestries Reported - Dutch (%)
Ancestries Reported - English (%)
Ancestries Reported - French (%)
Ancestries Reported - French Canadian (%)
Ancestries Reported - German (%)
Ancestries Reported - Greek (%)
Ancestries Reported - Hungarian (%)
Ancestries Reported - Irish (%)
Ancestries Reported - Italian (%)
Ancestries Reported - Lithuanian (%)
Ancestries Reported - Norwegian (%)
Ancestries Reported - Polish (%)
Ancestries Reported - Portuguese (%)
Ancestries Reported - Russian (%)
Ancestries Reported - Scotch-Irish (%)
Ancestries Reported - Scottish (%)
Ancestries Reported - Slovak (%)
Ancestries Reported - Subsaharan African (%)
Ancestries Reported - Swedish (%)
Ancestries Reported - Swiss (%)
Ancestries Reported - Ukrainian (%)
Ancestries Reported - United States (%)
Ancestries Reported - Welsh (%)
Ancestries Reported - West Indian (%)
Ancestries Reported - Other (%)
Geographical mobility - Same house 1 year ago (%)
Geographical mobility - Same house 1 year ago (%) - White
Geographical mobility - Same house 1 year ago (%) - Black or African American
Geographical mobility - Same house 1 year ago (%) - Asian
Geographical mobility - Same house 1 year ago (%) - Hispanic or Latino
Geographical mobility - Same house 1 year ago (%) - American Indian and Alaska Native
Geographical mobility - Same house 1 year ago (%) - Multirace
Geographical mobility - Same house 1 year ago (%) - Other Race
Geographical mobility - Moved within same county (%)
Geographical mobility - Moved within same county (%) - White
Geographical mobility - Moved within same county (%) - Black or African American
Geographical mobility - Moved within same county (%) - Asian
Geographical mobility - Moved within same county (%) - Hispanic or Latino
Geographical mobility - Moved within same county (%) - American Indian and Alaska Native
Geographical mobility - Moved within same county (%) - Multirace
Geographical mobility - Moved within same county (%) - Other Race
Geographical mobility - Moved from different county within same state (%)
Geographical mobility - Moved from different county within same state (%) - White
Geographical mobility - Moved from different county within same state (%) - Black or African American
Geographical mobility - Moved from different county within same state (%) - Asian
Geographical mobility - Moved from different county within same state (%) - Hispanic or Latino
Geographical mobility - Moved from different county within same state (%) - American Indian and Alaska Native
Geographical mobility - Moved from different county within same state (%) - Multirace
Geographical mobility - Moved from different county within same state (%) - Other Race
Geographical mobility - Moved from different state (%)
Geographical mobility - Moved from different state (%) - White
Geographical mobility - Moved from different state (%) - Black or African American
Geographical mobility - Moved from different state (%) - Asian
Geographical mobility - Moved from different state (%) - Hispanic or Latino
Geographical mobility - Moved from different state (%) - American Indian and Alaska Native
Geographical mobility - Moved from different state (%) - Multirace
Geographical mobility - Moved from different state (%) - Other Race
Geographical mobility - Moved from abroad (%)
Geographical mobility - Moved from abroad (%) - White
Geographical mobility - Moved from abroad (%) - Black or African American
Geographical mobility - Moved from abroad (%) - Asian
Geographical mobility - Moved from abroad (%) - Hispanic or Latino
Geographical mobility - Moved from abroad (%) - American Indian and Alaska Native
Geographical mobility - Moved from abroad (%) - Multirace
Geographical mobility - Moved from abroad (%) - Other Race
Place of birth for the foreign-born population - Ireland (%)
Place of birth for the foreign-born population - Denmark (%)
Place of birth for the foreign-born population - Norway (%)
Place of birth for the foreign-born population - Sweden (%)
Place of birth for the foreign-born population - United Kingdom (%)
Place of birth for the foreign-born population - England (%)
Place of birth for the foreign-born population - Scotland (%)
Place of birth for the foreign-born population - Other Northern Europe (%)
Place of birth for the foreign-born population - Austria (%)
Place of birth for the foreign-born population - Belgium (%)
Place of birth for the foreign-born population - France (%)
Place of birth for the foreign-born population - Germany (%)
Place of birth for the foreign-born population - Netherlands (%)
Place of birth for the foreign-born population - Switzerland (%)
Place of birth for the foreign-born population - Other Western Europe (%)
Place of birth for the foreign-born population - Greece (%)
Place of birth for the foreign-born population - Italy (%)
Place of birth for the foreign-born population - Portugal (%)
Place of birth for the foreign-born population - Spain (%)
Place of birth for the foreign-born population - Other Southern Europe (%)
Place of birth for the foreign-born population - Albania (%)
Place of birth for the foreign-born population - Belarus (%)
Place of birth for the foreign-born population - Bosnia and Herzegovina (%)
Place of birth for the foreign-born population - Bulgaria (%)
Place of birth for the foreign-born population - Croatia (%)
Place of birth for the foreign-born population - Czechoslovakia (%)
Place of birth for the foreign-born population - Hungary (%)
Place of birth for the foreign-born population - Latvia (%)
Place of birth for the foreign-born population - Lithuania (%)
Place of birth for the foreign-born population - North Macedonia (Macedonia) (%)
Place of birth for the foreign-born population - Moldova (%)
Place of birth for the foreign-born population - Poland (%)
Place of birth for the foreign-born population - Romania (%)
Place of birth for the foreign-born population - Russia (%)
Place of birth for the foreign-born population - Serbia (%)
Place of birth for the foreign-born population - Ukraine (%)
Place of birth for the foreign-born population - Other Eastern Europe (%)
Place of birth for the foreign-born population - China (%)
Place of birth for the foreign-born population - Hong Kong (%)
Place of birth for the foreign-born population - Taiwan (%)
Place of birth for the foreign-born population - Japan (%)
Place of birth for the foreign-born population - Korea (%)
Place of birth for the foreign-born population - Other Eastern Asia (%)
Place of birth for the foreign-born population - Afghanistan (%)
Place of birth for the foreign-born population - Bangladesh (%)
Place of birth for the foreign-born population - India (%)
Place of birth for the foreign-born population - Iran (%)
Place of birth for the foreign-born population - Kazakhstan (%)
Place of birth for the foreign-born population - Nepal (%)
Place of birth for the foreign-born population - Pakistan (%)
Place of birth for the foreign-born population - Sri Lanka (%)
Place of birth for the foreign-born population - Uzbekistan (%)
Place of birth for the foreign-born population - Other South Central Asia (%)
Place of birth for the foreign-born population - Burma (%)
Place of birth for the foreign-born population - Cambodia (%)
Place of birth for the foreign-born population - Indonesia (%)
Place of birth for the foreign-born population - Laos (%)
Place of birth for the foreign-born population - Malaysia (%)
Place of birth for the foreign-born population - Philippines (%)
Place of birth for the foreign-born population - Singapore (%)
Place of birth for the foreign-born population - Thailand (%)
Place of birth for the foreign-born population - Vietnam (%)
Place of birth for the foreign-born population - Other South Eastern Asia (%)
Place of birth for the foreign-born population - Armenia (%)
Place of birth for the foreign-born population - Iraq (%)
Place of birth for the foreign-born population - Israel (%)
Place of birth for the foreign-born population - Jordan (%)
Place of birth for the foreign-born population - Kuwait (%)
Place of birth for the foreign-born population - Lebanon (%)
Place of birth for the foreign-born population - Saudi Arabia (%)
Place of birth for the foreign-born population - Syria (%)
Place of birth for the foreign-born population - Turkey (%)
Place of birth for the foreign-born population - Yemen (%)
Place of birth for the foreign-born population - Other Western Asia (%)
Place of birth for the foreign-born population - Eritrea (%)
Place of birth for the foreign-born population - Ethiopia (%)
Place of birth for the foreign-born population - Kenya (%)
Place of birth for the foreign-born population - Somalia (%)
Place of birth for the foreign-born population - Uganda (%)
Place of birth for the foreign-born population - Zimbabwe (%)
Place of birth for the foreign-born population - Other Eastern Africa (%)
Place of birth for the foreign-born population - Cameroon (%)
Place of birth for the foreign-born population - Congo (%)
Place of birth for the foreign-born population - Democratic Republic of Congo (Zaire) (%)
Place of birth for the foreign-born population - Other Middle Africa (%)
Place of birth for the foreign-born population - Egypt (%)
Place of birth for the foreign-born population - Morocco (%)
Place of birth for the foreign-born population - Sudan (%)
Place of birth for the foreign-born population - Other Northern Africa (%)
Place of birth for the foreign-born population - South Africa (%)
Place of birth for the foreign-born population - Other Southern Africa (%)
Place of birth for the foreign-born population - Cabo Verde (%)
Place of birth for the foreign-born population - Ghana (%)
Place of birth for the foreign-born population - Liberia (%)
Place of birth for the foreign-born population - Nigeria (%)
Place of birth for the foreign-born population - Senegal (%)
Place of birth for the foreign-born population - Sierra Leone (%)
Place of birth for the foreign-born population - Other Western Africa (%)
Place of birth for the foreign-born population - Australia (%)
Place of birth for the foreign-born population - New Zealand (%)
Place of birth for the foreign-born population - Fiji (%)
Place of birth for the foreign-born population - Micronesia (%)
Place of birth for the foreign-born population - Bahamas (%)
Place of birth for the foreign-born population - Barbados (%)
Place of birth for the foreign-born population - Cuba (%)
Place of birth for the foreign-born population - Dominica (%)
Place of birth for the foreign-born population - Dominican Republic (%)
Place of birth for the foreign-born population - Grenada (%)
Place of birth for the foreign-born population - Haiti (%)
Place of birth for the foreign-born population - Jamaica (%)
Place of birth for the foreign-born population - St. Vincent and the Grenadines (%)
Place of birth for the foreign-born population - Trinidad and Tobago (%)
Place of birth for the foreign-born population - West Indies (%)
Place of birth for the foreign-born population - Other Caribbean (%)
Place of birth for the foreign-born population - Belize (%)
Place of birth for the foreign-born population - Costa Rica (%)
Place of birth for the foreign-born population - El Salvador (%)
Place of birth for the foreign-born population - Guatemala (%)
Place of birth for the foreign-born population - Honduras (%)
Place of birth for the foreign-born population - Mexico (%)
Place of birth for the foreign-born population - Nicaragua (%)
Place of birth for the foreign-born population - Panama (%)
Place of birth for the foreign-born population - Other Central America (%)
Place of birth for the foreign-born population - Argentina (%)
Place of birth for the foreign-born population - Bolivia (%)
Place of birth for the foreign-born population - Brazil (%)
Place of birth for the foreign-born population - Chile (%)
Place of birth for the foreign-born population - Colombia (%)
Place of birth for the foreign-born population - Ecuador (%)
Place of birth for the foreign-born population - Guyana (%)
Place of birth for the foreign-born population - Peru (%)
Place of birth for the foreign-born population - Uruguay (%)
Place of birth for the foreign-born population - Venezuela (%)
Place of birth for the foreign-born population - Other South America (%)
Place of birth for the foreign-born population - Canada (%)
Place of birth for the foreign-born population - Other Northern America (%)
Place of birth for the foreign-born population - Other (%)
Latest news about races in Summerville, SC collected exclusively by city-data.com from local newspapers, TV, and radio stations
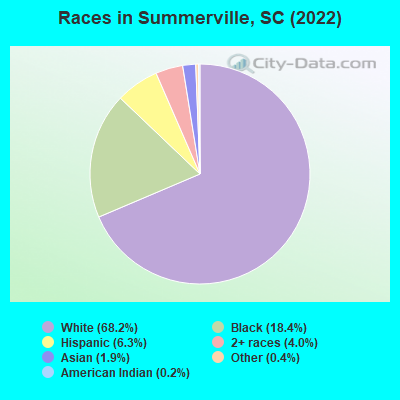
According to 2022 data, the most numerous races in Summerville, SC are White alone (35,503 residents), Black alone (9,575 residents), and Hispanic (3,284 residents). 94.8% of Summerville residents speak English at home. 4.7% of Summerville, SC residents are foreign-born (2.2% born in Latin America, 1.4% born in Asia, 0.8% born in Europe), which is 6.4% less than the foreign-born rate of 5.0% across the entire state of South Carolina.
Race distribution in Summerville
2000 2022
2,652,291 66.1% White alone 1,178,486 29.4% Black alone 95,076 2.4% Hispanic 35,568 0.9% Asian alone 33,290 0.8% Two or more races 12,765 0.3% American Indian alone 3,266 0.08% Other race alone 1,270 0.03% Native Hawaiian and Other
3,301,739 62.5% White alone 1,313,290 24.9% Black alone 343,783 6.5% Hispanic 190,508 3.6% Two or more races 89,888 1.7% Asian alone 29,390 0.6% Other race alone 12,112 0.2% American Indian alone 1,924 0.04% Native Hawaiian and Other
Income and house value in Summerville Median household income in 2022 $81,982 White non-Hispanic householders$38,154 Black householdersover $200,000 American Indian and Alaska Native householders$60,939 Asian householders$70,556 Some other race householders$58,406 Two or more races householders$74,066 Hispanic or Latino race householdersMedian 2022 house value $371,834 White Non-Hispanic householders$251,428 Black or African American householders$338,169 American Indian or Alaska Native householders $370,317 Asian householders$257,797 Some other race householders$341,202 Two or more races householders$396,400 Hispanic or Latino householders
Median age by race in Summerville
40.1 Median age for White residents39.4 41.6 34.0 Median age for Black or African American residents29.1 36.6 51.5 Median age for American Indian / Alaska Native residents48.7 58.1 44.9 Median age for Asian residents49.3 38.1 -698,412,697.7 Median age for Native Hawaiian / Pacific Islander residents-551,574,375.1 -1,016,109,044.8 34.3 Median age for Other race residents28.2 49.1 30.1 Median age for Two or more races residents25.7 37.6 40.5 Median age for White alone residents40.1 41.1 35.2 Median age for Hispanic or Latino residents32.4 42.1
Owner/renter occupied households by race in Summerville
House owners and renters - White residents 11,990 76.9% Owner occupied3,608 23.1% Renter occupiedHouse owners and renters - Black or African American residents 2,225 57.1% Owner occupied1,673 42.9% Renter occupiedHouse owners and renters - American Indian / Alaska Native residents 111 88.2% Owner occupied15 11.8% Renter occupiedHouse owners and renters - Asian residents 392 86.6% Owner occupied61 13.4% Renter occupiedHouse owners and renters - Native Hawaiian / Pacific Islander residents 13 100.0% Owner occupiedHouse owners and renters - Other race residents 453 84.6% Owner occupied82 15.4% Renter occupiedHouse owners and renters - Two or more races residents 474 63.3% Owner occupied275 36.7% Renter occupiedHouse owners and renters - White alone residents 11,877 76.6% Owner occupied3,633 23.4% Renter occupiedHouse owners and renters - Hispanic or Latino residents 632 70.1% Owner occupied270 29.9% Renter occupied
Language usage in Summerville
English speakers - Total 94.8% of residents of Summerville speak English at home.
2.6% of residents speak Spanish at home 954 76.9% Speak English very well287 23.1% Speak English less than very well2.4% of residents speak other language at home 791 67.1% Speak English very well387 32.9% Speak English less than very well
English speakers - Born in the United States 95.8% of residents of Summerville speak English at home.
2.7% of residents speak Spanish at home 529 80.6% Speak English very well127 19.4% Speak English less than very well1.5% of residents speak other language at home 286 79.4% Speak English very well74 20.6% Speak English less than very well
English speakers - Native, born elsewhere 50.7% of residents of Summerville speak English at home.
46.5% of residents speak Spanish at home 176 51.5% Speak English very well166 48.5% Speak English less than very well5.2% of residents speak other language at home 38 100.0% Speak English very well
English speakers - Foreign-born 42.0% of residents of Summerville speak English at home.
33.4% of residents speak Spanish at home 182 34.5% Speak English very well345 65.5% Speak English less than very well38.8% of residents speak other language at home 322 52.5% Speak English very well291 47.5% Speak English less than very well
White (Caucasian) - Speak only English Native:
97.7% (32,537)Foreign-born:
43.9% (221)
White (Caucasian) - Speak another language Native:
2.3% (775)Foreign-born:
49.9% (251)
Black or African American - Speak only English Native:
98.8% (9,108)Foreign-born:
68.5% (135)
Asian - Speak only English Native:
87.2% (173)Foreign-born:
35.4% (282)
Asian - Speak another language Native:
14.6% (29)Foreign-born:
64.3% (512)
Other race - Speak another language Native:
24.0% (192)Foreign-born:
98.6% (409)
Two or more races - Speak only English Native:
86.5% (2,655)Foreign-born:
46.4% (264)
Two or more races - Speak another language Native:
12.7% (389)Foreign-born:
12.4% (71)
White alone - Speak only English Native:
97.7% (32,189)Foreign-born:
49.2% (225)
White alone - Speak another language Native:
2.3% (773)Foreign-born:
48.5% (222)
Hispanic or Latino - Speak only English Native:
75.1% (2,148)Foreign-born:
33.3% (131)
Hispanic or Latino - Speak another language Native:
26.0% (743)Foreign-born:
100.0% (393)
Foreign-born residents in Summerville 2,447 residents are foreign born (2.2% Latin America , 1.4% Asia , 0.8% Europe ).
This city:
4.7%South Carolina:
5.3%
Marital status for residents in Summerville Marital status - White (Caucasian) population 15 years and over
Males 24.4% Never married61.5% Now married1.1% Separated2.4% Widowed10.6% DivorcedFemales 20.5% Never married52.7% Now married1.0% Separated11.9% Widowed13.9% DivorcedWomen who gave birth in the past 12 months Now married:
73.2% (321)Unmarried:
26.8% (118)
Women who did not give birth in the past 12 months Now married:
51.4% (3,807)Unmarried:
48.6% (3,595)
Marital status - Black or African American population 15 years and over
Males 53.6% Never married34.7% Now married2.8% Separated1.4% Widowed7.6% DivorcedFemales 45.0% Never married26.7% Now married10.2% Separated5.9% Widowed12.1% DivorcedWomen who gave birth in the past 12 months Now married:
24.8% (25)Unmarried:
75.2% (75)
Women who did not give birth in the past 12 months Now married:
28.4% (738)Unmarried:
71.6% (1,864)
Marital status - American Indian / Alaska Native population 15 years and over
Males 26.7% Never married73.3% Now married0.0% Separated0.0% Widowed0.0% DivorcedFemales 0.0% Never married100.0% Now married0.0% Separated0.0% Widowed0.0% DivorcedWomen who did not give birth in the past 12 months Now married:
100.0% (18)Unmarried:
0.0% (0)
Marital status - Asian population 15 years and over
Males 12.8% Never married71.7% Now married15.6% Separated0.0% Widowed0.0% DivorcedFemales 38.0% Never married56.0% Now married2.7% Separated3.3% Widowed0.0% DivorcedWomen who gave birth in the past 12 months Now married:
100.0% (25)Unmarried:
0.0% (0)
Women who did not give birth in the past 12 months Now married:
48.8% (205)Unmarried:
51.2% (215)
Marital status - Native Hawaiian / Pacific Islander population 15 years and over
Males 0.0% Never married100.0% Now married0.0% Separated0.0% Widowed0.0% DivorcedFemales 0.0% Never married0.0% Now married0.0% Separated0.0% Widowed100.0% DivorcedMarital status - Other race population 15 years and over
Males 38.6% Never married37.5% Now married0.6% Separated23.3% Widowed0.0% DivorcedFemales 25.2% Never married31.0% Now married3.1% Separated8.4% Widowed32.3% DivorcedWomen who did not give birth in the past 12 months Now married:
30.5% (142)Unmarried:
69.5% (323)
Marital status - Two or more races population 15 years and over
Males 33.0% Never married64.2% Now married1.7% Separated0.1% Widowed1.0% DivorcedFemales 23.4% Never married33.9% Now married5.0% Separated33.2% Widowed4.5% DivorcedWomen who did not give birth in the past 12 months Now married:
57.5% (385)Unmarried:
42.5% (285)
Marital status - White alone, not Hispanic / Latino population 15 years and over
Males 23.7% Never married62.1% Now married1.1% Separated2.5% Widowed10.5% DivorcedFemales 20.5% Never married52.5% Now married1.0% Separated12.0% Widowed14.1% DivorcedWomen who gave birth in the past 12 months Now married:
77.0% (320)Unmarried:
23.0% (96)
Women who did not give birth in the past 12 months Now married:
50.8% (3,774)Unmarried:
49.2% (3,652)
Marital status - Hispanic or Latino population 15 years and over
Males 40.0% Never married48.1% Now married0.2% Separated8.1% Widowed3.6% DivorcedFemales 13.0% Never married39.8% Now married1.5% Separated26.7% Widowed19.0% DivorcedWomen who gave birth in the past 12 months Now married:
20.0% (7)Unmarried:
80.0% (27)
Women who did not give birth in the past 12 months Now married:
50.8% (327)Unmarried:
49.2% (317)
Ancestries in Summerville
3,731 15.3% English2,871 11.7% German2,677 10.9% American1,820 7.4% Irish881 3.6% Italian464 1.9% Scottish443 1.8% European370 1.5% French238 1.0% French Canadian212 0.9% Lebanese202 0.8% Romanian197 0.8% Dutch195 0.8% Armenian181 0.7% Polish177 0.7% Scotch-Irish156 0.6% African128 0.5% Canadian122 0.5% Belgian116 0.5% British70 0.3% Scandinavian69 0.3% Eastern European67 0.3% Greek62 0.3% Slovak53 0.2% Israeli36 0.1% Australian33 0.1% Danish30 0.1% Finnish30 0.1% Bahamian28 0.1% Jamaican24 0.10% Northern European20 0.08% Haitian20 0.08% West Indian19 0.08% Hungarian18 0.07% Swedish17 0.07% Welsh16 0.07% Norwegian14 0.06% Czech14 0.06% Czechoslovakian11 0.04% Lithuanian9 0.04% Portuguese4 0.02% Austrian
Geographical mobility in Summerville Same house 1 year ago 30,286 84.6% White (Caucasian)7,621 78.0% Black or African American140 86.0% American Indian / Alaska Native700 78.9% Asian12 34.7% Native Hawaiian / Pacific Islander1,064 87.8% Other race2,648 83.0% Two or more races29,799 84.2% White alone, not Hispanic / Latino2,707 84.8% Hispanic or LatinoMoved within same county 2,514 7.0% White / Caucasian993 10.2% Black or African American44 4.9% Asian16 1.3% Other race149 4.7% Two or more races2,542 7.2% White alone, not Hispanic / Latino46 1.4% Hispanic or LatinoMoved within same state 1,236 3.5% White / Caucasian544 5.6% Black or African American20 12.3% American Indian / Alaska Native170 19.2% Asian23 68.8% Native Hawaiian / Pacific Islander69 5.7% Other race408 12.8% Two or more races1,281 3.6% White alone, not Hispanic / Latino361 11.3% Hispanic or LatinoMoved from different state 1,879 5.2% White / Caucasian524 5.4% Black or African American14 1.6% Asian46 3.8% Other race27 0.9% Two or more races1,868 5.3% White alone, not Hispanic / Latino63 2.0% Hispanic or LatinoMoved from abroad 230 0.6% White46 0.5% Black or African American258 0.7% White alone, not Hispanic / Latino
Children Nativity (place of birth) in Summerville
Children under 6 years - Living with two parents Both parents native 2,609 100.0% NativeBoth parents foreign-born 3 10.9% Native28 89.1% Foreign-bornOne native, one foreign-born parent 54 100.0% NativeChildren under 6 years - Living with one parent Native parent 1,471 100.0% NativeChildren 6 to 17 years - Living with two parents Both parents native 4,369 99.7% Native14 0.3% Foreign-bornBoth parents foreign-born 86 68.2% Native40 31.8% Foreign-bornOne native, one foreign-born parent 159 100.0% NativeChildren 6 to 17 years - Living with one parent Native parent 2,254 100.0% NativeForeign-born parent 42 49.6% Native43 50.4% Foreign-born
Grandparents responsible for own grandchildren in Summerville
Grandparents (30 to 59 years) White / Caucasian 52 100.0% Responsible for grandchildrenBlack or African American 49 40.8% Responsible for grandchildren71 59.2% Not responsible for grandchildrenWhite alone, not Hispanic / Latino 53 100.0% Responsible for grandchildrenGrandparents (60 years and over) White / Caucasian 306 69.4% Responsible for grandchildren135 30.6% Not responsible for grandchildrenBlack or African American 223 59.3% Responsible for grandchildren153 40.7% Not responsible for grandchildrenWhite alone, not Hispanic / Latino 306 69.4% Responsible for grandchildren135 30.6% Not responsible for grandchildren