Races in Summit Park, Utah (UT) Detailed Stats
Ancestries, Foreign-born residents, place of birth
Settings
X


Recent posts about races in Summit Park, Utah on our local forum with over 2,400,000 registered users:
 | Black in SLC (154 replies) |
| Stansbury Park vs Park City vs Suncrest (32 replies) |
| Transfer from Atlanta to SLC (40 replies) |
| African American Family possibly relocating to SLC from Northeast (43 replies) |
| Holladay vs E Millcreek (13 replies) |
| Winter in Summit Park (2 replies) |
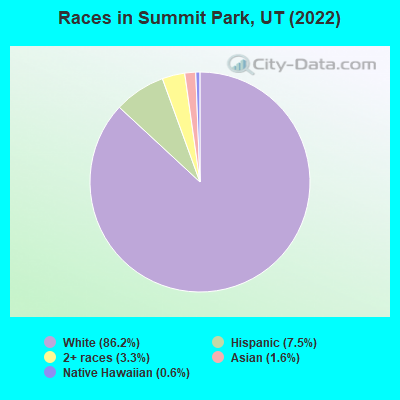
According to 2022 data, the most numerous races in Summit Park, UT are White alone (7,732 residents), Hispanic (673 residents), and Two or more races (299 residents). 88.5% of Summit Park residents speak English at home. 7.4% of Summit Park, UT residents are foreign-born (3.8% born in Latin America, 2.0% born in Europe, 0.9% born in Asia), which is 8.3% less than the foreign-born rate of 8.0% across the entire state of Utah.
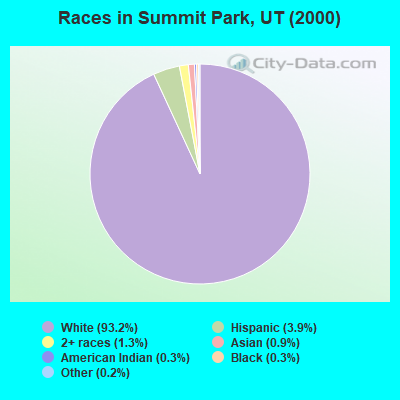
Race distribution in Summit Park
2000
2022

- 6,14993.2%White alone
- 2553.9%Hispanic
- 841.3%Two or more races
- 580.9%Asian alone
- 180.3%Black alone
- 200.3%American Indian alone
- 100.2%Other race alone
- 30.05%Native Hawaiian and Other
Pacific Islander alone
-
- 7,73286.2%White alone
- 6737.5%Hispanic
- 2993.3%Two or more races
- 1461.6%Asian alone
- 540.6%Native Hawaiian and Other
Pacific Islander alone - 50.06%Black alone
2000
2022
-
- 1,904,26585.3%White alone
- 201,5599.0%Hispanic
- 36,4831.6%Asian alone
- 31,3081.4%Two or more races
- 26,6631.2%American Indian alone
- 14,8060.7%Native Hawaiian and Other
Pacific Islander alone - 16,1370.7%Black alone
- 1,9480.09%Other race alone

-
- 2,557,46675.6%White alone
- 512,08615.1%Hispanic
- 119,3083.5%Two or more races
- 82,3882.4%Asian alone
- 36,9781.1%Native Hawaiian and Other
Pacific Islander alone - 34,8731.0%Black alone
- 22,8030.7%American Indian alone
- 14,8980.4%Other race alone

Income and house value in Summit Park
- Median household income in 2022
- $176,415White non-Hispanic householders
- over $200,000Asian householders
- $162,796Two or more races householders
- $158,262Hispanic or Latino race householders
- Median 2022 house value
- over $1,000,000White Non-Hispanic householders
- over $1,000,000Black or African American householders
- over $1,000,000American Indian or Alaska Native householders
- over $1,000,000Asian householders
- over $1,000,000Hispanic or Latino householders
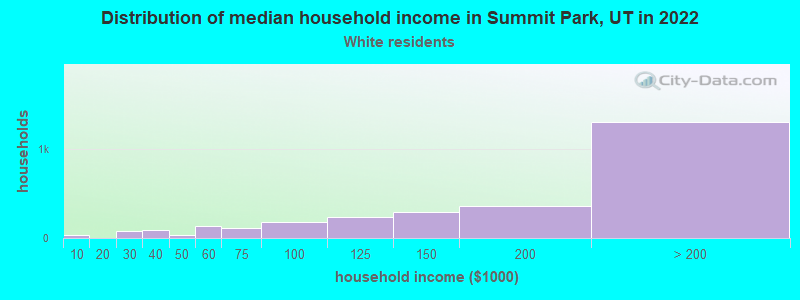
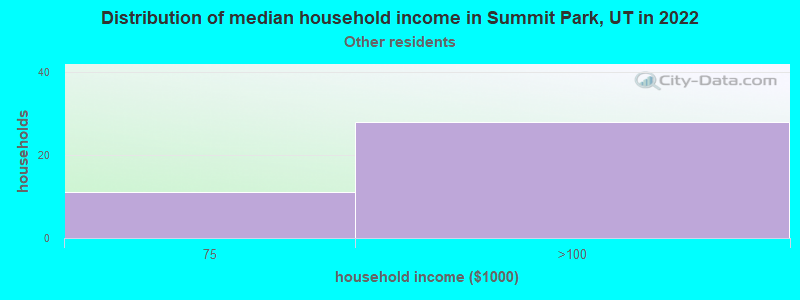
Household income for White non-Hispanic householders
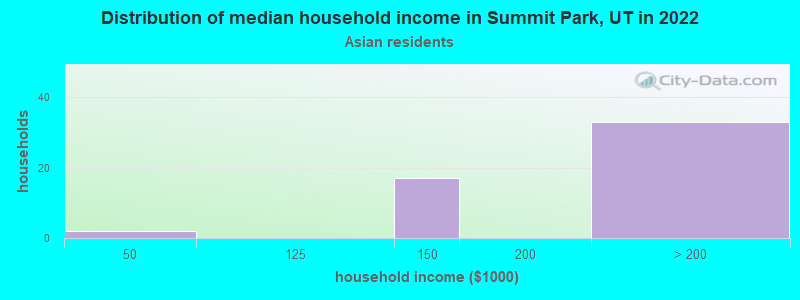
Household income for Asian householders
Household income for Some other race householders
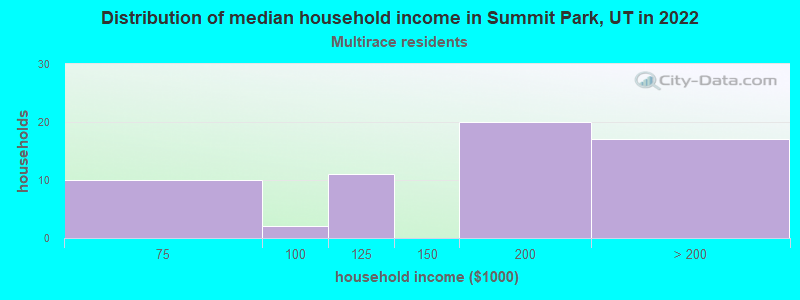
Household income for Two or more races householders
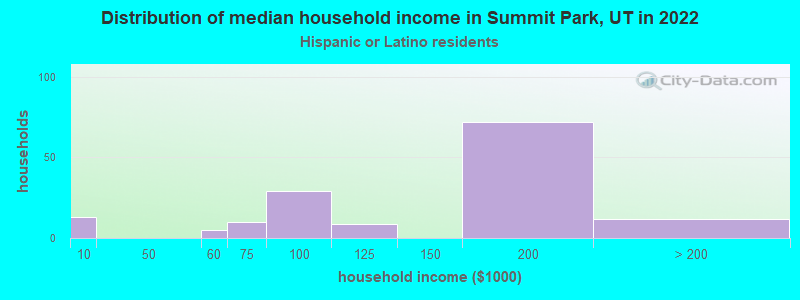
Household income for Hispanic or Latino race householders
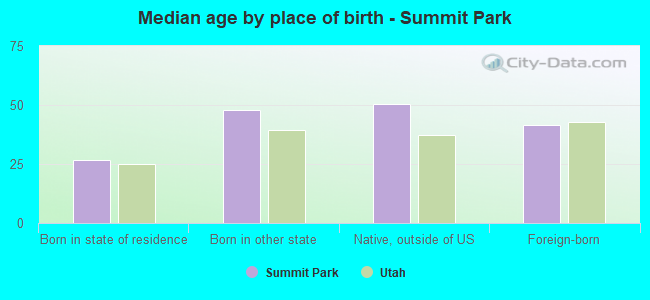
Median age by race in Summit Park
- 45.9Median age for White residents
- 42.7Males
- 48.3Females
- -640,726,328.8Median age for Black or African American residents
- -620,437,955.6Males
- -686,357,242.6Females
- -709,539,120.4Median age for American Indian / Alaska Native residents
- -720,955,482.4Males
- -694,006,308.5Females
- 24.6Median age for Asian residents
- 39.5Males
- 21.4Females
- 27.7Median age for Native Hawaiian / Pacific Islander residents
- -659,420,289.2Males
- 27.7Females
- 16.8Median age for Other race residents
- 37.0Males
- 10.0Females
- 27.0Median age for Two or more races residents
- 29.8Males
- 24.7Females
- 45.6Median age for White alone residents
- 42.3Males
- 48.1Females
- 26.2Median age for Hispanic or Latino residents
- 37.3Males
- 26.1Females
Owner/renter occupied households by race in Summit Park
- House owners and renters - White residents
- 2,36585.5%Owner occupied
- 40114.5%Renter occupied
- House owners and renters - Asian residents
- 4690.9%Owner occupied
- 59.1%Renter occupied
- House owners and renters - Other race residents
- 35100.0%Renter occupied
- House owners and renters - Two or more races residents
- 5595.2%Owner occupied
- 34.8%Renter occupied
- House owners and renters - White alone residents
- 2,37086.9%Owner occupied
- 35913.1%Renter occupied
- House owners and renters - Hispanic or Latino residents
- 4935.7%Owner occupied
- 8964.3%Renter occupied
Language usage in Summit Park
- English speakers - Total
- 88.5% of residents of Summit Park speak English at home.
- 6.5% of residents speak Spanish at home
- 22840.2%Speak English very well
- 33959.8%Speak English less than very well
- 5.1% of residents speak other language at home
- 37083.9%Speak English very well
- 7116.1%Speak English less than very well
- English speakers - Born in the United States
- 94.1% of residents of Summit Park speak English at home.
- 2.5% of residents speak Spanish at home
- 7651.7%Speak English very well
- 7148.3%Speak English less than very well
- 3.5% of residents speak other language at home
- 18688.6%Speak English very well
- 2411.4%Speak English less than very well
- English speakers - Native, born elsewhere
- 62.7% of residents of Summit Park speak English at home.
- 10.0% of residents speak Spanish at home
- 1881.8%Speak English very well
- 418.2%Speak English less than very well
- 30.9% of residents speak other language at home
- 68100.0%Speak English very well
- English speakers - Foreign-born
- 24.8% of residents of Summit Park speak English at home.
- 51.7% of residents speak Spanish at home
- 9026.3%Speak English very well
- 25273.7%Speak English less than very well
- 24.5% of residents speak other language at home
- 12375.9%Speak English very well
- 3924.1%Speak English less than very well
White (Caucasian) - Speak only English
| Native: | 95.6% (7,004) |
| Foreign-born: | 52.7% (131) |
White (Caucasian) - Speak another language
| Native: | 4.4% (321) |
| Foreign-born: | 52.8% (132) |
Asian - Speak only English
| Native: | 62.5% (38) |
| Foreign-born: | 18.7% (15) |
Asian - Speak another language
| Native: | 35.8% (22) |
| Foreign-born: | 81.4% (65) |
Other race - Speak another language
| Native: | 100.0% (4) |
| Foreign-born: | 97.1% (223) |
White alone - Speak only English
| Native: | 95.3% (6,970) |
| Foreign-born: | 65.7% (145) |
White alone - Speak another language
| Native: | 4.7% (341) |
| Foreign-born: | 35.6% (78) |
Hispanic or Latino - Speak another language
| Native: | 24.6% (61) |
| Foreign-born: | 99.4% (344) |
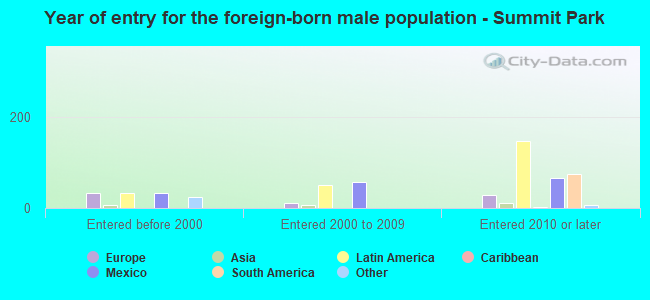
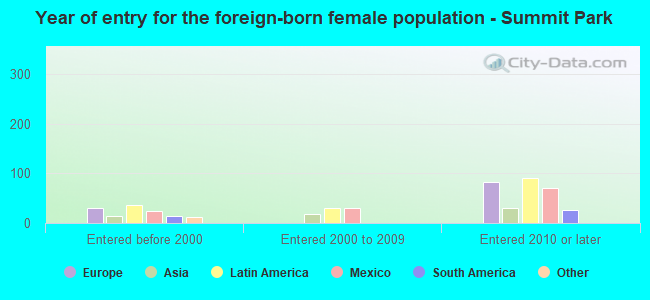
Foreign-born residents in Summit Park
662 residents are foreign born (3.8% Latin America, 2.0% Europe, 0.9% Asia).
| This city: | 7.4% |
| Utah: | 8.4% |
Marital status for residents in Summit Park
Marital status - White (Caucasian) population 15 years and over
- Males
- 31.9%Never married
- 57.3%Now married
- 2.5%Separated
- 0.2%Widowed
- 8.2%Divorced
- Females
- 22.6%Never married
- 59.6%Now married
- 0.2%Separated
- 3.3%Widowed
- 14.5%Divorced
Women who gave birth in the past 12 months
| Now married: | 100.0% (52) |
| Unmarried: | 0.0% (0) |
Women who did not give birth in the past 12 months
| Now married: | 51.4% (695) |
| Unmarried: | 48.6% (657) |
Marital status - Asian population 15 years and over
- Males
- 41.2%Never married
- 58.8%Now married
- 0.0%Separated
- 0.0%Widowed
- 0.0%Divorced
- Females
- 49.2%Never married
- 38.5%Now married
- 0.0%Separated
- 0.0%Widowed
- 12.3%Divorced
Women who did not give birth in the past 12 months
| Now married: | 17.9% (8) |
| Unmarried: | 82.1% (36) |
Marital status - Other race population 15 years and over
- Males
- 0.0%Never married
- 100.0%Now married
- 0.0%Separated
- 0.0%Widowed
- 0.0%Divorced
- Females
- 51.0%Never married
- 49.0%Now married
- 0.0%Separated
- 0.0%Widowed
- 0.0%Divorced
Women who did not give birth in the past 12 months
| Now married: | 45.8% (25) |
| Unmarried: | 54.2% (30) |
Marital status - Two or more races population 15 years and over
- Males
- 61.0%Never married
- 26.8%Now married
- 0.0%Separated
- 0.0%Widowed
- 12.2%Divorced
- Females
- 78.9%Never married
- 8.6%Now married
- 0.0%Separated
- 5.1%Widowed
- 7.4%Divorced
Women who did not give birth in the past 12 months
| Now married: | 5.2% (15) |
| Unmarried: | 94.8% (268) |
Marital status - White alone, not Hispanic / Latino population 15 years and over
- Males
- 31.5%Never married
- 58.8%Now married
- 1.0%Separated
- 0.2%Widowed
- 8.4%Divorced
- Females
- 22.0%Never married
- 60.5%Now married
- 0.0%Separated
- 3.0%Widowed
- 14.5%Divorced
Women who gave birth in the past 12 months
| Now married: | 100.0% (53) |
| Unmarried: | 0.0% (0) |
Women who did not give birth in the past 12 months
| Now married: | 51.4% (684) |
| Unmarried: | 48.6% (648) |
Marital status - Hispanic or Latino population 15 years and over
- Males
- 29.4%Never married
- 41.3%Now married
- 24.4%Separated
- 0.0%Widowed
- 5.0%Divorced
- Females
- 57.6%Never married
- 22.4%Now married
- 2.0%Separated
- 4.8%Widowed
- 13.2%Divorced
Women who did not give birth in the past 12 months
| Now married: | 26.7% (50) |
| Unmarried: | 73.3% (136) |
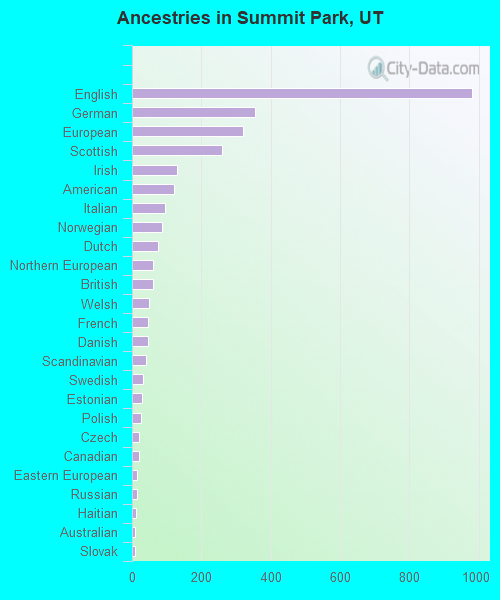
Ancestries in Summit Park

- 98127.3%English
- 3559.9%German
- 3198.9%European
- 2597.2%Scottish
- 1293.6%Irish
- 1213.4%American
- 962.7%Italian
- 882.4%Norwegian
- 752.1%Dutch
- 611.7%Northern European
- 601.7%British
- 491.4%Welsh
- 471.3%French
- 451.3%Danish
- 411.1%Scandinavian
- 310.9%Swedish
- 290.8%Estonian
- 270.8%Polish
- 210.6%Czech
- 190.5%Canadian
- 140.4%Eastern European
- 130.4%Russian
- 110.3%Haitian
- 90.3%Australian
- 90.3%Slovak
- 80.2%Greek
- 80.2%Lithuanian
- 30.08%Bulgarian
- 30.08%Hungarian
- 10.03%French Canadian
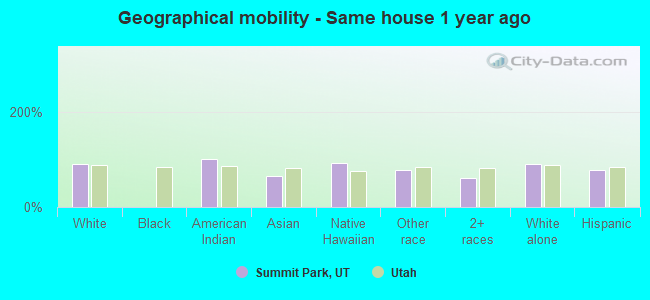
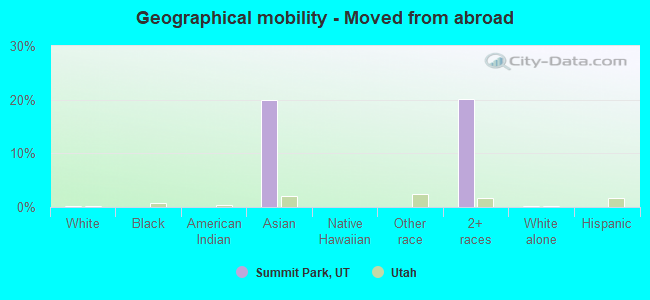
Geographical mobility in Summit Park

- Same house 1 year ago
- 7,13891.5%White (Caucasian)
- 17100.0%American Indian / Alaska Native
- 9866.5%Asian
- 4992.6%Native Hawaiian / Pacific Islander
- 22278.4%Other race
- 30360.3%Two or more races
- 7,04891.3%White alone, not Hispanic / Latino
- 51676.9%Hispanic or Latino
-
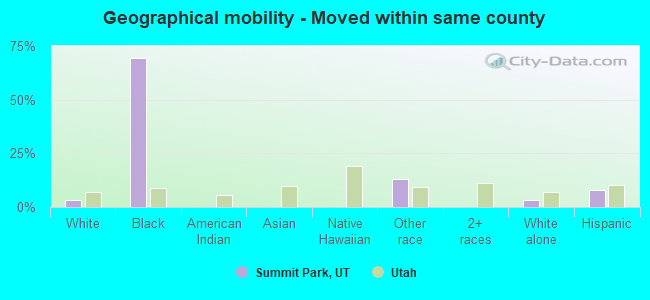
- Moved within same county
- 2633.4%White / Caucasian
- 369.5%Black or African American
- 3713.2%Other race
- 2583.3%White alone, not Hispanic / Latino
- 527.8%Hispanic or Latino
-
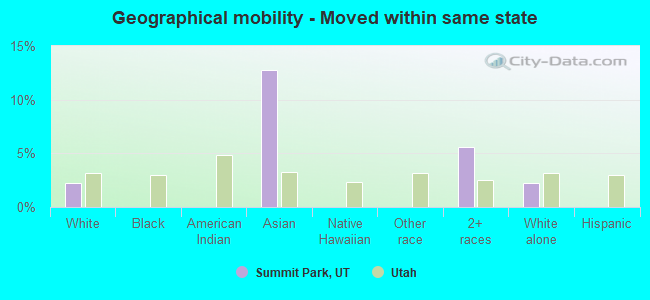
- Moved within same state
- 1752.2%White / Caucasian
- 1912.8%Asian
- 285.6%Two or more races
- 1762.3%White alone, not Hispanic / Latino
-
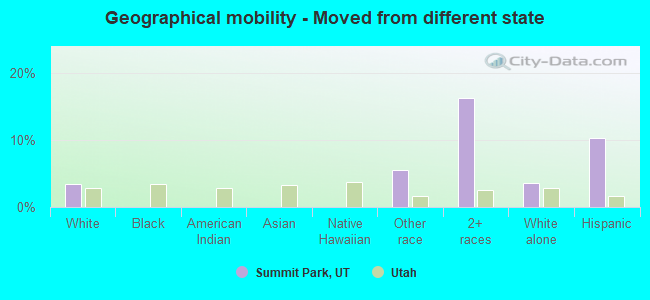
- Moved from different state
- 2633.4%White / Caucasian
- 165.5%Other race
- 8116.2%Two or more races
- 2713.5%White alone, not Hispanic / Latino
- 6910.3%Hispanic or Latino
-
- Moved from abroad
- 90.1%White
- 3020.0%Asian
- 10120.1%Two or more races
- 100.1%White alone, not Hispanic / Latino
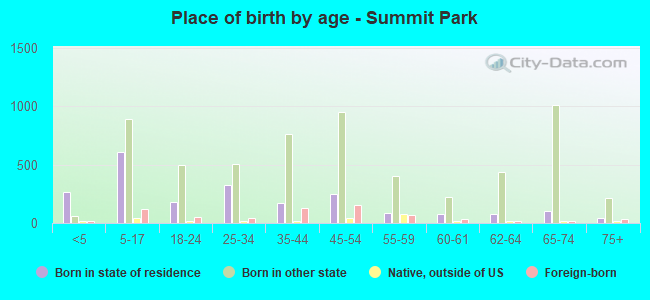
Children Nativity (place of birth) in Summit Park
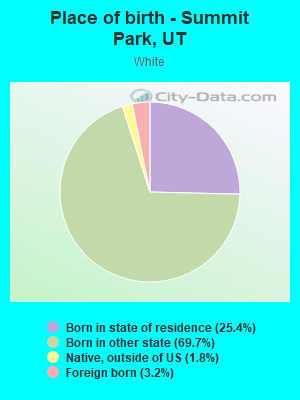
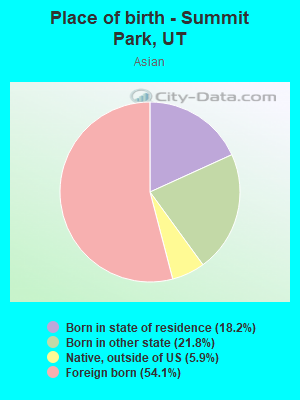
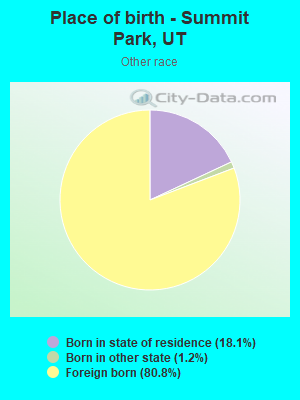
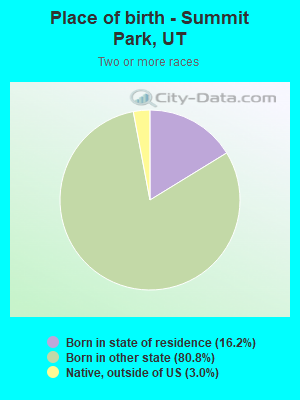
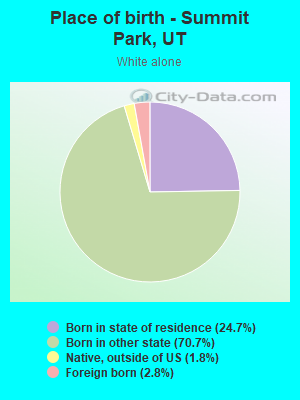
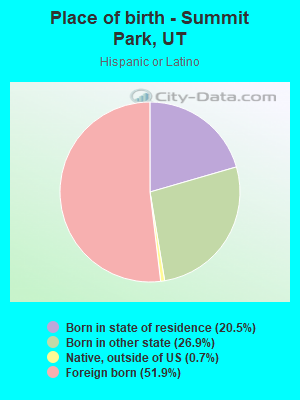
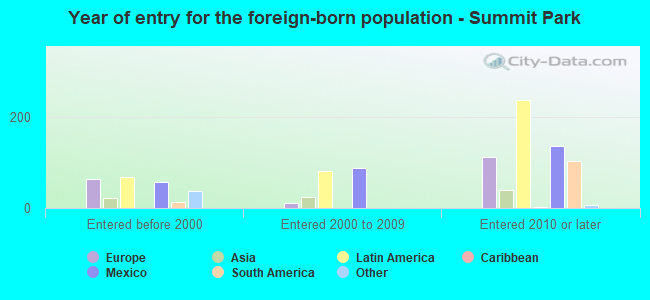
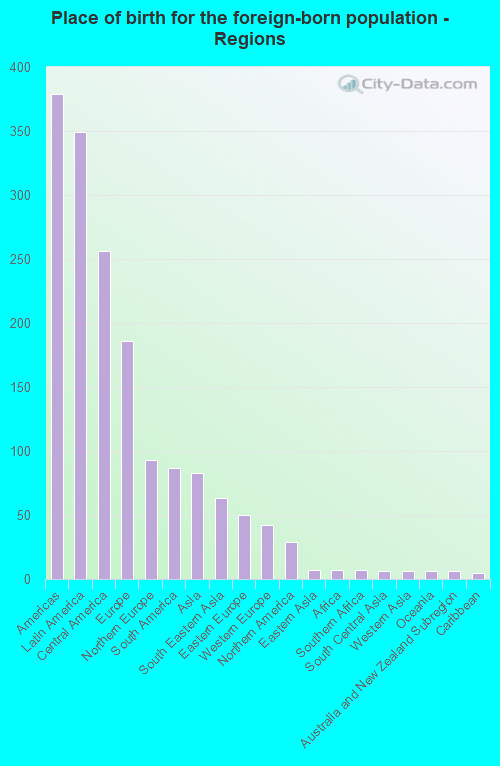
Place of birth for residents in Summit Park
![Place of birth for the foreign-born population - Regions]()
- 379Americas
- 349Latin America
- 256Central America
- 186Europe
- 93Northern Europe
- 87South America
- 83Asia
- 63South Eastern Asia
- 50Eastern Europe
- 42Western Europe
- 29Northern America
- 7Eastern Asia
- 7Africa
- 7Southern Africa
- 6South Central Asia
- 6Western Asia
- 6Oceania
- 6Australia and New Zealand Subregion
- 5Caribbean
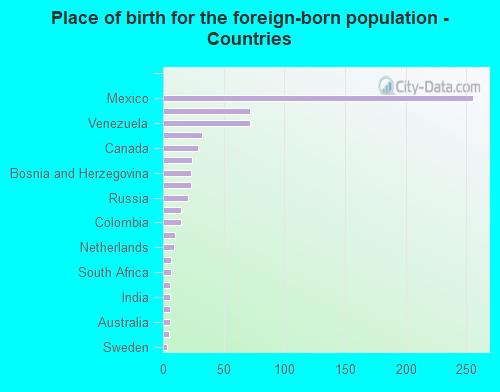
![Place of birth for the foreign-born population - Countries]()
- 256Mexico
- 72United Kingdom
- 72Venezuela
- 32Germany
- 29Canada
- 24Philippines
- 23Bosnia and Herzegovina
- 23Thailand
- 21Russia
- 15Laos
- 15Colombia
- 10England
- 9Netherlands
- 7Japan
- 7South Africa
- 6Bulgaria
- 6India
- 6United Arab Emirates
- 6Australia
- 5Haiti
- 3Sweden
Zip codes: 84098.