Races in Summit View, Washington (WA) Detailed Stats
Data:
Races - White alone (%)
Races - White alone (% change since 2000)
Races - Black alone (%)
Races - Black alone (% change since 2000)
Races - American Indian alone (%)
Races - American Indian alone (% change since 2000)
Races - Asian alone (%)
Races - Asian alone (% change since 2000)
Races - Hispanic (%)
Races - Hispanic (% change since 2000)
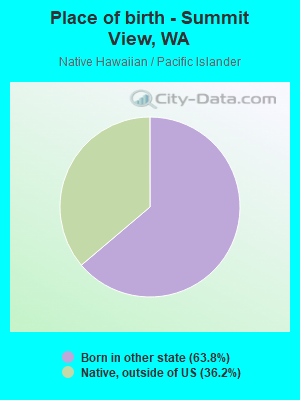
Races - Native Hawaiian and Other Pacific Islander alone (%)
Races - Native Hawaiian and Other Pacific Islander alone (% change since 2000)
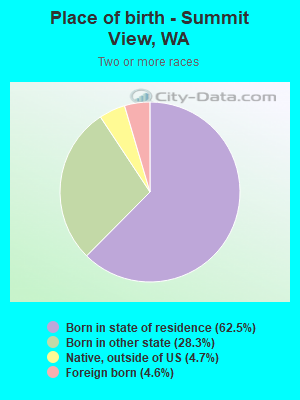
Races - Two or more races(%)
Races - Two or more races(% change since 2000)
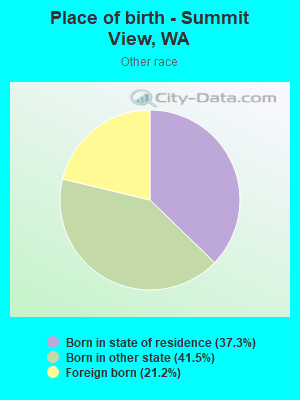
Races - Other race alone (%)
Races - Other race alone (% change since 2000)
Racial diversity
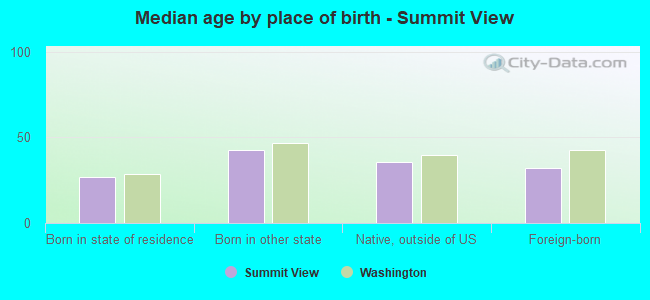
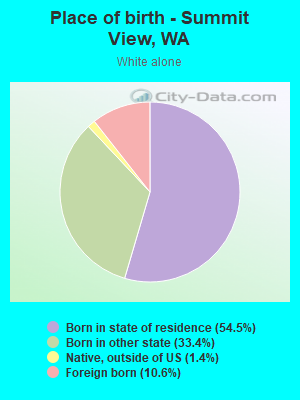
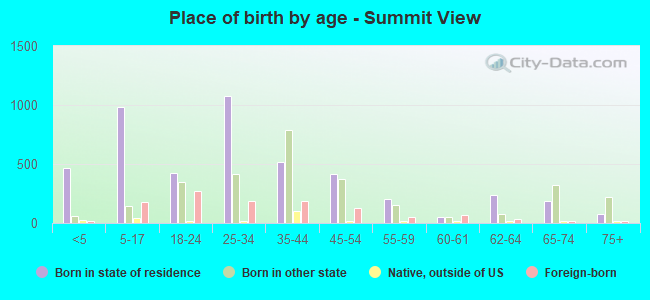
Place of birth - Born in state of residence (%)
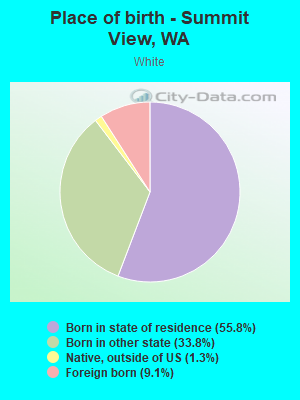
Place of birth - Born in state of residence (%) - White
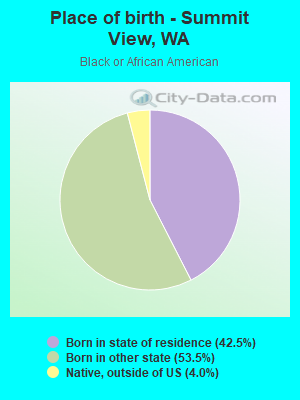
Place of birth - Born in state of residence (%) - Black or African American
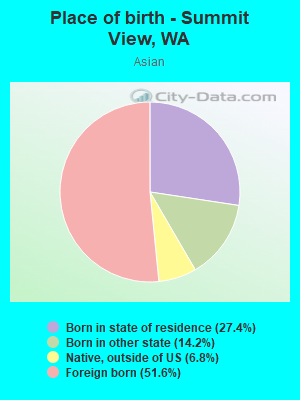
Place of birth - Born in state of residence (%) - Asian
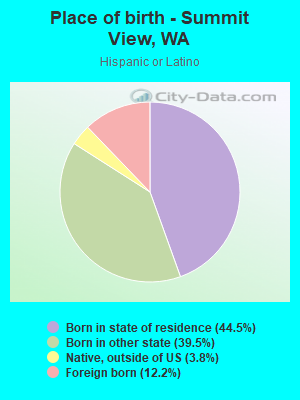
Place of birth - Born in state of residence (%) - Hispanic or Latino
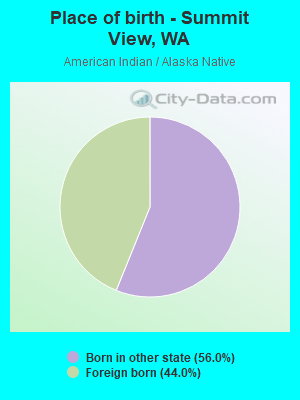
Place of birth - Born in state of residence (%) - American Indian and Alaska Native
Place of birth - Born in state of residence (%) - Multirace
Place of birth - Born in state of residence (%) - Other Race
Place of birth - Born in other state (%)
Place of birth - Born in other state (%) - White
Place of birth - Born in other state (%) - Black or African American
Place of birth - Born in other state (%) - Asian
Place of birth - Born in other state (%) - Hispanic or Latino
Place of birth - Born in other state (%) - American Indian and Alaska Native
Place of birth - Born in other state (%) - Multirace
Place of birth - Born in other state (%) - Other Race
Place of birth - Native, outside of US (%)
Place of birth - Native, outside of US (%) - White
Place of birth - Native, outside of US (%) - Black or African American
Place of birth - Native, outside of US (%) - Asian
Place of birth - Native, outside of US (%) - Hispanic or Latino
Place of birth - Native, outside of US (%) - American Indian and Alaska Native
Place of birth - Native, outside of US (%) - Multirace
Place of birth - Native, outside of US (%) - Other Race
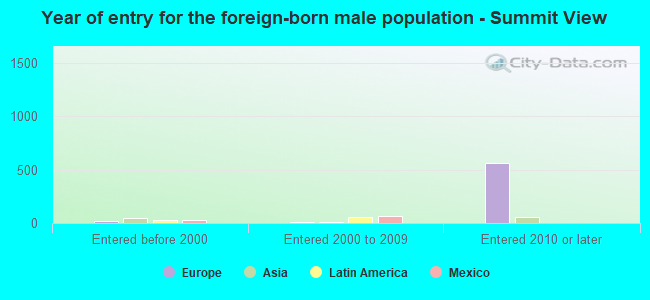
Place of birth - Foreign born (%)
Place of birth - Foreign born (%) - White
Place of birth - Foreign born (%) - Black or African American
Place of birth - Foreign born (%) - Asian
Place of birth - Foreign born (%) - Hispanic or Latino
Place of birth - Foreign born (%) - American Indian and Alaska Native
Place of birth - Foreign born (%) - Multirace
Place of birth - Foreign born (%) - Other Race
Residents speaking English at home (%)
Residents speaking English at home - Born in the United States (%)
Residents speaking English at home - Native, born elsewhere (%)
Residents speaking English at home - Foreign born (%)
Residents speaking Spanish at home (%)
Residents speaking Spanish at home - Born in the United States (%)
Residents speaking Spanish at home - Native, born elsewhere (%)
Residents speaking Spanish at home - Foreign born (%)
Residents speaking other language at home (%)
Residents speaking other language at home - Born in the United States (%)
Residents speaking other language at home - Native, born elsewhere (%)
Residents speaking other language at home - Foreign born (%)
Marital status - Never married (%)
Marital status - Now married (%)
Marital status - Separated (%)
Marital status - Widowed (%)
Marital status - Divorced (%)
Ancestries Reported - Arab (%)
Ancestries Reported - Czech (%)
Ancestries Reported - Danish (%)
Ancestries Reported - Dutch (%)
Ancestries Reported - English (%)
Ancestries Reported - French (%)
Ancestries Reported - French Canadian (%)
Ancestries Reported - German (%)
Ancestries Reported - Greek (%)
Ancestries Reported - Hungarian (%)
Ancestries Reported - Irish (%)
Ancestries Reported - Italian (%)
Ancestries Reported - Lithuanian (%)
Ancestries Reported - Norwegian (%)
Ancestries Reported - Polish (%)
Ancestries Reported - Portuguese (%)
Ancestries Reported - Russian (%)
Ancestries Reported - Scotch-Irish (%)
Ancestries Reported - Scottish (%)
Ancestries Reported - Slovak (%)
Ancestries Reported - Subsaharan African (%)
Ancestries Reported - Swedish (%)
Ancestries Reported - Swiss (%)
Ancestries Reported - Ukrainian (%)
Ancestries Reported - United States (%)
Ancestries Reported - Welsh (%)
Ancestries Reported - West Indian (%)
Ancestries Reported - Other (%)
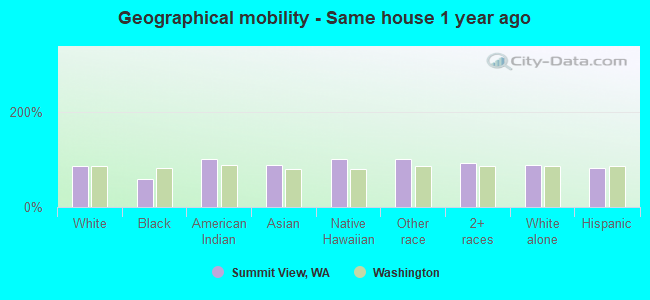
Geographical mobility - Same house 1 year ago (%)
Geographical mobility - Same house 1 year ago (%) - White
Geographical mobility - Same house 1 year ago (%) - Black or African American
Geographical mobility - Same house 1 year ago (%) - Asian
Geographical mobility - Same house 1 year ago (%) - Hispanic or Latino
Geographical mobility - Same house 1 year ago (%) - American Indian and Alaska Native
Geographical mobility - Same house 1 year ago (%) - Multirace
Geographical mobility - Same house 1 year ago (%) - Other Race
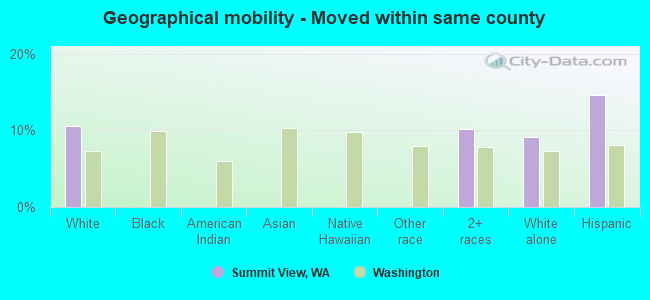
Geographical mobility - Moved within same county (%)
Geographical mobility - Moved within same county (%) - White
Geographical mobility - Moved within same county (%) - Black or African American
Geographical mobility - Moved within same county (%) - Asian
Geographical mobility - Moved within same county (%) - Hispanic or Latino
Geographical mobility - Moved within same county (%) - American Indian and Alaska Native
Geographical mobility - Moved within same county (%) - Multirace
Geographical mobility - Moved within same county (%) - Other Race
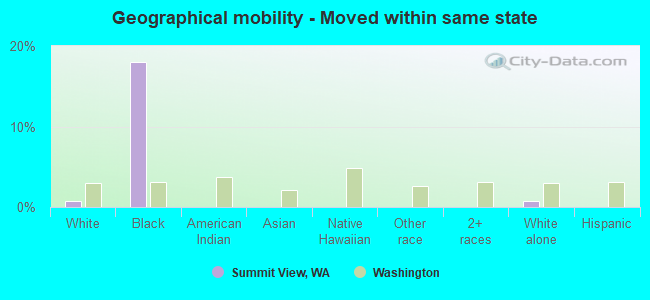
Geographical mobility - Moved from different county within same state (%)
Geographical mobility - Moved from different county within same state (%) - White
Geographical mobility - Moved from different county within same state (%) - Black or African American
Geographical mobility - Moved from different county within same state (%) - Asian
Geographical mobility - Moved from different county within same state (%) - Hispanic or Latino
Geographical mobility - Moved from different county within same state (%) - American Indian and Alaska Native
Geographical mobility - Moved from different county within same state (%) - Multirace
Geographical mobility - Moved from different county within same state (%) - Other Race
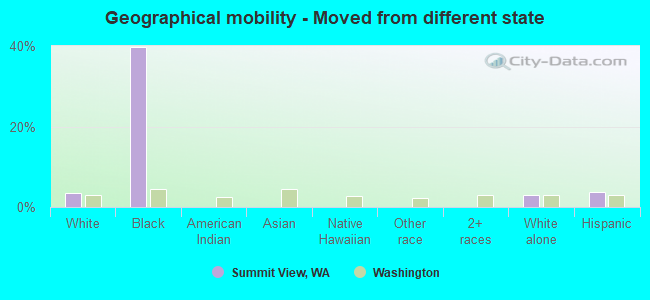
Geographical mobility - Moved from different state (%)
Geographical mobility - Moved from different state (%) - White
Geographical mobility - Moved from different state (%) - Black or African American
Geographical mobility - Moved from different state (%) - Asian
Geographical mobility - Moved from different state (%) - Hispanic or Latino
Geographical mobility - Moved from different state (%) - American Indian and Alaska Native
Geographical mobility - Moved from different state (%) - Multirace
Geographical mobility - Moved from different state (%) - Other Race
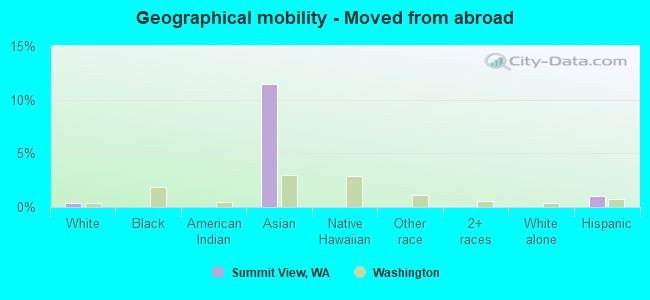
Geographical mobility - Moved from abroad (%)
Geographical mobility - Moved from abroad (%) - White
Geographical mobility - Moved from abroad (%) - Black or African American
Geographical mobility - Moved from abroad (%) - Asian
Geographical mobility - Moved from abroad (%) - Hispanic or Latino
Geographical mobility - Moved from abroad (%) - American Indian and Alaska Native
Geographical mobility - Moved from abroad (%) - Multirace
Geographical mobility - Moved from abroad (%) - Other Race
Place of birth for the foreign-born population - Ireland (%)
Place of birth for the foreign-born population - Denmark (%)
Place of birth for the foreign-born population - Norway (%)
Place of birth for the foreign-born population - Sweden (%)
Place of birth for the foreign-born population - United Kingdom (%)
Place of birth for the foreign-born population - England (%)
Place of birth for the foreign-born population - Scotland (%)
Place of birth for the foreign-born population - Other Northern Europe (%)
Place of birth for the foreign-born population - Austria (%)
Place of birth for the foreign-born population - Belgium (%)
Place of birth for the foreign-born population - France (%)
Place of birth for the foreign-born population - Germany (%)
Place of birth for the foreign-born population - Netherlands (%)
Place of birth for the foreign-born population - Switzerland (%)
Place of birth for the foreign-born population - Other Western Europe (%)
Place of birth for the foreign-born population - Greece (%)
Place of birth for the foreign-born population - Italy (%)
Place of birth for the foreign-born population - Portugal (%)
Place of birth for the foreign-born population - Spain (%)
Place of birth for the foreign-born population - Other Southern Europe (%)
Place of birth for the foreign-born population - Albania (%)
Place of birth for the foreign-born population - Belarus (%)
Place of birth for the foreign-born population - Bosnia and Herzegovina (%)
Place of birth for the foreign-born population - Bulgaria (%)
Place of birth for the foreign-born population - Croatia (%)
Place of birth for the foreign-born population - Czechoslovakia (%)
Place of birth for the foreign-born population - Hungary (%)
Place of birth for the foreign-born population - Latvia (%)
Place of birth for the foreign-born population - Lithuania (%)
Place of birth for the foreign-born population - North Macedonia (Macedonia) (%)
Place of birth for the foreign-born population - Moldova (%)
Place of birth for the foreign-born population - Poland (%)
Place of birth for the foreign-born population - Romania (%)
Place of birth for the foreign-born population - Russia (%)
Place of birth for the foreign-born population - Serbia (%)
Place of birth for the foreign-born population - Ukraine (%)
Place of birth for the foreign-born population - Other Eastern Europe (%)
Place of birth for the foreign-born population - China (%)
Place of birth for the foreign-born population - Hong Kong (%)
Place of birth for the foreign-born population - Taiwan (%)
Place of birth for the foreign-born population - Japan (%)
Place of birth for the foreign-born population - Korea (%)
Place of birth for the foreign-born population - Other Eastern Asia (%)
Place of birth for the foreign-born population - Afghanistan (%)
Place of birth for the foreign-born population - Bangladesh (%)
Place of birth for the foreign-born population - India (%)
Place of birth for the foreign-born population - Iran (%)
Place of birth for the foreign-born population - Kazakhstan (%)
Place of birth for the foreign-born population - Nepal (%)
Place of birth for the foreign-born population - Pakistan (%)
Place of birth for the foreign-born population - Sri Lanka (%)
Place of birth for the foreign-born population - Uzbekistan (%)
Place of birth for the foreign-born population - Other South Central Asia (%)
Place of birth for the foreign-born population - Burma (%)
Place of birth for the foreign-born population - Cambodia (%)
Place of birth for the foreign-born population - Indonesia (%)
Place of birth for the foreign-born population - Laos (%)
Place of birth for the foreign-born population - Malaysia (%)
Place of birth for the foreign-born population - Philippines (%)
Place of birth for the foreign-born population - Singapore (%)
Place of birth for the foreign-born population - Thailand (%)
Place of birth for the foreign-born population - Vietnam (%)
Place of birth for the foreign-born population - Other South Eastern Asia (%)
Place of birth for the foreign-born population - Armenia (%)
Place of birth for the foreign-born population - Iraq (%)
Place of birth for the foreign-born population - Israel (%)
Place of birth for the foreign-born population - Jordan (%)
Place of birth for the foreign-born population - Kuwait (%)
Place of birth for the foreign-born population - Lebanon (%)
Place of birth for the foreign-born population - Saudi Arabia (%)
Place of birth for the foreign-born population - Syria (%)
Place of birth for the foreign-born population - Turkey (%)
Place of birth for the foreign-born population - Yemen (%)
Place of birth for the foreign-born population - Other Western Asia (%)
Place of birth for the foreign-born population - Eritrea (%)
Place of birth for the foreign-born population - Ethiopia (%)
Place of birth for the foreign-born population - Kenya (%)
Place of birth for the foreign-born population - Somalia (%)
Place of birth for the foreign-born population - Uganda (%)
Place of birth for the foreign-born population - Zimbabwe (%)
Place of birth for the foreign-born population - Other Eastern Africa (%)
Place of birth for the foreign-born population - Cameroon (%)
Place of birth for the foreign-born population - Congo (%)
Place of birth for the foreign-born population - Democratic Republic of Congo (Zaire) (%)
Place of birth for the foreign-born population - Other Middle Africa (%)
Place of birth for the foreign-born population - Egypt (%)
Place of birth for the foreign-born population - Morocco (%)
Place of birth for the foreign-born population - Sudan (%)
Place of birth for the foreign-born population - Other Northern Africa (%)
Place of birth for the foreign-born population - South Africa (%)
Place of birth for the foreign-born population - Other Southern Africa (%)
Place of birth for the foreign-born population - Cabo Verde (%)
Place of birth for the foreign-born population - Ghana (%)
Place of birth for the foreign-born population - Liberia (%)
Place of birth for the foreign-born population - Nigeria (%)
Place of birth for the foreign-born population - Senegal (%)
Place of birth for the foreign-born population - Sierra Leone (%)
Place of birth for the foreign-born population - Other Western Africa (%)
Place of birth for the foreign-born population - Australia (%)
Place of birth for the foreign-born population - New Zealand (%)
Place of birth for the foreign-born population - Fiji (%)
Place of birth for the foreign-born population - Micronesia (%)
Place of birth for the foreign-born population - Bahamas (%)
Place of birth for the foreign-born population - Barbados (%)
Place of birth for the foreign-born population - Cuba (%)
Place of birth for the foreign-born population - Dominica (%)
Place of birth for the foreign-born population - Dominican Republic (%)
Place of birth for the foreign-born population - Grenada (%)
Place of birth for the foreign-born population - Haiti (%)
Place of birth for the foreign-born population - Jamaica (%)
Place of birth for the foreign-born population - St. Vincent and the Grenadines (%)
Place of birth for the foreign-born population - Trinidad and Tobago (%)
Place of birth for the foreign-born population - West Indies (%)
Place of birth for the foreign-born population - Other Caribbean (%)
Place of birth for the foreign-born population - Belize (%)
Place of birth for the foreign-born population - Costa Rica (%)
Place of birth for the foreign-born population - El Salvador (%)
Place of birth for the foreign-born population - Guatemala (%)
Place of birth for the foreign-born population - Honduras (%)
Place of birth for the foreign-born population - Mexico (%)
Place of birth for the foreign-born population - Nicaragua (%)
Place of birth for the foreign-born population - Panama (%)
Place of birth for the foreign-born population - Other Central America (%)
Place of birth for the foreign-born population - Argentina (%)
Place of birth for the foreign-born population - Bolivia (%)
Place of birth for the foreign-born population - Brazil (%)
Place of birth for the foreign-born population - Chile (%)
Place of birth for the foreign-born population - Colombia (%)
Place of birth for the foreign-born population - Ecuador (%)
Place of birth for the foreign-born population - Guyana (%)
Place of birth for the foreign-born population - Peru (%)
Place of birth for the foreign-born population - Uruguay (%)
Place of birth for the foreign-born population - Venezuela (%)
Place of birth for the foreign-born population - Other South America (%)
Place of birth for the foreign-born population - Canada (%)
Place of birth for the foreign-born population - Other Northern America (%)
Place of birth for the foreign-born population - Other (%)
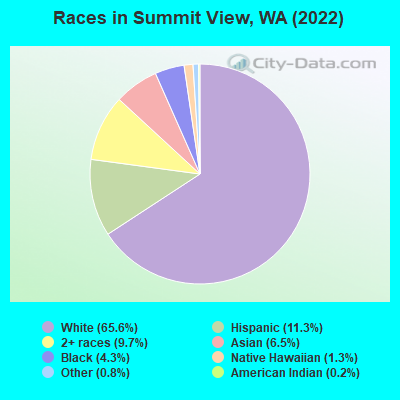
According to 2022 data, the most numerous races in Summit View, WA are White alone (5,793 residents), Hispanic (997 residents), and Asian alone (571 residents). 83.2% of Summit View residents speak English at home.
Race distribution in Summit View 5,793 65.6% White alone 997 11.3% Hispanic 858 9.7% Two or more races 571 6.5% Asian alone 379 4.3% Black alone 118 1.3% Native Hawaiian and Other 75 0.8% Other race alone 20 0.2% American Indian alone
2000 2022
4,652,490 78.9% White alone 441,509 7.5% Hispanic 319,401 5.4% Asian alone 184,631 3.1% Black alone 175,926 3.0% Two or more races 85,396 1.4% American Indian alone 22,779 0.4% Native Hawaiian and Other 11,989 0.2% Other race alone
4,941,456 63.5% White alone 1,093,313 14.0% Hispanic 755,832 9.7% Asian alone 523,448 6.7% Two or more races 299,537 3.8% Black alone 69,024 0.9% American Indian alone 52,231 0.7% Native Hawaiian and Other 50,945 0.7% Other race alone
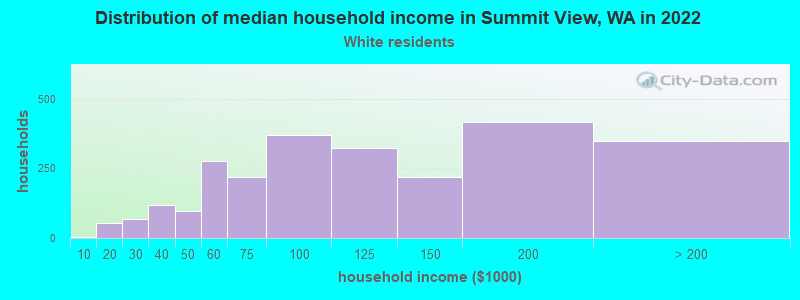
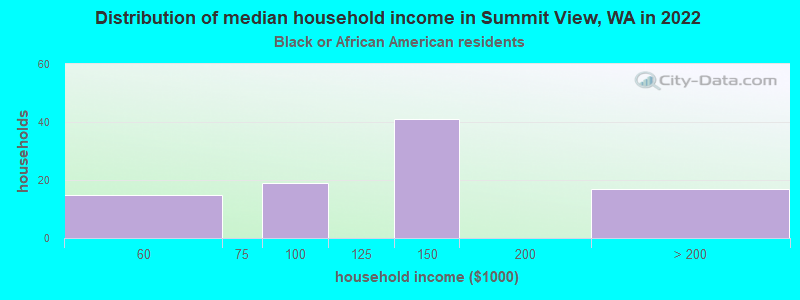
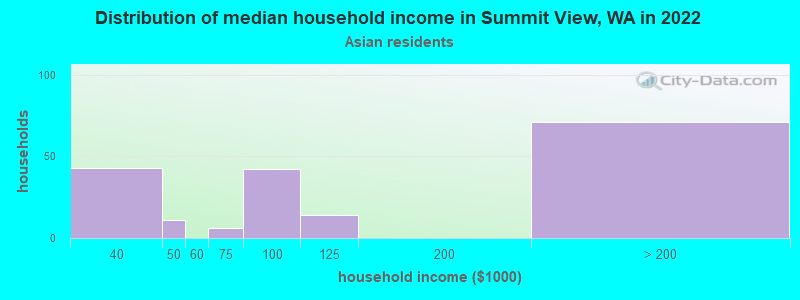
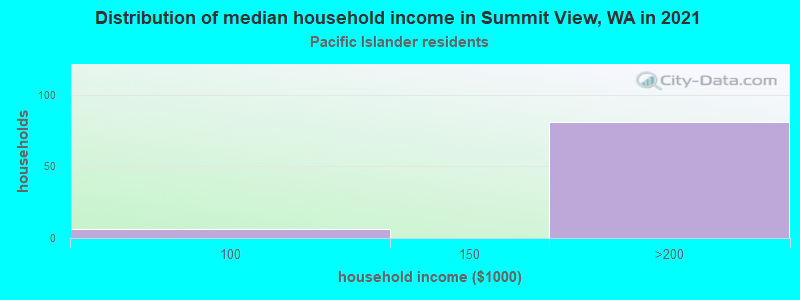
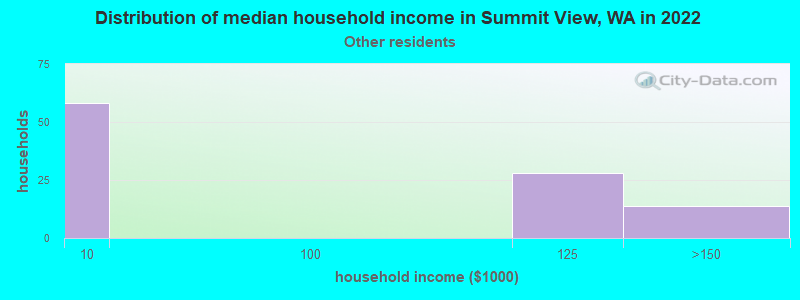
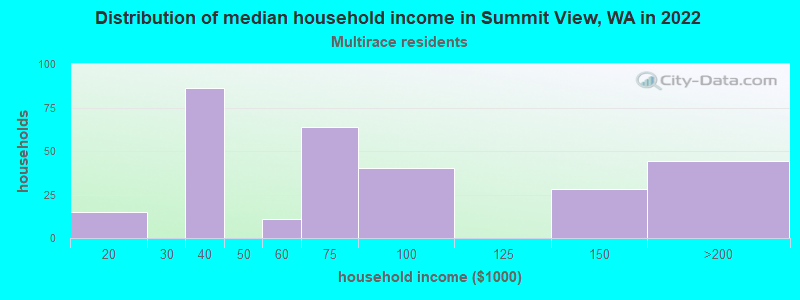
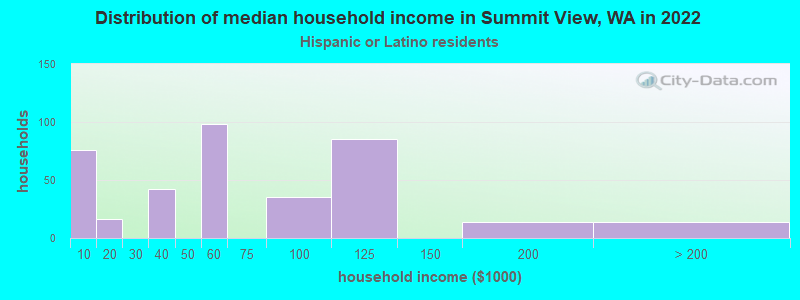
Income and house value in Summit View Median household income in 2022 $106,401 White non-Hispanic householders$146,658 Black householders$99,372 Asian householders$78,006 Two or more races householders$61,210 Hispanic or Latino race householders
Median age by race in Summit View
36.1 Median age for White residents34.1 39.5 37.9 Median age for Black or African American residents37.8 33.9 31.0 Median age for American Indian / Alaska Native residents-622,057,000.6 -519,527,701.6 30.9 Median age for Asian residents33.4 29.4 37.6 Median age for Native Hawaiian / Pacific Islander residents-736,612,021.1 34.5 40.5 Median age for Other race residents42.9 3.2 16.2 Median age for Two or more races residents20.1 16.0 36.2 Median age for White alone residents31.1 40.2 24.0 Median age for Hispanic or Latino residents38.0 14.2
Owner/renter occupied households by race in Summit View
House owners and renters - White residents 1,452 57.4% Owner occupied1,080 42.6% Renter occupiedHouse owners and renters - Black or African American residents 32 34.8% Owner occupied60 65.2% Renter occupiedHouse owners and renters - Asian residents 115 62.9% Owner occupied68 37.1% Renter occupiedHouse owners and renters - Native Hawaiian / Pacific Islander residents 46 100.0% Owner occupiedHouse owners and renters - Other race residents 45 38.4% Owner occupied73 61.6% Renter occupiedHouse owners and renters - Two or more races residents 199 67.8% Owner occupied95 32.2% Renter occupiedHouse owners and renters - White alone residents 1,409 58.8% Owner occupied987 41.2% Renter occupiedHouse owners and renters - Hispanic or Latino residents 151 42.6% Owner occupied203 57.4% Renter occupied
Language usage in Summit View
English speakers - Total 83.2% of residents of Summit View speak English at home.
2.5% of residents speak Spanish at home 176 84.2% Speak English very well33 15.8% Speak English less than very well15.1% of residents speak other language at home 402 32.2% Speak English very well846 67.8% Speak English less than very well
English speakers - Born in the United States 93.2% of residents of Summit View speak English at home.
4.2% of residents speak Spanish at home 97 82.2% Speak English very well21 17.8% Speak English less than very well2.5% of residents speak other language at home 70 100.0% Speak English very well
English speakers - Native, born elsewhere 89.7% of residents of Summit View speak English at home.
3.4% of residents speak Spanish at home 7 100.0% Speak English very well9.3% of residents speak other language at home 8 42.1% Speak English very well11 57.9% Speak English less than very well
English speakers - Foreign-born 14.4% of residents of Summit View speak English at home.
4.1% of residents speak Spanish at home 27 62.8% Speak English very well16 37.2% Speak English less than very well84.6% of residents speak other language at home 126 14.1% Speak English very well770 85.9% Speak English less than very well
White (Caucasian) - Speak only English Native:
94.9% (4,944)Foreign-born:
4.0% (22)
White (Caucasian) - Speak another language Native:
4.3% (224)Foreign-born:
100.0% (541)
Asian - Speak only English Native:
58.9% (153)Foreign-born:
18.6% (57)
Asian - Speak another language Native:
40.3% (105)Foreign-born:
80.8% (246)
Other race - Speak only English Native:
91.1% (190)Foreign-born:
64.6% (44)
Other race - Speak another language Native:
10.6% (22)Foreign-born:
40.7% (28)
Two or more races - Speak only English Native:
95.3% (1,010)Foreign-born:
59.5% (37)
White alone - Speak only English Native:
96.6% (4,821)Foreign-born:
2.3% (14)
White alone - Speak another language Native:
3.2% (158)Foreign-born:
100.0% (617)
Hispanic or Latino - Speak only English Native:
74.5% (525)Foreign-born:
45.0% (55)
Hispanic or Latino - Speak another language Native:
26.6% (188)Foreign-born:
46.0% (56)
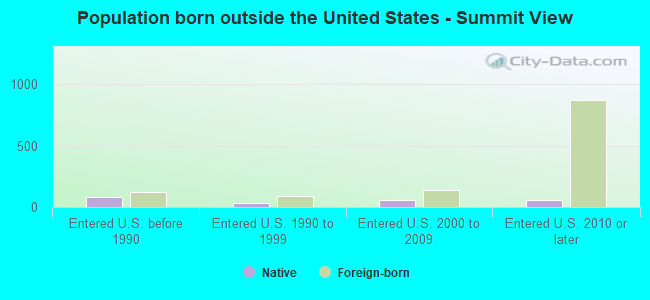
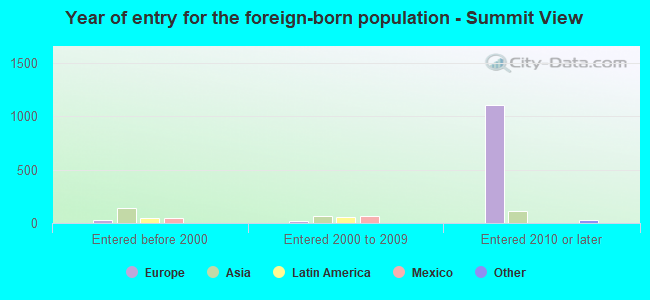
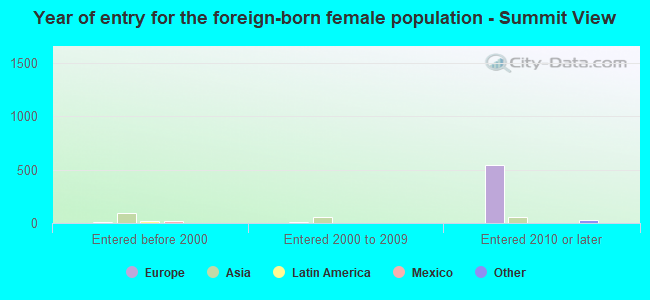
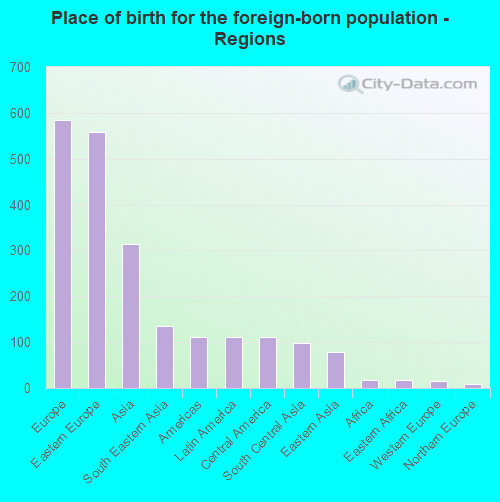
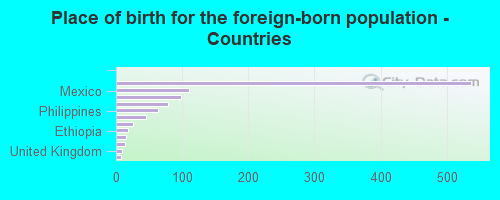
Foreign-born residents in Summit View
Marital status for residents in Summit View Marital status - White (Caucasian) population 15 years and over
Males 43.1% Never married50.4% Now married0.0% Separated0.0% Widowed6.5% DivorcedFemales 30.4% Never married40.1% Now married0.2% Separated8.0% Widowed21.2% DivorcedWomen who gave birth in the past 12 months Now married:
40.0% (26)Unmarried:
60.0% (39)
Women who did not give birth in the past 12 months Now married:
38.4% (706)Unmarried:
61.6% (1,133)
Marital status - Black or African American population 15 years and over
Males 47.8% Never married43.3% Now married0.0% Separated0.0% Widowed8.9% DivorcedFemales 18.6% Never married59.3% Now married0.0% Separated10.2% Widowed11.9% DivorcedWomen who gave birth in the past 12 months Now married:
100.0% (16)Unmarried:
0.0% (0)
Women who did not give birth in the past 12 months Now married:
62.7% (36)Unmarried:
37.3% (22)
Marital status - American Indian / Alaska Native population 15 years and over
Males 52.4% Never married47.6% Now married0.0% Separated0.0% Widowed0.0% DivorcedFemales 100.0% Never married0.0% Now married0.0% Separated0.0% Widowed0.0% DivorcedWomen who did not give birth in the past 12 months Now married:
0.0% (0)Unmarried:
100.0% (7)
Marital status - Asian population 15 years and over
Males 26.2% Never married64.1% Now married0.0% Separated0.0% Widowed9.7% DivorcedFemales 16.0% Never married73.4% Now married0.0% Separated0.0% Widowed10.5% DivorcedWomen who gave birth in the past 12 months Now married:
100.0% (46)Unmarried:
0.0% (0)
Women who did not give birth in the past 12 months Now married:
72.5% (104)Unmarried:
27.5% (40)
Marital status - Native Hawaiian / Pacific Islander population 15 years and over
Males 0.0% Never married100.0% Now married0.0% Separated0.0% Widowed0.0% DivorcedFemales 39.7% Never married60.3% Now married0.0% Separated0.0% Widowed0.0% DivorcedWomen who did not give birth in the past 12 months Now married:
60.3% (46)Unmarried:
39.7% (30)
Marital status - Other race population 15 years and over
Males 31.1% Never married68.9% Now married0.0% Separated0.0% Widowed0.0% DivorcedFemales 0.0% Never married51.3% Now married0.0% Separated0.0% Widowed48.7% DivorcedWomen who did not give birth in the past 12 months Now married:
51.3% (22)Unmarried:
48.7% (21)
Marital status - Two or more races population 15 years and over
Males 36.8% Never married51.0% Now married0.0% Separated0.0% Widowed12.2% DivorcedFemales 37.5% Never married50.4% Now married6.7% Separated0.0% Widowed5.4% DivorcedWomen who did not give birth in the past 12 months Now married:
48.1% (117)Unmarried:
51.9% (126)
Marital status - White alone, not Hispanic / Latino population 15 years and over
Males 43.4% Never married49.7% Now married0.0% Separated0.0% Widowed6.8% DivorcedFemales 28.3% Never married40.9% Now married0.2% Separated8.4% Widowed22.2% DivorcedWomen who gave birth in the past 12 months Now married:
40.0% (27)Unmarried:
60.0% (41)
Women who did not give birth in the past 12 months Now married:
39.6% (700)Unmarried:
60.4% (1,067)
Marital status - Hispanic or Latino population 15 years and over
Males 36.1% Never married61.8% Now married0.0% Separated0.0% Widowed2.0% DivorcedFemales 61.1% Never married38.9% Now married0.0% Separated0.0% Widowed0.0% DivorcedWomen who did not give birth in the past 12 months Now married:
38.9% (88)Unmarried:
61.1% (137)
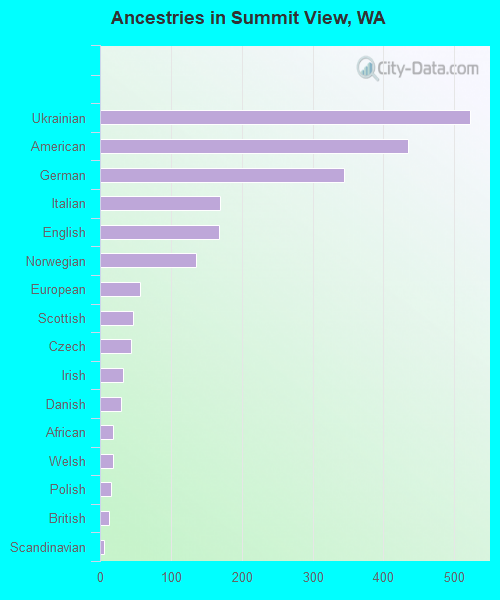
Ancestries in Summit View
523 15.8% Ukrainian435 13.2% American344 10.4% German170 5.1% Italian168 5.1% English135 4.1% Norwegian56 1.7% European47 1.4% Scottish44 1.3% Czech32 1.0% Irish29 0.9% Danish19 0.6% African19 0.6% Welsh16 0.5% Polish12 0.4% British6 0.2% Scandinavian
Children Nativity (place of birth) in Summit View
Children under 6 years - Living with two parents Both parents native 258 100.0% NativeBoth parents foreign-born 15 100.0% NativeOne native, one foreign-born parent 201 100.0% NativeChildren under 6 years - Living with one parent Native parent 94 100.0% NativeForeign-born parent 10 100.0% NativeChildren 6 to 17 years - Living with two parents Both parents native 718 100.0% NativeBoth parents foreign-born 63 24.4% Native196 75.6% Foreign-bornOne native, one foreign-born parent 32 100.0% NativeChildren 6 to 17 years - Living with one parent Native parent 232 100.0% NativeForeign-born parent 9 49.7% Native9 50.3% Foreign-born
Grandparents responsible for own grandchildren in Summit View
Grandparents (30 to 59 years) White / Caucasian 32 59.1% Responsible for grandchildren22 40.9% Not responsible for grandchildrenAsian 18 100.0% Not responsible for grandchildrenWhite alone, not Hispanic / Latino 28 55.2% Responsible for grandchildren23 44.8% Not responsible for grandchildren
Grandparents (60 years and over) White / Caucasian 23 100.0% Not responsible for grandchildrenAsian 13 100.0% Not responsible for grandchildrenWhite alone, not Hispanic / Latino 23 100.0% Not responsible for grandchildren