Races in Sun City Center, Florida (FL) Detailed Stats
Data:
Races - White alone (%)
Races - White alone (% change since 2000)
Races - Black alone (%)
Races - Black alone (% change since 2000)
Races - American Indian alone (%)
Races - American Indian alone (% change since 2000)
Races - Asian alone (%)
Races - Asian alone (% change since 2000)
Races - Hispanic (%)
Races - Hispanic (% change since 2000)
Races - Native Hawaiian and Other Pacific Islander alone (%)
Races - Native Hawaiian and Other Pacific Islander alone (% change since 2000)
Races - Two or more races(%)
Races - Two or more races(% change since 2000)
Races - Other race alone (%)
Races - Other race alone (% change since 2000)
Racial diversity
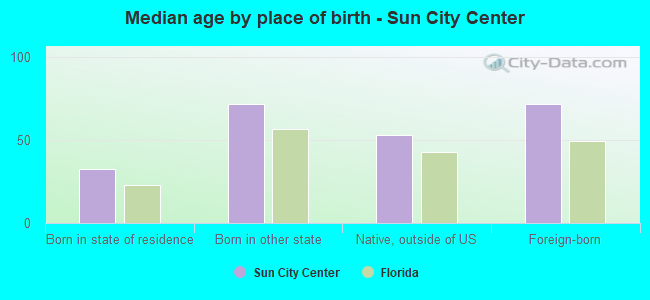
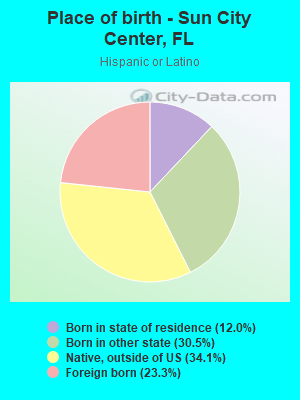
Place of birth - Born in state of residence (%)
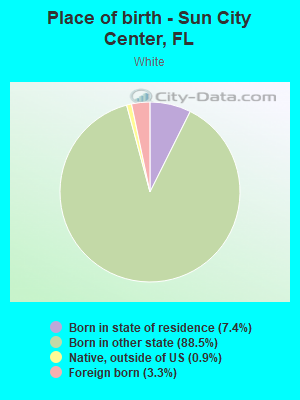
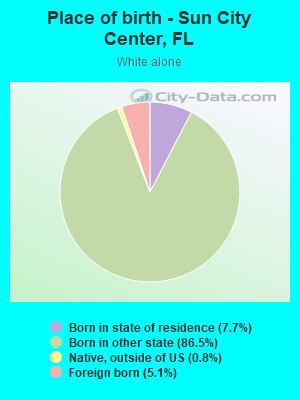
Place of birth - Born in state of residence (%) - White
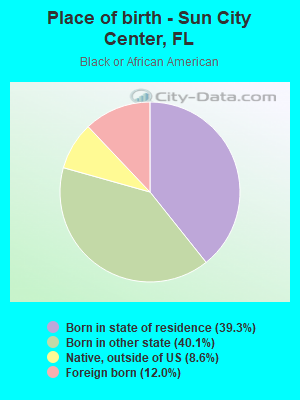
Place of birth - Born in state of residence (%) - Black or African American
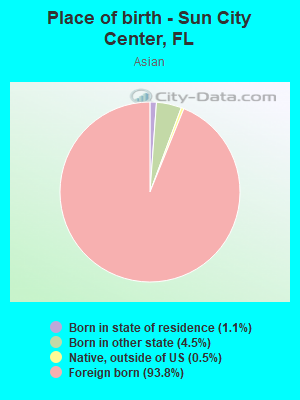
Place of birth - Born in state of residence (%) - Asian
Place of birth - Born in state of residence (%) - Hispanic or Latino
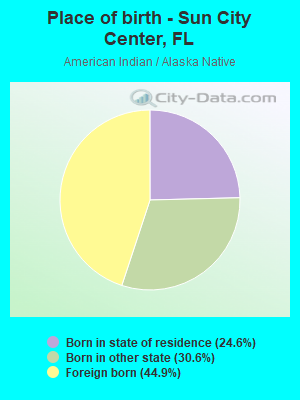
Place of birth - Born in state of residence (%) - American Indian and Alaska Native
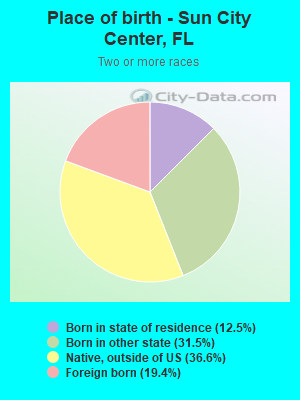
Place of birth - Born in state of residence (%) - Multirace
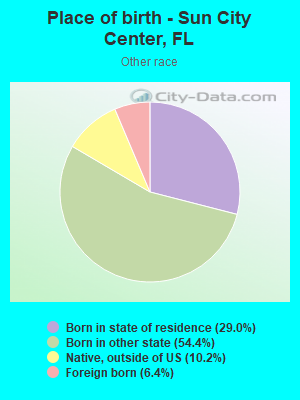
Place of birth - Born in state of residence (%) - Other Race
Place of birth - Born in other state (%)
Place of birth - Born in other state (%) - White
Place of birth - Born in other state (%) - Black or African American
Place of birth - Born in other state (%) - Asian
Place of birth - Born in other state (%) - Hispanic or Latino
Place of birth - Born in other state (%) - American Indian and Alaska Native
Place of birth - Born in other state (%) - Multirace
Place of birth - Born in other state (%) - Other Race
Place of birth - Native, outside of US (%)
Place of birth - Native, outside of US (%) - White
Place of birth - Native, outside of US (%) - Black or African American
Place of birth - Native, outside of US (%) - Asian
Place of birth - Native, outside of US (%) - Hispanic or Latino
Place of birth - Native, outside of US (%) - American Indian and Alaska Native
Place of birth - Native, outside of US (%) - Multirace
Place of birth - Native, outside of US (%) - Other Race
Place of birth - Foreign born (%)
Place of birth - Foreign born (%) - White
Place of birth - Foreign born (%) - Black or African American
Place of birth - Foreign born (%) - Asian
Place of birth - Foreign born (%) - Hispanic or Latino
Place of birth - Foreign born (%) - American Indian and Alaska Native
Place of birth - Foreign born (%) - Multirace
Place of birth - Foreign born (%) - Other Race
Residents speaking English at home (%)
Residents speaking English at home - Born in the United States (%)
Residents speaking English at home - Native, born elsewhere (%)
Residents speaking English at home - Foreign born (%)
Residents speaking Spanish at home (%)
Residents speaking Spanish at home - Born in the United States (%)
Residents speaking Spanish at home - Native, born elsewhere (%)
Residents speaking Spanish at home - Foreign born (%)
Residents speaking other language at home (%)
Residents speaking other language at home - Born in the United States (%)
Residents speaking other language at home - Native, born elsewhere (%)
Residents speaking other language at home - Foreign born (%)
Marital status - Never married (%)
Marital status - Now married (%)
Marital status - Separated (%)
Marital status - Widowed (%)
Marital status - Divorced (%)
Ancestries Reported - Arab (%)
Ancestries Reported - Czech (%)
Ancestries Reported - Danish (%)
Ancestries Reported - Dutch (%)
Ancestries Reported - English (%)
Ancestries Reported - French (%)
Ancestries Reported - French Canadian (%)
Ancestries Reported - German (%)
Ancestries Reported - Greek (%)
Ancestries Reported - Hungarian (%)
Ancestries Reported - Irish (%)
Ancestries Reported - Italian (%)
Ancestries Reported - Lithuanian (%)
Ancestries Reported - Norwegian (%)
Ancestries Reported - Polish (%)
Ancestries Reported - Portuguese (%)
Ancestries Reported - Russian (%)
Ancestries Reported - Scotch-Irish (%)
Ancestries Reported - Scottish (%)
Ancestries Reported - Slovak (%)
Ancestries Reported - Subsaharan African (%)
Ancestries Reported - Swedish (%)
Ancestries Reported - Swiss (%)
Ancestries Reported - Ukrainian (%)
Ancestries Reported - United States (%)
Ancestries Reported - Welsh (%)
Ancestries Reported - West Indian (%)
Ancestries Reported - Other (%)
Geographical mobility - Same house 1 year ago (%)
Geographical mobility - Same house 1 year ago (%) - White
Geographical mobility - Same house 1 year ago (%) - Black or African American
Geographical mobility - Same house 1 year ago (%) - Asian
Geographical mobility - Same house 1 year ago (%) - Hispanic or Latino
Geographical mobility - Same house 1 year ago (%) - American Indian and Alaska Native
Geographical mobility - Same house 1 year ago (%) - Multirace
Geographical mobility - Same house 1 year ago (%) - Other Race
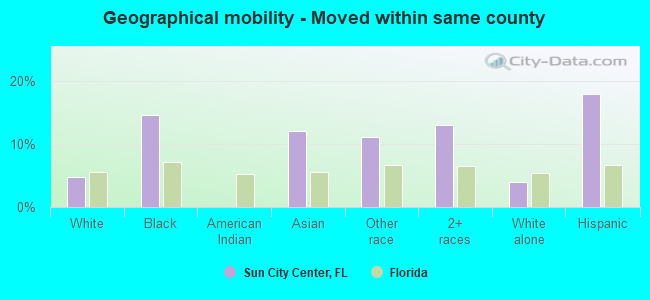
Geographical mobility - Moved within same county (%)
Geographical mobility - Moved within same county (%) - White
Geographical mobility - Moved within same county (%) - Black or African American
Geographical mobility - Moved within same county (%) - Asian
Geographical mobility - Moved within same county (%) - Hispanic or Latino
Geographical mobility - Moved within same county (%) - American Indian and Alaska Native
Geographical mobility - Moved within same county (%) - Multirace
Geographical mobility - Moved within same county (%) - Other Race
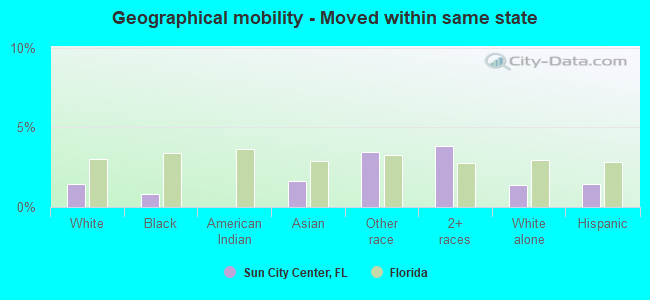
Geographical mobility - Moved from different county within same state (%)
Geographical mobility - Moved from different county within same state (%) - White
Geographical mobility - Moved from different county within same state (%) - Black or African American
Geographical mobility - Moved from different county within same state (%) - Asian
Geographical mobility - Moved from different county within same state (%) - Hispanic or Latino
Geographical mobility - Moved from different county within same state (%) - American Indian and Alaska Native
Geographical mobility - Moved from different county within same state (%) - Multirace
Geographical mobility - Moved from different county within same state (%) - Other Race
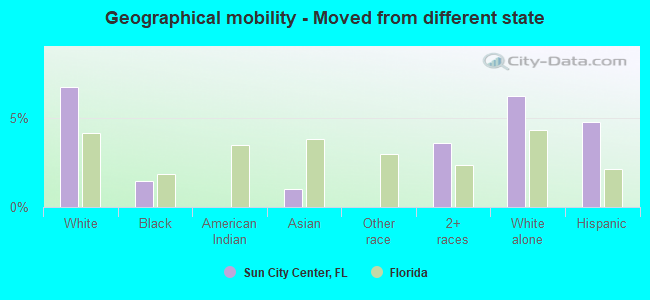
Geographical mobility - Moved from different state (%)
Geographical mobility - Moved from different state (%) - White
Geographical mobility - Moved from different state (%) - Black or African American
Geographical mobility - Moved from different state (%) - Asian
Geographical mobility - Moved from different state (%) - Hispanic or Latino
Geographical mobility - Moved from different state (%) - American Indian and Alaska Native
Geographical mobility - Moved from different state (%) - Multirace
Geographical mobility - Moved from different state (%) - Other Race
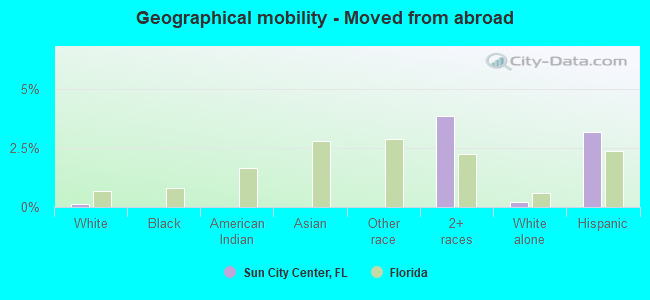
Geographical mobility - Moved from abroad (%)
Geographical mobility - Moved from abroad (%) - White
Geographical mobility - Moved from abroad (%) - Black or African American
Geographical mobility - Moved from abroad (%) - Asian
Geographical mobility - Moved from abroad (%) - Hispanic or Latino
Geographical mobility - Moved from abroad (%) - American Indian and Alaska Native
Geographical mobility - Moved from abroad (%) - Multirace
Geographical mobility - Moved from abroad (%) - Other Race
Place of birth for the foreign-born population - Ireland (%)
Place of birth for the foreign-born population - Denmark (%)
Place of birth for the foreign-born population - Norway (%)
Place of birth for the foreign-born population - Sweden (%)
Place of birth for the foreign-born population - United Kingdom (%)
Place of birth for the foreign-born population - England (%)
Place of birth for the foreign-born population - Scotland (%)
Place of birth for the foreign-born population - Other Northern Europe (%)
Place of birth for the foreign-born population - Austria (%)
Place of birth for the foreign-born population - Belgium (%)
Place of birth for the foreign-born population - France (%)
Place of birth for the foreign-born population - Germany (%)
Place of birth for the foreign-born population - Netherlands (%)
Place of birth for the foreign-born population - Switzerland (%)
Place of birth for the foreign-born population - Other Western Europe (%)
Place of birth for the foreign-born population - Greece (%)
Place of birth for the foreign-born population - Italy (%)
Place of birth for the foreign-born population - Portugal (%)
Place of birth for the foreign-born population - Spain (%)
Place of birth for the foreign-born population - Other Southern Europe (%)
Place of birth for the foreign-born population - Albania (%)
Place of birth for the foreign-born population - Belarus (%)
Place of birth for the foreign-born population - Bosnia and Herzegovina (%)
Place of birth for the foreign-born population - Bulgaria (%)
Place of birth for the foreign-born population - Croatia (%)
Place of birth for the foreign-born population - Czechoslovakia (%)
Place of birth for the foreign-born population - Hungary (%)
Place of birth for the foreign-born population - Latvia (%)
Place of birth for the foreign-born population - Lithuania (%)
Place of birth for the foreign-born population - North Macedonia (Macedonia) (%)
Place of birth for the foreign-born population - Moldova (%)
Place of birth for the foreign-born population - Poland (%)
Place of birth for the foreign-born population - Romania (%)
Place of birth for the foreign-born population - Russia (%)
Place of birth for the foreign-born population - Serbia (%)
Place of birth for the foreign-born population - Ukraine (%)
Place of birth for the foreign-born population - Other Eastern Europe (%)
Place of birth for the foreign-born population - China (%)
Place of birth for the foreign-born population - Hong Kong (%)
Place of birth for the foreign-born population - Taiwan (%)
Place of birth for the foreign-born population - Japan (%)
Place of birth for the foreign-born population - Korea (%)
Place of birth for the foreign-born population - Other Eastern Asia (%)
Place of birth for the foreign-born population - Afghanistan (%)
Place of birth for the foreign-born population - Bangladesh (%)
Place of birth for the foreign-born population - India (%)
Place of birth for the foreign-born population - Iran (%)
Place of birth for the foreign-born population - Kazakhstan (%)
Place of birth for the foreign-born population - Nepal (%)
Place of birth for the foreign-born population - Pakistan (%)
Place of birth for the foreign-born population - Sri Lanka (%)
Place of birth for the foreign-born population - Uzbekistan (%)
Place of birth for the foreign-born population - Other South Central Asia (%)
Place of birth for the foreign-born population - Burma (%)
Place of birth for the foreign-born population - Cambodia (%)
Place of birth for the foreign-born population - Indonesia (%)
Place of birth for the foreign-born population - Laos (%)
Place of birth for the foreign-born population - Malaysia (%)
Place of birth for the foreign-born population - Philippines (%)
Place of birth for the foreign-born population - Singapore (%)
Place of birth for the foreign-born population - Thailand (%)
Place of birth for the foreign-born population - Vietnam (%)
Place of birth for the foreign-born population - Other South Eastern Asia (%)
Place of birth for the foreign-born population - Armenia (%)
Place of birth for the foreign-born population - Iraq (%)
Place of birth for the foreign-born population - Israel (%)
Place of birth for the foreign-born population - Jordan (%)
Place of birth for the foreign-born population - Kuwait (%)
Place of birth for the foreign-born population - Lebanon (%)
Place of birth for the foreign-born population - Saudi Arabia (%)
Place of birth for the foreign-born population - Syria (%)
Place of birth for the foreign-born population - Turkey (%)
Place of birth for the foreign-born population - Yemen (%)
Place of birth for the foreign-born population - Other Western Asia (%)
Place of birth for the foreign-born population - Eritrea (%)
Place of birth for the foreign-born population - Ethiopia (%)
Place of birth for the foreign-born population - Kenya (%)
Place of birth for the foreign-born population - Somalia (%)
Place of birth for the foreign-born population - Uganda (%)
Place of birth for the foreign-born population - Zimbabwe (%)
Place of birth for the foreign-born population - Other Eastern Africa (%)
Place of birth for the foreign-born population - Cameroon (%)
Place of birth for the foreign-born population - Congo (%)
Place of birth for the foreign-born population - Democratic Republic of Congo (Zaire) (%)
Place of birth for the foreign-born population - Other Middle Africa (%)
Place of birth for the foreign-born population - Egypt (%)
Place of birth for the foreign-born population - Morocco (%)
Place of birth for the foreign-born population - Sudan (%)
Place of birth for the foreign-born population - Other Northern Africa (%)
Place of birth for the foreign-born population - South Africa (%)
Place of birth for the foreign-born population - Other Southern Africa (%)
Place of birth for the foreign-born population - Cabo Verde (%)
Place of birth for the foreign-born population - Ghana (%)
Place of birth for the foreign-born population - Liberia (%)
Place of birth for the foreign-born population - Nigeria (%)
Place of birth for the foreign-born population - Senegal (%)
Place of birth for the foreign-born population - Sierra Leone (%)
Place of birth for the foreign-born population - Other Western Africa (%)
Place of birth for the foreign-born population - Australia (%)
Place of birth for the foreign-born population - New Zealand (%)
Place of birth for the foreign-born population - Fiji (%)
Place of birth for the foreign-born population - Micronesia (%)
Place of birth for the foreign-born population - Bahamas (%)
Place of birth for the foreign-born population - Barbados (%)
Place of birth for the foreign-born population - Cuba (%)
Place of birth for the foreign-born population - Dominica (%)
Place of birth for the foreign-born population - Dominican Republic (%)
Place of birth for the foreign-born population - Grenada (%)
Place of birth for the foreign-born population - Haiti (%)
Place of birth for the foreign-born population - Jamaica (%)
Place of birth for the foreign-born population - St. Vincent and the Grenadines (%)
Place of birth for the foreign-born population - Trinidad and Tobago (%)
Place of birth for the foreign-born population - West Indies (%)
Place of birth for the foreign-born population - Other Caribbean (%)
Place of birth for the foreign-born population - Belize (%)
Place of birth for the foreign-born population - Costa Rica (%)
Place of birth for the foreign-born population - El Salvador (%)
Place of birth for the foreign-born population - Guatemala (%)
Place of birth for the foreign-born population - Honduras (%)
Place of birth for the foreign-born population - Mexico (%)
Place of birth for the foreign-born population - Nicaragua (%)
Place of birth for the foreign-born population - Panama (%)
Place of birth for the foreign-born population - Other Central America (%)
Place of birth for the foreign-born population - Argentina (%)
Place of birth for the foreign-born population - Bolivia (%)
Place of birth for the foreign-born population - Brazil (%)
Place of birth for the foreign-born population - Chile (%)
Place of birth for the foreign-born population - Colombia (%)
Place of birth for the foreign-born population - Ecuador (%)
Place of birth for the foreign-born population - Guyana (%)
Place of birth for the foreign-born population - Peru (%)
Place of birth for the foreign-born population - Uruguay (%)
Place of birth for the foreign-born population - Venezuela (%)
Place of birth for the foreign-born population - Other South America (%)
Place of birth for the foreign-born population - Canada (%)
Place of birth for the foreign-born population - Other Northern America (%)
Place of birth for the foreign-born population - Other (%)
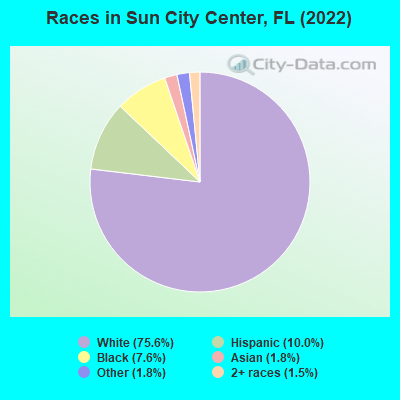
According to 2022 data, the most numerous races in Sun City Center, FL are White alone (22,824 residents), Hispanic (3,028 residents), and Black alone (2,299 residents). 87.9% of Sun City Center residents speak English at home.
Race distribution in Sun City Center 22,824 75.6% White alone 3,028 10.0% Hispanic 2,299 7.6% Black alone 557 1.8% Asian alone 556 1.8% Other race alone 456 1.5% Two or more races 14 0.05% American Indian alone
2000 2022
10,458,509 65.4% White alone 2,682,715 16.8% Hispanic 2,264,268 14.2% Black alone 261,693 1.6% Asian alone 236,954 1.5% Two or more races 42,358 0.3% American Indian alone 28,994 0.2% Other race alone 6,887 0.04% Native Hawaiian and Other
11,309,403 50.8% White alone 6,025,039 27.1% Hispanic 3,241,015 14.6% Black alone 861,630 3.9% Two or more races 623,692 2.8% Asian alone 152,054 0.7% Other race alone 22,504 0.1% American Indian alone 9,486 0.04% Native Hawaiian and Other
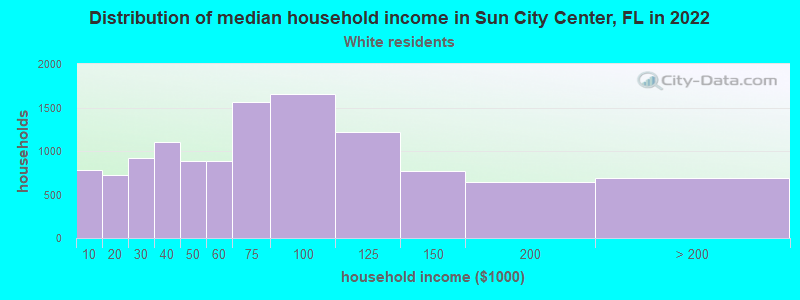
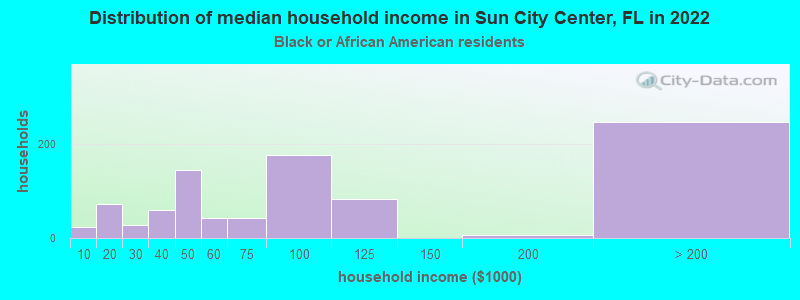
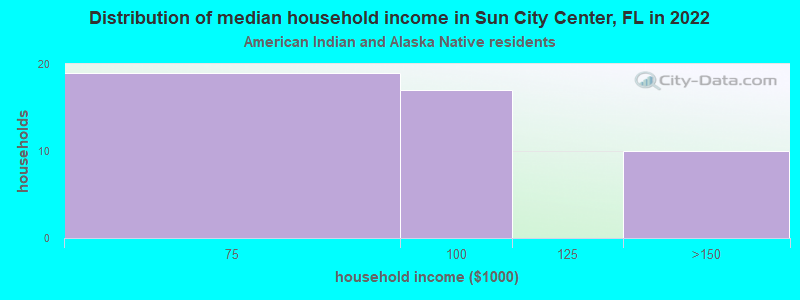
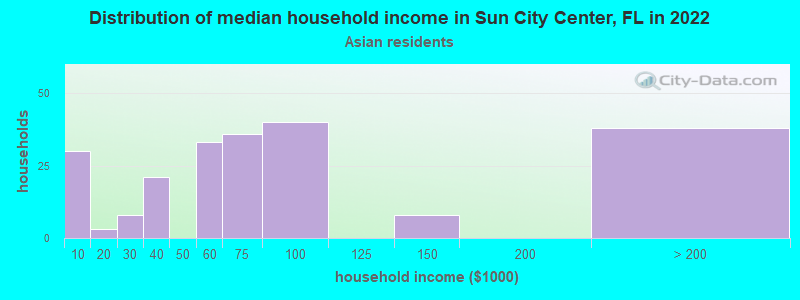
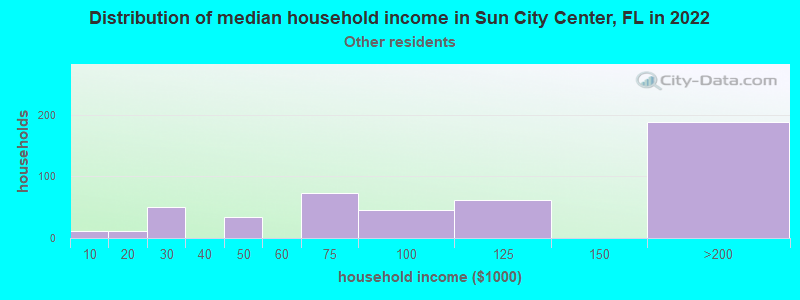
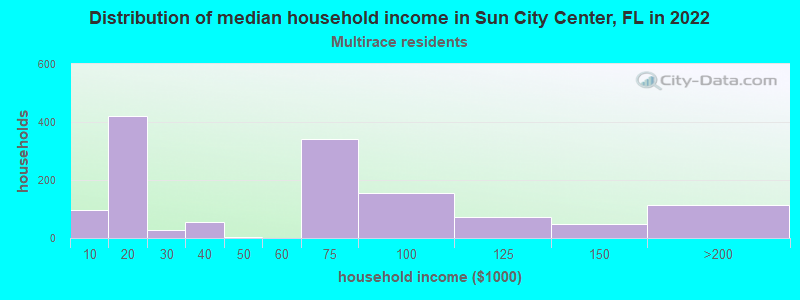
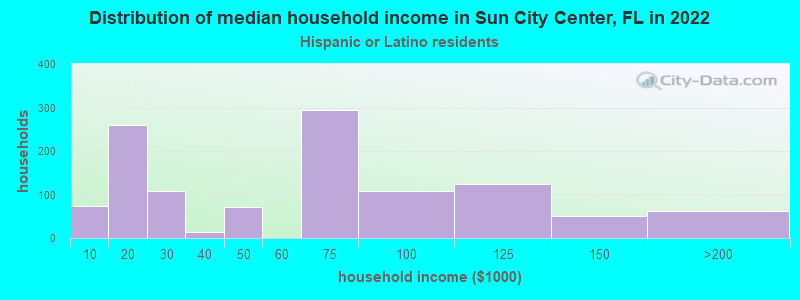
Income and house value in Sun City Center Median household income in 2022 $66,227 White non-Hispanic householders$77,427 Black householders$132,225 American Indian and Alaska Native householders$59,535 Asian householders$65,340 Two or more races householders$66,667 Hispanic or Latino race householders
Median age by race in Sun City Center
74.1 Median age for White residents74.5 73.5 45.7 Median age for Black or African American residents47.0 43.9 64.1 Median age for American Indian / Alaska Native residents64.3 -655,399,060.4 70.4 Median age for Asian residents70.1 70.3 -848,484,847.6 Median age for Native Hawaiian / Pacific Islander residents-776,729,559.0 -490,118,576.6 39.7 Median age for Other race residents35.0 60.6 60.7 Median age for Two or more races residents40.7 63.4 72.1 Median age for White alone residents72.2 72.0 54.2 Median age for Hispanic or Latino residents44.3 60.6
Owner/renter occupied households by race in Sun City Center
House owners and renters - White residents 10,381 84.7% Owner occupied1,877 15.3% Renter occupiedHouse owners and renters - Black or African American residents 779 85.4% Owner occupied133 14.6% Renter occupiedHouse owners and renters - American Indian / Alaska Native residents 69 100.0% Owner occupiedHouse owners and renters - Asian residents 256 97.6% Owner occupied6 2.4% Renter occupiedHouse owners and renters - Other race residents 407 87.8% Owner occupied57 12.2% Renter occupiedHouse owners and renters - Two or more races residents 968 71.8% Owner occupied380 28.2% Renter occupiedHouse owners and renters - White alone residents 10,957 83.4% Owner occupied2,184 16.6% Renter occupiedHouse owners and renters - Hispanic or Latino residents 945 77.0% Owner occupied282 23.0% Renter occupied
Language usage in Sun City Center
English speakers - Total 87.9% of residents of Sun City Center speak English at home.
7.0% of residents speak Spanish at home 1,142 55.6% Speak English very well912 44.4% Speak English less than very well5.3% of residents speak other language at home 1,073 69.4% Speak English very well474 30.6% Speak English less than very well
English speakers - Born in the United States 97.9% of residents of Sun City Center speak English at home.
1.6% of residents speak Spanish at home 277 76.1% Speak English very well87 23.9% Speak English less than very well1.0% of residents speak other language at home 199 91.3% Speak English very well19 8.7% Speak English less than very well
English speakers - Native, born elsewhere 40.0% of residents of Sun City Center speak English at home.
58.8% of residents speak Spanish at home 538 67.3% Speak English very well261 32.7% Speak English less than very well
English speakers - Foreign-born 31.1% of residents of Sun City Center speak English at home.
24.2% of residents speak Spanish at home 147 21.3% Speak English very well544 78.7% Speak English less than very well44.4% of residents speak other language at home 814 64.4% Speak English very well450 35.6% Speak English less than very well
White (Caucasian) - Speak only English Native:
100.0% (20,140)Foreign-born:
71.4% (515)
White (Caucasian) - Speak another language Native:
1.6% (321)Foreign-born:
50.2% (363)
Black or African American - Speak only English Native:
96.1% (1,836)Foreign-born:
41.9% (117)
Black or African American - Speak another language Native:
4.0% (77)Foreign-born:
58.1% (162)
Asian - Speak only English Native:
91.8% (32)Foreign-born:
22.9% (124)
Other race - Speak only English Native:
68.2% (605)Foreign-born:
25.2% (18)
Other race - Speak another language Native:
34.5% (306)Foreign-born:
69.6% (48)
Two or more races - Speak another language Native:
42.9% (967)Foreign-born:
100.0% (606)
White alone - Speak only English Native:
98.6% (21,001)Foreign-born:
52.4% (608)
White alone - Speak another language Native:
1.6% (333)Foreign-born:
49.0% (568)
Hispanic or Latino - Speak only English Native:
45.3% (949)Foreign-born:
3.0% (21)
Hispanic or Latino - Speak another language Native:
55.2% (1,157)Foreign-born:
97.2% (676)
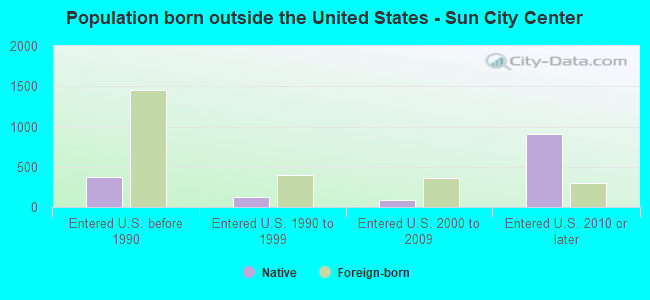
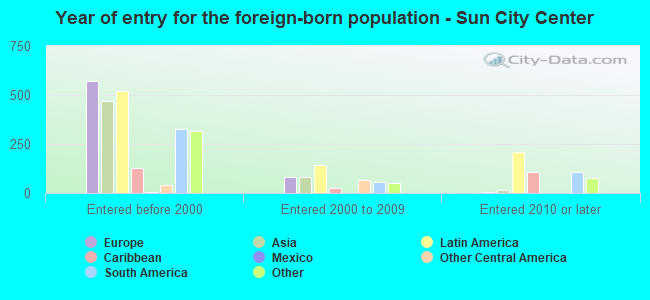
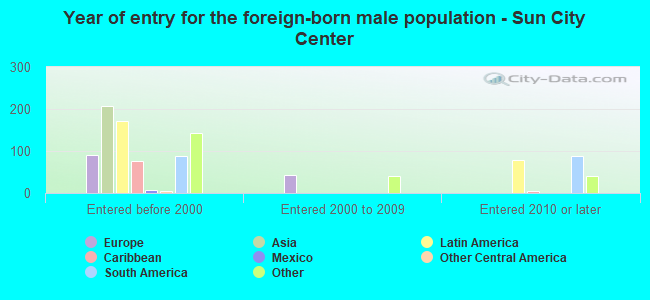
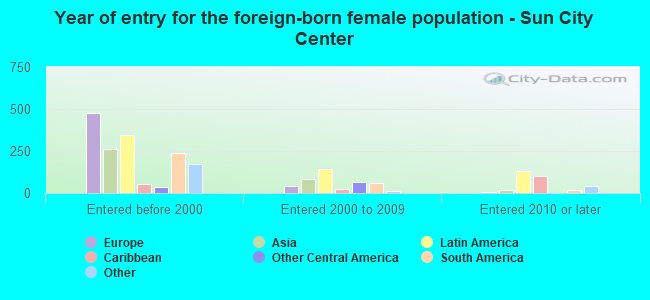
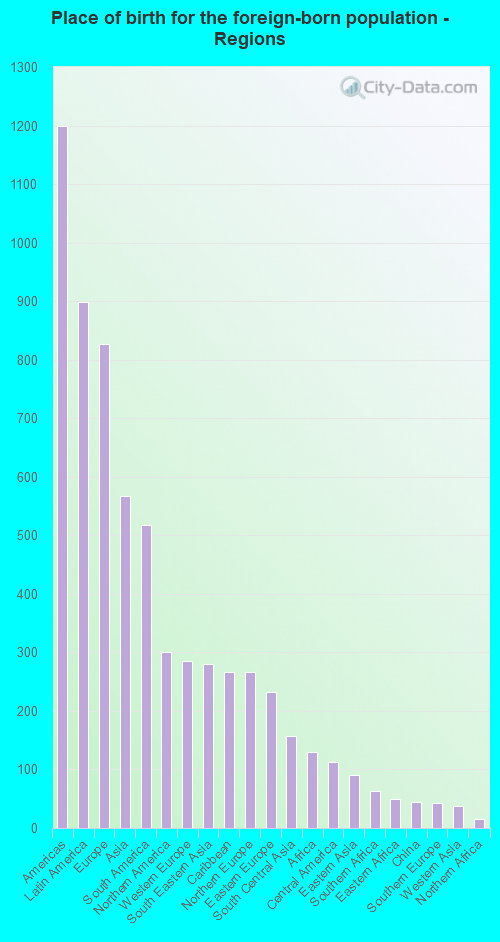
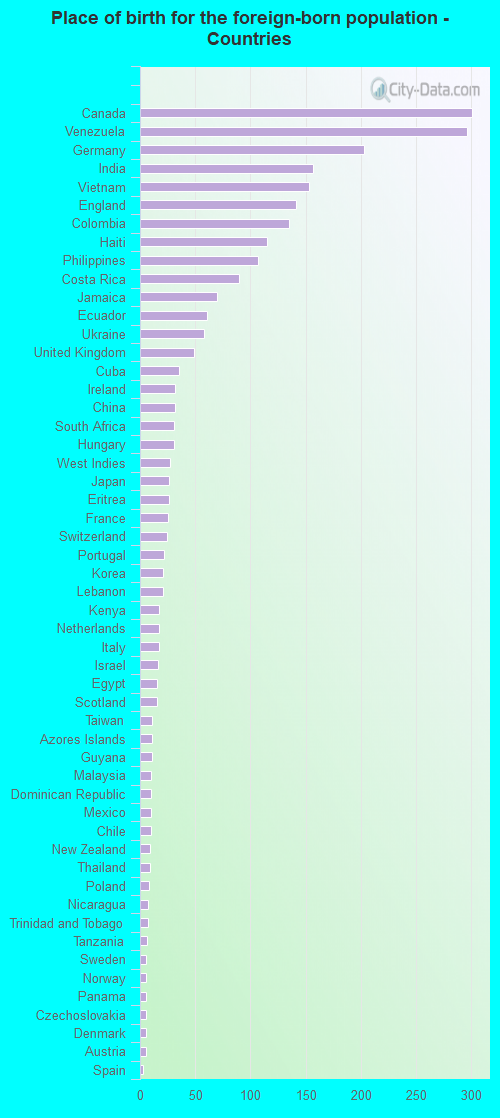
Foreign-born residents in Sun City Center
Marital status for residents in Sun City Center Marital status - White (Caucasian) population 15 years and over
Males 9.2% Never married72.4% Now married0.1% Separated9.1% Widowed9.3% DivorcedFemales 6.4% Never married55.2% Now married0.7% Separated21.3% Widowed16.4% DivorcedWomen who gave birth in the past 12 months Now married:
100.0% (87)Unmarried:
0.0% (0)
Women who did not give birth in the past 12 months Now married:
45.3% (424)Unmarried:
54.7% (511)
Marital status - Black or African American population 15 years and over
Males 9.9% Never married71.9% Now married0.4% Separated3.1% Widowed14.7% DivorcedFemales 27.5% Never married43.7% Now married0.0% Separated6.0% Widowed22.8% DivorcedWomen who gave birth in the past 12 months Now married:
92.2% (48)Unmarried:
7.8% (4)
Women who did not give birth in the past 12 months Now married:
36.7% (249)Unmarried:
63.3% (430)
Marital status - American Indian / Alaska Native population 15 years and over
Males 37.9% Never married62.1% Now married0.0% Separated0.0% Widowed0.0% DivorcedFemales 0.0% Never married100.0% Now married0.0% Separated0.0% Widowed0.0% DivorcedMarital status - Asian population 15 years and over
Males 0.0% Never married95.5% Now married0.0% Separated4.5% Widowed0.0% DivorcedFemales 14.6% Never married63.1% Now married0.0% Separated18.6% Widowed3.7% DivorcedWomen who did not give birth in the past 12 months Now married:
12.1% (4)Unmarried:
87.9% (31)
Marital status - Other race population 15 years and over
Males 22.1% Never married50.6% Now married0.0% Separated16.5% Widowed10.8% DivorcedFemales 2.4% Never married79.3% Now married0.0% Separated0.0% Widowed18.2% DivorcedWomen who did not give birth in the past 12 months Now married:
74.8% (114)Unmarried:
25.2% (38)
Marital status - Two or more races population 15 years and over
Males 49.6% Never married41.7% Now married0.0% Separated1.6% Widowed7.1% DivorcedFemales 19.3% Never married16.4% Now married1.2% Separated28.3% Widowed34.9% DivorcedWomen who did not give birth in the past 12 months Now married:
16.0% (64)Unmarried:
84.0% (337)
Marital status - White alone, not Hispanic / Latino population 15 years and over
Males 8.8% Never married72.5% Now married0.1% Separated9.3% Widowed9.2% DivorcedFemales 6.2% Never married56.1% Now married0.8% Separated21.4% Widowed15.6% DivorcedWomen who gave birth in the past 12 months Now married:
100.0% (102)Unmarried:
0.0% (0)
Women who did not give birth in the past 12 months Now married:
46.4% (411)Unmarried:
53.6% (474)
Marital status - Hispanic or Latino population 15 years and over
Males 43.4% Never married49.4% Now married0.0% Separated2.1% Widowed5.1% DivorcedFemales 12.8% Never married23.9% Now married0.0% Separated25.6% Widowed37.7% DivorcedWomen who did not give birth in the past 12 months Now married:
38.6% (185)Unmarried:
61.4% (295)
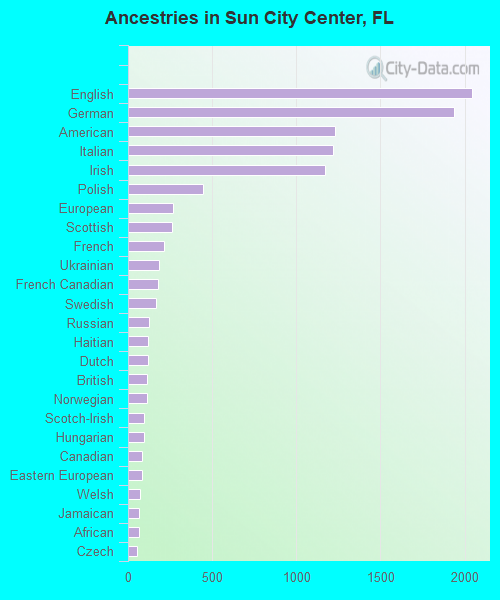
Ancestries in Sun City Center
2,043 11.7% English1,938 11.1% German1,232 7.1% American1,220 7.0% Italian1,169 6.7% Irish443 2.5% Polish265 1.5% European262 1.5% Scottish215 1.2% French182 1.0% Ukrainian181 1.0% French Canadian164 0.9% Swedish125 0.7% Russian121 0.7% Haitian120 0.7% Dutch114 0.7% British111 0.6% Norwegian97 0.6% Scotch-Irish93 0.5% Hungarian86 0.5% Canadian85 0.5% Eastern European72 0.4% Welsh65 0.4% Jamaican64 0.4% African54 0.3% Czech51 0.3% Swiss31 0.2% Austrian29 0.2% Greek29 0.2% Portuguese28 0.2% Slovak28 0.2% West Indian25 0.1% Lebanese23 0.1% Danish22 0.1% Cajun20 0.1% Northern European19 0.1% Croatian17 0.10% Lithuanian17 0.10% Romanian16 0.09% Maltese16 0.09% Kenyan14 0.08% Scandinavian10 0.06% Estonian9 0.05% Finnish8 0.05% Belgian8 0.05% Pennsylvania German8 0.05% Carpatho Rusyn7 0.04% Armenian7 0.04% Slovene2 0.01% Jordanian
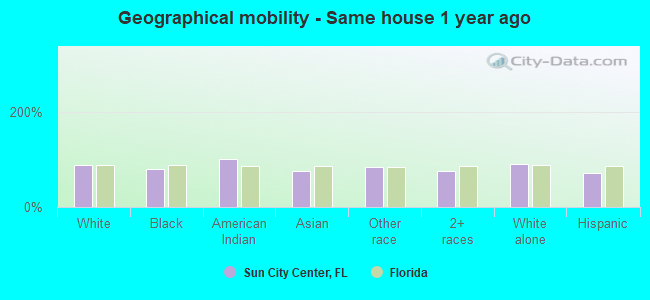
Geographical mobility in Sun City Center Same house 1 year ago 18,118 88.7% White (Caucasian)1,791 79.7% Black or African American57 100.0% American Indian / Alaska Native437 76.2% Asian866 84.1% Other race2,395 75.6% Two or more races20,304 89.6% White alone, not Hispanic / Latino2,115 71.0% Hispanic or LatinoMoved within same county 960 4.7% White / Caucasian327 14.6% Black or African American69 12.0% Asian115 11.2% Other race409 12.9% Two or more races896 4.0% White alone, not Hispanic / Latino531 17.8% Hispanic or LatinoMoved within same state 289 1.4% White / Caucasian18 0.8% Black or African American9 1.7% Asian36 3.5% Other race122 3.8% Two or more races318 1.4% White alone, not Hispanic / Latino42 1.4% Hispanic or LatinoMoved from different state 1,374 6.7% White / Caucasian33 1.5% Black or African American6 1.0% Asian113 3.6% Two or more races1,408 6.2% White alone, not Hispanic / Latino141 4.7% Hispanic or LatinoMoved from abroad 30 0.1% White121 3.8% Two or more races44 0.2% White alone, not Hispanic / Latino94 3.2% Hispanic or Latino
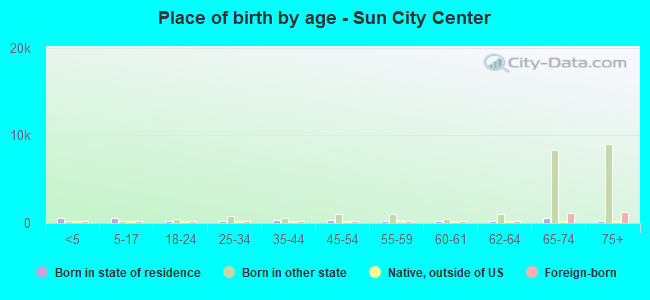
Children Nativity (place of birth) in Sun City Center
Children under 6 years - Living with two parents Both parents native 715 100.0% NativeOne native, one foreign-born parent 6 100.0% NativeChildren under 6 years - Living with one parent Native parent 81 100.0% NativeForeign-born parent 22 100.0% Native
Children 6 to 17 years - Living with two parents Both parents native 494 100.0% NativeOne native, one foreign-born parent 108 100.0% NativeChildren 6 to 17 years - Living with one parent Native parent 285 100.0% Native
Grandparents responsible for own grandchildren in Sun City Center
Grandparents (30 to 59 years) White / Caucasian 7 100.0% Responsible for grandchildrenBlack or African American 37 38.5% Responsible for grandchildren60 61.5% Not responsible for grandchildrenOther race 12 100.0% Not responsible for grandchildrenHispanic or Latino 17 70.3% Responsible for grandchildren7 29.7% Not responsible for grandchildrenGrandparents (60 years and over) White / Caucasian 8 35.4% Responsible for grandchildren15 64.6% Not responsible for grandchildrenHispanic or Latino 65 100.0% Not responsible for grandchildren