Races in Sun Prairie, Wisconsin (WI) Detailed Stats
Data:
Races - White alone (%)
Races - White alone (% change since 2000)
Races - Black alone (%)
Races - Black alone (% change since 2000)
Races - American Indian alone (%)
Races - American Indian alone (% change since 2000)
Races - Asian alone (%)
Races - Asian alone (% change since 2000)
Races - Hispanic (%)
Races - Hispanic (% change since 2000)
Races - Native Hawaiian and Other Pacific Islander alone (%)
Races - Native Hawaiian and Other Pacific Islander alone (% change since 2000)
Races - Two or more races(%)
Races - Two or more races(% change since 2000)
Races - Other race alone (%)
Races - Other race alone (% change since 2000)
Racial diversity
Place of birth - Born in state of residence (%)
Place of birth - Born in state of residence (%) - White
Place of birth - Born in state of residence (%) - Black or African American
Place of birth - Born in state of residence (%) - Asian
Place of birth - Born in state of residence (%) - Hispanic or Latino
Place of birth - Born in state of residence (%) - American Indian and Alaska Native
Place of birth - Born in state of residence (%) - Multirace
Place of birth - Born in state of residence (%) - Other Race
Place of birth - Born in other state (%)
Place of birth - Born in other state (%) - White
Place of birth - Born in other state (%) - Black or African American
Place of birth - Born in other state (%) - Asian
Place of birth - Born in other state (%) - Hispanic or Latino
Place of birth - Born in other state (%) - American Indian and Alaska Native
Place of birth - Born in other state (%) - Multirace
Place of birth - Born in other state (%) - Other Race
Place of birth - Native, outside of US (%)
Place of birth - Native, outside of US (%) - White
Place of birth - Native, outside of US (%) - Black or African American
Place of birth - Native, outside of US (%) - Asian
Place of birth - Native, outside of US (%) - Hispanic or Latino
Place of birth - Native, outside of US (%) - American Indian and Alaska Native
Place of birth - Native, outside of US (%) - Multirace
Place of birth - Native, outside of US (%) - Other Race
Place of birth - Foreign born (%)
Place of birth - Foreign born (%) - White
Place of birth - Foreign born (%) - Black or African American
Place of birth - Foreign born (%) - Asian
Place of birth - Foreign born (%) - Hispanic or Latino
Place of birth - Foreign born (%) - American Indian and Alaska Native
Place of birth - Foreign born (%) - Multirace
Place of birth - Foreign born (%) - Other Race
Residents speaking English at home (%)
Residents speaking English at home - Born in the United States (%)
Residents speaking English at home - Native, born elsewhere (%)
Residents speaking English at home - Foreign born (%)
Residents speaking Spanish at home (%)
Residents speaking Spanish at home - Born in the United States (%)
Residents speaking Spanish at home - Native, born elsewhere (%)
Residents speaking Spanish at home - Foreign born (%)
Residents speaking other language at home (%)
Residents speaking other language at home - Born in the United States (%)
Residents speaking other language at home - Native, born elsewhere (%)
Residents speaking other language at home - Foreign born (%)
Marital status - Never married (%)
Marital status - Now married (%)
Marital status - Separated (%)
Marital status - Widowed (%)
Marital status - Divorced (%)
Ancestries Reported - Arab (%)
Ancestries Reported - Czech (%)
Ancestries Reported - Danish (%)
Ancestries Reported - Dutch (%)
Ancestries Reported - English (%)
Ancestries Reported - French (%)
Ancestries Reported - French Canadian (%)
Ancestries Reported - German (%)
Ancestries Reported - Greek (%)
Ancestries Reported - Hungarian (%)
Ancestries Reported - Irish (%)
Ancestries Reported - Italian (%)
Ancestries Reported - Lithuanian (%)
Ancestries Reported - Norwegian (%)
Ancestries Reported - Polish (%)
Ancestries Reported - Portuguese (%)
Ancestries Reported - Russian (%)
Ancestries Reported - Scotch-Irish (%)
Ancestries Reported - Scottish (%)
Ancestries Reported - Slovak (%)
Ancestries Reported - Subsaharan African (%)
Ancestries Reported - Swedish (%)
Ancestries Reported - Swiss (%)
Ancestries Reported - Ukrainian (%)
Ancestries Reported - United States (%)
Ancestries Reported - Welsh (%)
Ancestries Reported - West Indian (%)
Ancestries Reported - Other (%)
Geographical mobility - Same house 1 year ago (%)
Geographical mobility - Same house 1 year ago (%) - White
Geographical mobility - Same house 1 year ago (%) - Black or African American
Geographical mobility - Same house 1 year ago (%) - Asian
Geographical mobility - Same house 1 year ago (%) - Hispanic or Latino
Geographical mobility - Same house 1 year ago (%) - American Indian and Alaska Native
Geographical mobility - Same house 1 year ago (%) - Multirace
Geographical mobility - Same house 1 year ago (%) - Other Race
Geographical mobility - Moved within same county (%)
Geographical mobility - Moved within same county (%) - White
Geographical mobility - Moved within same county (%) - Black or African American
Geographical mobility - Moved within same county (%) - Asian
Geographical mobility - Moved within same county (%) - Hispanic or Latino
Geographical mobility - Moved within same county (%) - American Indian and Alaska Native
Geographical mobility - Moved within same county (%) - Multirace
Geographical mobility - Moved within same county (%) - Other Race
Geographical mobility - Moved from different county within same state (%)
Geographical mobility - Moved from different county within same state (%) - White
Geographical mobility - Moved from different county within same state (%) - Black or African American
Geographical mobility - Moved from different county within same state (%) - Asian
Geographical mobility - Moved from different county within same state (%) - Hispanic or Latino
Geographical mobility - Moved from different county within same state (%) - American Indian and Alaska Native
Geographical mobility - Moved from different county within same state (%) - Multirace
Geographical mobility - Moved from different county within same state (%) - Other Race
Geographical mobility - Moved from different state (%)
Geographical mobility - Moved from different state (%) - White
Geographical mobility - Moved from different state (%) - Black or African American
Geographical mobility - Moved from different state (%) - Asian
Geographical mobility - Moved from different state (%) - Hispanic or Latino
Geographical mobility - Moved from different state (%) - American Indian and Alaska Native
Geographical mobility - Moved from different state (%) - Multirace
Geographical mobility - Moved from different state (%) - Other Race
Geographical mobility - Moved from abroad (%)
Geographical mobility - Moved from abroad (%) - White
Geographical mobility - Moved from abroad (%) - Black or African American
Geographical mobility - Moved from abroad (%) - Asian
Geographical mobility - Moved from abroad (%) - Hispanic or Latino
Geographical mobility - Moved from abroad (%) - American Indian and Alaska Native
Geographical mobility - Moved from abroad (%) - Multirace
Geographical mobility - Moved from abroad (%) - Other Race
Place of birth for the foreign-born population - Ireland (%)
Place of birth for the foreign-born population - Denmark (%)
Place of birth for the foreign-born population - Norway (%)
Place of birth for the foreign-born population - Sweden (%)
Place of birth for the foreign-born population - United Kingdom (%)
Place of birth for the foreign-born population - England (%)
Place of birth for the foreign-born population - Scotland (%)
Place of birth for the foreign-born population - Other Northern Europe (%)
Place of birth for the foreign-born population - Austria (%)
Place of birth for the foreign-born population - Belgium (%)
Place of birth for the foreign-born population - France (%)
Place of birth for the foreign-born population - Germany (%)
Place of birth for the foreign-born population - Netherlands (%)
Place of birth for the foreign-born population - Switzerland (%)
Place of birth for the foreign-born population - Other Western Europe (%)
Place of birth for the foreign-born population - Greece (%)
Place of birth for the foreign-born population - Italy (%)
Place of birth for the foreign-born population - Portugal (%)
Place of birth for the foreign-born population - Spain (%)
Place of birth for the foreign-born population - Other Southern Europe (%)
Place of birth for the foreign-born population - Albania (%)
Place of birth for the foreign-born population - Belarus (%)
Place of birth for the foreign-born population - Bosnia and Herzegovina (%)
Place of birth for the foreign-born population - Bulgaria (%)
Place of birth for the foreign-born population - Croatia (%)
Place of birth for the foreign-born population - Czechoslovakia (%)
Place of birth for the foreign-born population - Hungary (%)
Place of birth for the foreign-born population - Latvia (%)
Place of birth for the foreign-born population - Lithuania (%)
Place of birth for the foreign-born population - North Macedonia (Macedonia) (%)
Place of birth for the foreign-born population - Moldova (%)
Place of birth for the foreign-born population - Poland (%)
Place of birth for the foreign-born population - Romania (%)
Place of birth for the foreign-born population - Russia (%)
Place of birth for the foreign-born population - Serbia (%)
Place of birth for the foreign-born population - Ukraine (%)
Place of birth for the foreign-born population - Other Eastern Europe (%)
Place of birth for the foreign-born population - China (%)
Place of birth for the foreign-born population - Hong Kong (%)
Place of birth for the foreign-born population - Taiwan (%)
Place of birth for the foreign-born population - Japan (%)
Place of birth for the foreign-born population - Korea (%)
Place of birth for the foreign-born population - Other Eastern Asia (%)
Place of birth for the foreign-born population - Afghanistan (%)
Place of birth for the foreign-born population - Bangladesh (%)
Place of birth for the foreign-born population - India (%)
Place of birth for the foreign-born population - Iran (%)
Place of birth for the foreign-born population - Kazakhstan (%)
Place of birth for the foreign-born population - Nepal (%)
Place of birth for the foreign-born population - Pakistan (%)
Place of birth for the foreign-born population - Sri Lanka (%)
Place of birth for the foreign-born population - Uzbekistan (%)
Place of birth for the foreign-born population - Other South Central Asia (%)
Place of birth for the foreign-born population - Burma (%)
Place of birth for the foreign-born population - Cambodia (%)
Place of birth for the foreign-born population - Indonesia (%)
Place of birth for the foreign-born population - Laos (%)
Place of birth for the foreign-born population - Malaysia (%)
Place of birth for the foreign-born population - Philippines (%)
Place of birth for the foreign-born population - Singapore (%)
Place of birth for the foreign-born population - Thailand (%)
Place of birth for the foreign-born population - Vietnam (%)
Place of birth for the foreign-born population - Other South Eastern Asia (%)
Place of birth for the foreign-born population - Armenia (%)
Place of birth for the foreign-born population - Iraq (%)
Place of birth for the foreign-born population - Israel (%)
Place of birth for the foreign-born population - Jordan (%)
Place of birth for the foreign-born population - Kuwait (%)
Place of birth for the foreign-born population - Lebanon (%)
Place of birth for the foreign-born population - Saudi Arabia (%)
Place of birth for the foreign-born population - Syria (%)
Place of birth for the foreign-born population - Turkey (%)
Place of birth for the foreign-born population - Yemen (%)
Place of birth for the foreign-born population - Other Western Asia (%)
Place of birth for the foreign-born population - Eritrea (%)
Place of birth for the foreign-born population - Ethiopia (%)
Place of birth for the foreign-born population - Kenya (%)
Place of birth for the foreign-born population - Somalia (%)
Place of birth for the foreign-born population - Uganda (%)
Place of birth for the foreign-born population - Zimbabwe (%)
Place of birth for the foreign-born population - Other Eastern Africa (%)
Place of birth for the foreign-born population - Cameroon (%)
Place of birth for the foreign-born population - Congo (%)
Place of birth for the foreign-born population - Democratic Republic of Congo (Zaire) (%)
Place of birth for the foreign-born population - Other Middle Africa (%)
Place of birth for the foreign-born population - Egypt (%)
Place of birth for the foreign-born population - Morocco (%)
Place of birth for the foreign-born population - Sudan (%)
Place of birth for the foreign-born population - Other Northern Africa (%)
Place of birth for the foreign-born population - South Africa (%)
Place of birth for the foreign-born population - Other Southern Africa (%)
Place of birth for the foreign-born population - Cabo Verde (%)
Place of birth for the foreign-born population - Ghana (%)
Place of birth for the foreign-born population - Liberia (%)
Place of birth for the foreign-born population - Nigeria (%)
Place of birth for the foreign-born population - Senegal (%)
Place of birth for the foreign-born population - Sierra Leone (%)
Place of birth for the foreign-born population - Other Western Africa (%)
Place of birth for the foreign-born population - Australia (%)
Place of birth for the foreign-born population - New Zealand (%)
Place of birth for the foreign-born population - Fiji (%)
Place of birth for the foreign-born population - Micronesia (%)
Place of birth for the foreign-born population - Bahamas (%)
Place of birth for the foreign-born population - Barbados (%)
Place of birth for the foreign-born population - Cuba (%)
Place of birth for the foreign-born population - Dominica (%)
Place of birth for the foreign-born population - Dominican Republic (%)
Place of birth for the foreign-born population - Grenada (%)
Place of birth for the foreign-born population - Haiti (%)
Place of birth for the foreign-born population - Jamaica (%)
Place of birth for the foreign-born population - St. Vincent and the Grenadines (%)
Place of birth for the foreign-born population - Trinidad and Tobago (%)
Place of birth for the foreign-born population - West Indies (%)
Place of birth for the foreign-born population - Other Caribbean (%)
Place of birth for the foreign-born population - Belize (%)
Place of birth for the foreign-born population - Costa Rica (%)
Place of birth for the foreign-born population - El Salvador (%)
Place of birth for the foreign-born population - Guatemala (%)
Place of birth for the foreign-born population - Honduras (%)
Place of birth for the foreign-born population - Mexico (%)
Place of birth for the foreign-born population - Nicaragua (%)
Place of birth for the foreign-born population - Panama (%)
Place of birth for the foreign-born population - Other Central America (%)
Place of birth for the foreign-born population - Argentina (%)
Place of birth for the foreign-born population - Bolivia (%)
Place of birth for the foreign-born population - Brazil (%)
Place of birth for the foreign-born population - Chile (%)
Place of birth for the foreign-born population - Colombia (%)
Place of birth for the foreign-born population - Ecuador (%)
Place of birth for the foreign-born population - Guyana (%)
Place of birth for the foreign-born population - Peru (%)
Place of birth for the foreign-born population - Uruguay (%)
Place of birth for the foreign-born population - Venezuela (%)
Place of birth for the foreign-born population - Other South America (%)
Place of birth for the foreign-born population - Canada (%)
Place of birth for the foreign-born population - Other Northern America (%)
Place of birth for the foreign-born population - Other (%)
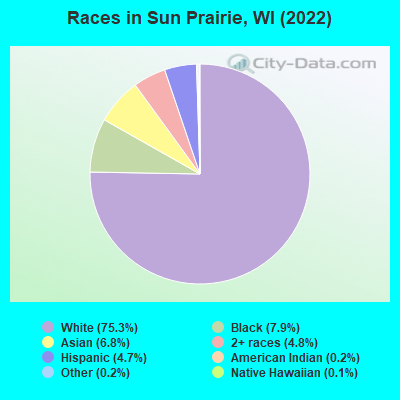
According to 2022 data, the most numerous races in Sun Prairie, WI are White alone (27,381 residents), Hispanic (1,728 residents), and Black alone (2,892 residents). 90.3% of Sun Prairie residents speak English at home. 7.9% of Sun Prairie, WI residents are foreign-born (4.6% born in Asia, 2.1% born in Africa), which is 36.8% greater than the foreign-born rate of 5.0% across the entire state of Wisconsin.
Race distribution in Sun Prairie
2000 2022
4,681,630 87.3% White alone 300,245 5.6% Black alone 192,921 3.6% Hispanic 87,995 1.6% Asian alone 51,921 1.0% Two or more races 43,980 0.8% American Indian alone 3,637 0.07% Other race alone 1,346 0.03% Native Hawaiian and Other
4,654,031 79.0% White alone 447,022 7.6% Hispanic 345,678 5.9% Black alone 217,532 3.7% Two or more races 172,242 2.9% Asian alone 33,762 0.6% American Indian alone 19,680 0.3% Other race alone 2,592 0.04% Native Hawaiian and Other
Income and house value in Sun Prairie Median household income in 2022 $89,442 White non-Hispanic householders$69,033 Black householders$132,388 Asian householders$181,909 Some other race householders$73,390 Two or more races householders$92,377 Hispanic or Latino race householdersMedian 2022 house value $342,827 White Non-Hispanic householders$616,370 Black or African American householders$389,577 American Indian or Alaska Native householders $385,261 Asian householders$367,760 Some other race householders$367,760 Hispanic or Latino householders
Median age by race in Sun Prairie
41.4 Median age for White residents38.6 44.3 25.2 Median age for Black or African American residents24.3 26.0 24.8 Median age for American Indian / Alaska Native residents15.3 30.7 35.4 Median age for Asian residents35.8 34.9 84.7 Median age for Native Hawaiian / Pacific Islander residents8.8 -732,444,443.7 24.5 Median age for Other race residents25.9 24.6 16.8 Median age for Two or more races residents17.5 16.3 41.7 Median age for White alone residents38.9 44.3 20.4 Median age for Hispanic or Latino residents18.5 22.2
Owner/renter occupied households by race in Sun Prairie
House owners and renters - White residents 8,429 64.6% Owner occupied4,628 35.4% Renter occupiedHouse owners and renters - Black or African American residents 227 29.8% Owner occupied534 70.2% Renter occupiedHouse owners and renters - American Indian / Alaska Native residents 26 100.0% Renter occupiedHouse owners and renters - Asian residents 675 76.0% Owner occupied213 24.0% Renter occupiedHouse owners and renters - Native Hawaiian / Pacific Islander residents 57 100.0% Owner occupiedHouse owners and renters - Other race residents 33 68.3% Owner occupied15 31.7% Renter occupiedHouse owners and renters - Two or more races residents 138 29.6% Owner occupied327 70.4% Renter occupiedHouse owners and renters - White alone residents 8,360 64.6% Owner occupied4,576 35.4% Renter occupiedHouse owners and renters - Hispanic or Latino residents 160 35.8% Owner occupied287 64.2% Renter occupied
Language usage in Sun Prairie
English speakers - Total 90.3% of residents of Sun Prairie speak English at home.
2.3% of residents speak Spanish at home 713 88.4% Speak English very well94 11.6% Speak English less than very well7.6% of residents speak other language at home 2,027 77.8% Speak English very well579 22.2% Speak English less than very well
English speakers - Born in the United States 94.3% of residents of Sun Prairie speak English at home.
3.0% of residents speak Spanish at home 239 75.6% Speak English very well77 24.4% Speak English less than very well2.8% of residents speak other language at home 286 98.3% Speak English very well5 1.7% Speak English less than very well
English speakers - Native, born elsewhere 82.0% of residents of Sun Prairie speak English at home.
14.3% of residents speak Spanish at home 77 97.5% Speak English very well2 2.5% Speak English less than very well
English speakers - Foreign-born 26.3% of residents of Sun Prairie speak English at home.
9.9% of residents speak Spanish at home 248 89.2% Speak English very well30 10.8% Speak English less than very well67.3% of residents speak other language at home 1,394 73.9% Speak English very well492 26.1% Speak English less than very well
White (Caucasian) - Speak only English Native:
98.0% (25,917)Foreign-born:
29.1% (63)
White (Caucasian) - Speak another language Native:
2.0% (528)Foreign-born:
71.0% (152)
Black or African American - Speak only English Native:
95.4% (1,900)Foreign-born:
38.6% (299)
Black or African American - Speak another language Native:
4.7% (94)Foreign-born:
50.4% (390)
Asian - Speak only English Native:
58.2% (425)Foreign-born:
15.8% (259)
Asian - Speak another language Native:
40.8% (298)Foreign-born:
85.2% (1,395)
Other race - Speak another language Native:
20.7% (67)Foreign-born:
99.4% (92)
Two or more races - Speak another language Native:
3.3% (65)Foreign-born:
100.0% (29)
White alone - Speak only English Native:
98.0% (25,507)Foreign-born:
29.6% (59)
White alone - Speak another language Native:
2.0% (513)Foreign-born:
75.1% (150)
Hispanic or Latino - Speak only English Native:
76.5% (988)Foreign-born:
8.8% (22)
Hispanic or Latino - Speak another language Native:
20.0% (259)Foreign-born:
92.7% (234)
Foreign-born residents in Sun Prairie 2,877 residents are foreign born (4.6% Asia , 2.1% Africa ).
This city:
7.9%Wisconsin:
5.0%
Marital status for residents in Sun Prairie Marital status - White (Caucasian) population 15 years and over
Males 32.2% Never married56.5% Now married0.6% Separated1.1% Widowed9.6% DivorcedFemales 24.9% Never married48.7% Now married0.8% Separated9.4% Widowed16.2% DivorcedWomen who gave birth in the past 12 months Now married:
100.0% (237)Unmarried:
0.0% (0)
Women who did not give birth in the past 12 months Now married:
45.0% (2,933)Unmarried:
55.0% (3,583)
Marital status - Black or African American population 15 years and over
Males 45.4% Never married41.8% Now married0.0% Separated6.0% Widowed6.9% DivorcedFemales 55.9% Never married34.2% Now married0.9% Separated2.1% Widowed6.9% DivorcedWomen who gave birth in the past 12 months Now married:
0.0% (0)Unmarried:
100.0% (59)
Women who did not give birth in the past 12 months Now married:
36.6% (297)Unmarried:
63.4% (515)
Marital status - American Indian / Alaska Native population 15 years and over
Males 100.0% Never married0.0% Now married0.0% Separated0.0% Widowed0.0% DivorcedFemales 9.5% Never married36.5% Now married0.0% Separated0.0% Widowed54.0% DivorcedWomen who did not give birth in the past 12 months Now married:
0.0% (0)Unmarried:
100.0% (38)
Marital status - Asian population 15 years and over
Males 30.9% Never married63.3% Now married0.0% Separated4.3% Widowed1.5% DivorcedFemales 23.6% Never married60.5% Now married1.8% Separated2.9% Widowed11.2% DivorcedWomen who gave birth in the past 12 months Now married:
100.0% (26)Unmarried:
0.0% (0)
Women who did not give birth in the past 12 months Now married:
62.3% (424)Unmarried:
37.7% (257)
Marital status - Other race population 15 years and over
Males 61.7% Never married38.3% Now married0.0% Separated0.0% Widowed0.0% DivorcedFemales 13.1% Never married86.9% Now married0.0% Separated0.0% Widowed0.0% DivorcedWomen who did not give birth in the past 12 months Now married:
80.6% (75)Unmarried:
19.4% (18)
Marital status - Two or more races population 15 years and over
Males 67.6% Never married27.5% Now married0.0% Separated0.0% Widowed4.9% DivorcedFemales 62.6% Never married29.3% Now married0.0% Separated6.1% Widowed2.0% DivorcedWomen who gave birth in the past 12 months Now married:
100.0% (42)Unmarried:
0.0% (0)
Women who did not give birth in the past 12 months Now married:
25.4% (157)Unmarried:
74.6% (461)
Marital status - White alone, not Hispanic / Latino population 15 years and over
Males 32.3% Never married56.8% Now married0.5% Separated1.1% Widowed9.2% DivorcedFemales 24.5% Never married48.7% Now married0.8% Separated9.5% Widowed16.4% DivorcedWomen who gave birth in the past 12 months Now married:
100.0% (243)Unmarried:
0.0% (0)
Women who did not give birth in the past 12 months Now married:
45.2% (2,949)Unmarried:
54.8% (3,577)
Marital status - Hispanic or Latino population 15 years and over
Males 48.4% Never married36.2% Now married1.7% Separated0.0% Widowed13.6% DivorcedFemales 36.0% Never married50.6% Now married0.0% Separated4.7% Widowed8.7% DivorcedWomen who did not give birth in the past 12 months Now married:
43.5% (176)Unmarried:
56.5% (229)
Ancestries in Sun Prairie
4,450 27.2% German1,119 6.8% American828 5.1% Irish778 4.8% Norwegian744 4.5% English498 3.0% Polish393 2.4% European316 1.9% Scottish305 1.9% Northern European162 1.0% Ukrainian124 0.8% Dutch124 0.8% African120 0.7% Scandinavian119 0.7% Italian107 0.7% Kenyan63 0.4% Swedish40 0.2% Eastern European35 0.2% French Canadian35 0.2% Portuguese30 0.2% Greek29 0.2% Egyptian24 0.1% Swiss21 0.1% Liberian18 0.1% Belgian15 0.09% French13 0.08% Scotch-Irish13 0.08% Finnish13 0.08% Welsh12 0.07% Hungarian11 0.07% Czech9 0.05% Armenian9 0.05% Danish9 0.05% Russian7 0.04% Estonian6 0.04% Nigerian1 0.01% Serbian
Geographical mobility in Sun Prairie Same house 1 year ago 24,594 89.0% White (Caucasian)2,405 85.1% Black or African American96 71.1% American Indian / Alaska Native2,030 82.9% Asian58 100.0% Native Hawaiian / Pacific Islander333 86.5% Other race1,684 69.2% Two or more races24,317 89.2% White alone, not Hispanic / Latino1,237 71.7% Hispanic or LatinoMoved within same county 1,639 5.9% White / Caucasian350 12.4% Black or African American37 27.6% American Indian / Alaska Native264 10.8% Asian597 24.5% Two or more races1,663 6.1% White alone, not Hispanic / Latino205 11.9% Hispanic or LatinoMoved within same state 669 2.4% White / Caucasian20 0.7% Black or African American75 3.1% Asian72 3.0% Two or more races650 2.4% White alone, not Hispanic / Latino47 2.7% Hispanic or LatinoMoved from different state 742 2.7% White / Caucasian13 0.5% Black or African American34 1.4% Asian96 24.9% Other race80 3.3% Two or more races599 2.2% White alone, not Hispanic / Latino288 16.7% Hispanic or LatinoMoved from abroad 27 0.1% White31 0.1% White alone, not Hispanic / Latino
Children Nativity (place of birth) in Sun Prairie
Children under 6 years - Living with two parents Both parents native 1,632 100.0% NativeBoth parents foreign-born 215 100.0% NativeOne native, one foreign-born parent 200 100.0% NativeChildren under 6 years - Living with one parent Native parent 374 100.0% NativeForeign-born parent 27 100.0% NativeChildren 6 to 17 years - Living with two parents Both parents native 3,777 99.0% Native38 1.0% Foreign-bornBoth parents foreign-born 266 64.3% Native148 35.7% Foreign-bornOne native, one foreign-born parent 278 100.0% NativeChildren 6 to 17 years - Living with one parent Native parent 1,025 93.1% Native77 6.9% Foreign-bornForeign-born parent 176 77.7% Native50 22.3% Foreign-born
Grandparents responsible for own grandchildren in Sun Prairie
Grandparents (30 to 59 years) White / Caucasian 13 77.6% Responsible for grandchildren4 22.4% Not responsible for grandchildrenWhite alone, not Hispanic / Latino 14 76.1% Responsible for grandchildren4 23.9% Not responsible for grandchildrenGrandparents (60 years and over) White / Caucasian 60 58.9% Responsible for grandchildren42 41.1% Not responsible for grandchildrenWhite alone, not Hispanic / Latino 62 57.3% Responsible for grandchildren47 42.7% Not responsible for grandchildren