Races in Sunnyside, Utah (UT) Detailed Stats
Ancestries, Foreign-born residents, place of birth

Recent posts about races in Sunnyside, Utah on our local forum with over 2,400,000 registered users:
 | Relocating to SLC - safe downtown apartments! (8 replies) |
| Especially for Visitors to Salt Lake City (32 replies) |
| UT residents bashing Utah? (71 replies) |
| Harvard/Yale Area (18 replies) |
| Relocation to SLC...??? SLC Neighborhoods... (3 replies) |
| Geographic boundaries of SLC neighborhoods? (7 replies) |
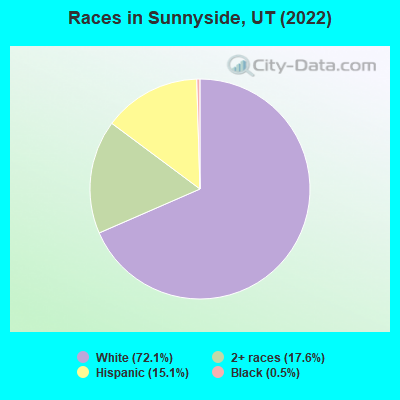
According to 2022 data, the most numerous races in Sunnyside, UT are White alone (435 residents), Hispanic (91 residents), and Two or more races (106 residents). 96.9% of Sunnyside residents speak English at home. 0.8% of Sunnyside, UT residents are foreign-born , which is 848.8% less than the foreign-born rate of 8.0% across the entire state of Utah.
Race distribution in Sunnyside

2000
2022

- 1,904,26585.3%White alone
- 201,5599.0%Hispanic
- 36,4831.6%Asian alone
- 31,3081.4%Two or more races
- 26,6631.2%American Indian alone
- 14,8060.7%Native Hawaiian and Other
Pacific Islander alone - 16,1370.7%Black alone
- 1,9480.09%Other race alone

-
- 2,557,46675.6%White alone
- 512,08615.1%Hispanic
- 119,3083.5%Two or more races
- 82,3882.4%Asian alone
- 36,9781.1%Native Hawaiian and Other
Pacific Islander alone - 34,8731.0%Black alone
- 22,8030.7%American Indian alone
- 14,8980.4%Other race alone

Income and house value in Sunnyside
- Median household income in 2022
- $63,821White non-Hispanic householders
- $124,037Some other race householders
- $41,478Hispanic or Latino race householders
- Median 2022 house value
- $126,075White Non-Hispanic householders
- $101,265Some other race householders
- $126,582Hispanic or Latino householders
Household income for White non-Hispanic householders

Household income for Some other race householders

Household income for Hispanic or Latino race householders

Median age by race in Sunnyside
- 37.5Median age for White residents
- 36.8Males
- 39.8Females
- 58.3Median age for Other race residents
- 70.1Males
- 49.2Females
- 15.2Median age for Two or more races residents
- 8.8Males
- 22.1Females
- 39.2Median age for White alone residents
- 37.4Males
- 41.9Females
- 33.7Median age for Hispanic or Latino residents
- 52.1Males
- 21.3Females
Owner/renter occupied households by race in Sunnyside
- House owners and renters - White residents
- 12873.4%Owner occupied
- 4626.6%Renter occupied
- House owners and renters - Other race residents
- 9100.0%Owner occupied
- House owners and renters - Two or more races residents
- 17100.0%Renter occupied
- House owners and renters - White alone residents
- 12172.7%Owner occupied
- 4527.3%Renter occupied
- House owners and renters - Hispanic or Latino residents
- 2389.4%Owner occupied
- 310.6%Renter occupied
Language usage in Sunnyside
- English speakers - Total
- 96.9% of residents of Sunnyside speak English at home.
- 2.0% of residents speak Spanish at home
- 872.7%Speak English very well
- 327.3%Speak English less than very well
All residents speak only English at home
- English speakers - Foreign-born
- 16.7% of residents of Sunnyside speak English at home.
- 50.0% of residents speak Spanish at home
- 3100.0%Speak English less than very well
Other race - Speak only English
| Native: | 95.4% (36) |
| Foreign-born: | 21.7% (2) |
Hispanic or Latino - Speak only English
| Native: | 97.8% (88) |
| Foreign-born: | 23.2% (1) |
Hispanic or Latino - Speak another language
| Native: | 5.2% (5) |
| Foreign-born: | 79.2% (4) |
Foreign-born residents in Sunnyside
5 residents are foreign born
| This city: | 0.8% |
| Utah: | 100.0% |


Marital status for residents in Sunnyside
Marital status - White (Caucasian) population 15 years and over
- Males
- 23.9%Never married
- 51.6%Now married
- 0.0%Separated
- 3.8%Widowed
- 20.8%Divorced
- Females
- 24.1%Never married
- 54.9%Now married
- 2.5%Separated
- 12.3%Widowed
- 6.2%Divorced
Women who gave birth in the past 12 months
| Now married: | 12.5% (1) |
| Unmarried: | 87.5% (7) |
Women who did not give birth in the past 12 months
| Now married: | 59.8% (55) |
| Unmarried: | 40.2% (37) |
Marital status - Other race population 15 years and over
- Males
- 33.3%Never married
- 58.3%Now married
- 0.0%Separated
- 0.0%Widowed
- 8.3%Divorced
- Females
- 57.1%Never married
- 14.3%Now married
- 0.0%Separated
- 28.6%Widowed
- 0.0%Divorced
Women who did not give birth in the past 12 months
| Now married: | 20.0% (2) |
| Unmarried: | 80.0% (7) |
Marital status - Two or more races population 15 years and over
- Males
- 44.4%Never married
- 55.6%Now married
- 0.0%Separated
- 0.0%Widowed
- 0.0%Divorced
- Females
- 0.0%Never married
- 100.0%Now married
- 0.0%Separated
- 0.0%Widowed
- 0.0%Divorced
Women who did not give birth in the past 12 months
| Now married: | 100.0% (14) |
| Unmarried: | 0.0% (0) |
Marital status - White alone, not Hispanic / Latino population 15 years and over
- Males
- 24.6%Never married
- 50.7%Now married
- 0.0%Separated
- 4.2%Widowed
- 20.4%Divorced
- Females
- 19.9%Never married
- 57.6%Now married
- 2.6%Separated
- 13.2%Widowed
- 6.6%Divorced
Women who gave birth in the past 12 months
| Now married: | 16.7% (1) |
| Unmarried: | 83.3% (5) |
Women who did not give birth in the past 12 months
| Now married: | 64.6% (54) |
| Unmarried: | 35.4% (30) |
Marital status - Hispanic or Latino population 15 years and over
- Males
- 24.1%Never married
- 58.6%Now married
- 0.0%Separated
- 0.0%Widowed
- 17.2%Divorced
- Females
- 72.2%Never married
- 16.7%Now married
- 0.0%Separated
- 11.1%Widowed
- 0.0%Divorced
Women who gave birth in the past 12 months
| Now married: | 0.0% (0) |
| Unmarried: | 100.0% (3) |
Women who did not give birth in the past 12 months
| Now married: | 15.4% (3) |
| Unmarried: | 84.6% (15) |
Ancestries in Sunnyside

- 2913.6%American
- 178.0%Irish
- 167.5%English
- 125.6%German
- 125.6%Italian
- 41.9%French Canadian
- 41.9%Polish
- 20.9%French
- 10.5%New Zealander
- 10.5%Welsh

Geographical mobility in Sunnyside

- Same house 1 year ago
- 37881.7%White (Caucasian)
- 4100.0%Black or African American
- 3290.5%Other race
- 14987.5%Two or more races
- 35183.0%White alone, not Hispanic / Latino
- 6976.9%Hispanic or Latino

-
- Moved within same county
- 5612.2%White / Caucasian
- 4310.2%White alone, not Hispanic / Latino
- 1314.7%Hispanic or Latino

-
- Moved within same state
- 255.4%White / Caucasian
- 515.4%Other race
- 169.5%Two or more races
- 255.9%White alone, not Hispanic / Latino
- 55.5%Hispanic or Latino

Children Nativity (place of birth) in Sunnyside
Place of birth for residents in Sunnyside
![Place of birth for the foreign-born population - Regions]()
- 5Americas
- 5Latin America
- 5Central America

Grandparents responsible for own grandchildren in Sunnyside
Zip codes: 84539.