Races in Sunnyside, Washington (WA) Detailed Stats
Data:
Races - White alone (%)
Races - White alone (% change since 2000)
Races - Black alone (%)
Races - Black alone (% change since 2000)
Races - American Indian alone (%)
Races - American Indian alone (% change since 2000)
Races - Asian alone (%)
Races - Asian alone (% change since 2000)
Races - Hispanic (%)
Races - Hispanic (% change since 2000)
Races - Native Hawaiian and Other Pacific Islander alone (%)
Races - Native Hawaiian and Other Pacific Islander alone (% change since 2000)
Races - Two or more races(%)
Races - Two or more races(% change since 2000)
Races - Other race alone (%)
Races - Other race alone (% change since 2000)
Racial diversity
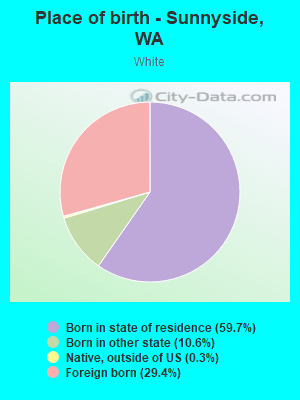
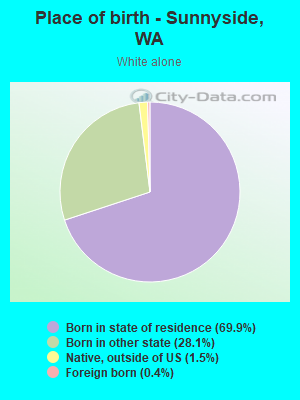
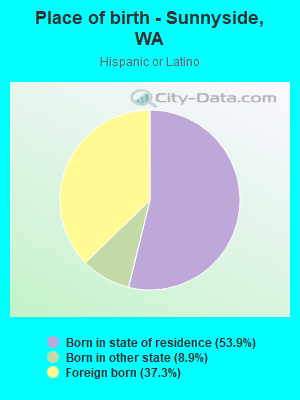
Place of birth - Born in state of residence (%)
Place of birth - Born in state of residence (%) - White
Place of birth - Born in state of residence (%) - Black or African American
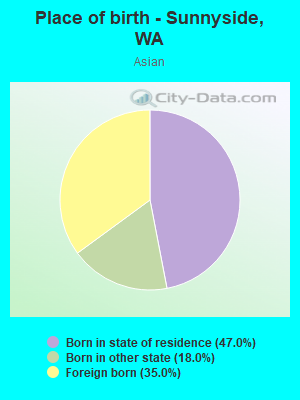
Place of birth - Born in state of residence (%) - Asian
Place of birth - Born in state of residence (%) - Hispanic or Latino
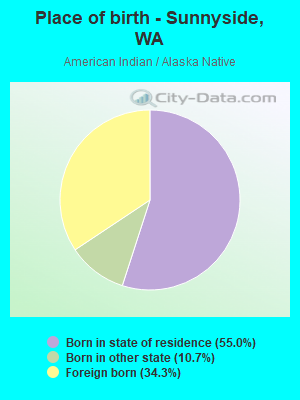
Place of birth - Born in state of residence (%) - American Indian and Alaska Native
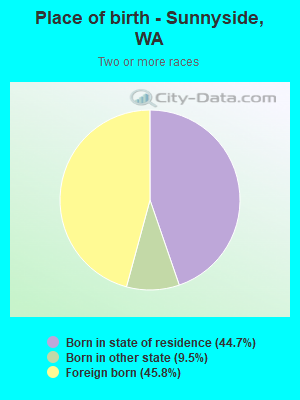
Place of birth - Born in state of residence (%) - Multirace
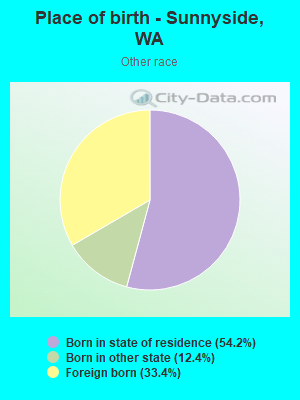
Place of birth - Born in state of residence (%) - Other Race
Place of birth - Born in other state (%)
Place of birth - Born in other state (%) - White
Place of birth - Born in other state (%) - Black or African American
Place of birth - Born in other state (%) - Asian
Place of birth - Born in other state (%) - Hispanic or Latino
Place of birth - Born in other state (%) - American Indian and Alaska Native
Place of birth - Born in other state (%) - Multirace
Place of birth - Born in other state (%) - Other Race
Place of birth - Native, outside of US (%)
Place of birth - Native, outside of US (%) - White
Place of birth - Native, outside of US (%) - Black or African American
Place of birth - Native, outside of US (%) - Asian
Place of birth - Native, outside of US (%) - Hispanic or Latino
Place of birth - Native, outside of US (%) - American Indian and Alaska Native
Place of birth - Native, outside of US (%) - Multirace
Place of birth - Native, outside of US (%) - Other Race
Place of birth - Foreign born (%)
Place of birth - Foreign born (%) - White
Place of birth - Foreign born (%) - Black or African American
Place of birth - Foreign born (%) - Asian
Place of birth - Foreign born (%) - Hispanic or Latino
Place of birth - Foreign born (%) - American Indian and Alaska Native
Place of birth - Foreign born (%) - Multirace
Place of birth - Foreign born (%) - Other Race
Residents speaking English at home (%)
Residents speaking English at home - Born in the United States (%)
Residents speaking English at home - Native, born elsewhere (%)
Residents speaking English at home - Foreign born (%)
Residents speaking Spanish at home (%)
Residents speaking Spanish at home - Born in the United States (%)
Residents speaking Spanish at home - Native, born elsewhere (%)
Residents speaking Spanish at home - Foreign born (%)
Residents speaking other language at home (%)
Residents speaking other language at home - Born in the United States (%)
Residents speaking other language at home - Native, born elsewhere (%)
Residents speaking other language at home - Foreign born (%)
Marital status - Never married (%)
Marital status - Now married (%)
Marital status - Separated (%)
Marital status - Widowed (%)
Marital status - Divorced (%)
Ancestries Reported - Arab (%)
Ancestries Reported - Czech (%)
Ancestries Reported - Danish (%)
Ancestries Reported - Dutch (%)
Ancestries Reported - English (%)
Ancestries Reported - French (%)
Ancestries Reported - French Canadian (%)
Ancestries Reported - German (%)
Ancestries Reported - Greek (%)
Ancestries Reported - Hungarian (%)
Ancestries Reported - Irish (%)
Ancestries Reported - Italian (%)
Ancestries Reported - Lithuanian (%)
Ancestries Reported - Norwegian (%)
Ancestries Reported - Polish (%)
Ancestries Reported - Portuguese (%)
Ancestries Reported - Russian (%)
Ancestries Reported - Scotch-Irish (%)
Ancestries Reported - Scottish (%)
Ancestries Reported - Slovak (%)
Ancestries Reported - Subsaharan African (%)
Ancestries Reported - Swedish (%)
Ancestries Reported - Swiss (%)
Ancestries Reported - Ukrainian (%)
Ancestries Reported - United States (%)
Ancestries Reported - Welsh (%)
Ancestries Reported - West Indian (%)
Ancestries Reported - Other (%)
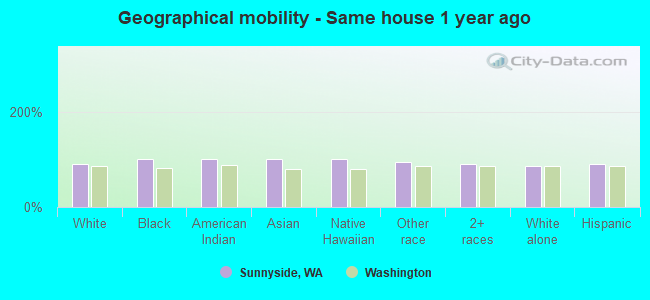
Geographical mobility - Same house 1 year ago (%)
Geographical mobility - Same house 1 year ago (%) - White
Geographical mobility - Same house 1 year ago (%) - Black or African American
Geographical mobility - Same house 1 year ago (%) - Asian
Geographical mobility - Same house 1 year ago (%) - Hispanic or Latino
Geographical mobility - Same house 1 year ago (%) - American Indian and Alaska Native
Geographical mobility - Same house 1 year ago (%) - Multirace
Geographical mobility - Same house 1 year ago (%) - Other Race
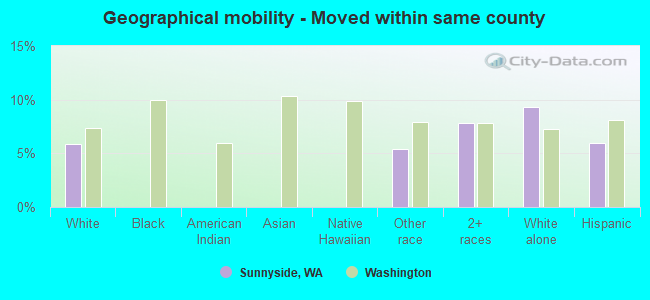
Geographical mobility - Moved within same county (%)
Geographical mobility - Moved within same county (%) - White
Geographical mobility - Moved within same county (%) - Black or African American
Geographical mobility - Moved within same county (%) - Asian
Geographical mobility - Moved within same county (%) - Hispanic or Latino
Geographical mobility - Moved within same county (%) - American Indian and Alaska Native
Geographical mobility - Moved within same county (%) - Multirace
Geographical mobility - Moved within same county (%) - Other Race
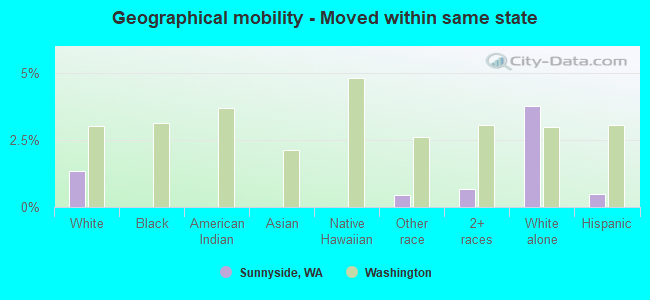
Geographical mobility - Moved from different county within same state (%)
Geographical mobility - Moved from different county within same state (%) - White
Geographical mobility - Moved from different county within same state (%) - Black or African American
Geographical mobility - Moved from different county within same state (%) - Asian
Geographical mobility - Moved from different county within same state (%) - Hispanic or Latino
Geographical mobility - Moved from different county within same state (%) - American Indian and Alaska Native
Geographical mobility - Moved from different county within same state (%) - Multirace
Geographical mobility - Moved from different county within same state (%) - Other Race
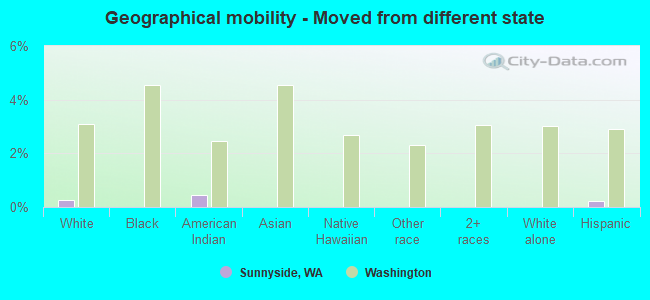
Geographical mobility - Moved from different state (%)
Geographical mobility - Moved from different state (%) - White
Geographical mobility - Moved from different state (%) - Black or African American
Geographical mobility - Moved from different state (%) - Asian
Geographical mobility - Moved from different state (%) - Hispanic or Latino
Geographical mobility - Moved from different state (%) - American Indian and Alaska Native
Geographical mobility - Moved from different state (%) - Multirace
Geographical mobility - Moved from different state (%) - Other Race
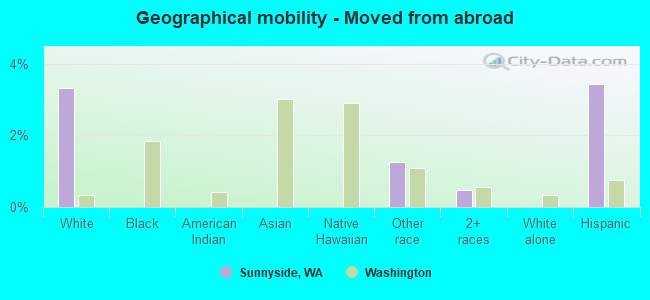
Geographical mobility - Moved from abroad (%)
Geographical mobility - Moved from abroad (%) - White
Geographical mobility - Moved from abroad (%) - Black or African American
Geographical mobility - Moved from abroad (%) - Asian
Geographical mobility - Moved from abroad (%) - Hispanic or Latino
Geographical mobility - Moved from abroad (%) - American Indian and Alaska Native
Geographical mobility - Moved from abroad (%) - Multirace
Geographical mobility - Moved from abroad (%) - Other Race
Place of birth for the foreign-born population - Ireland (%)
Place of birth for the foreign-born population - Denmark (%)
Place of birth for the foreign-born population - Norway (%)
Place of birth for the foreign-born population - Sweden (%)
Place of birth for the foreign-born population - United Kingdom (%)
Place of birth for the foreign-born population - England (%)
Place of birth for the foreign-born population - Scotland (%)
Place of birth for the foreign-born population - Other Northern Europe (%)
Place of birth for the foreign-born population - Austria (%)
Place of birth for the foreign-born population - Belgium (%)
Place of birth for the foreign-born population - France (%)
Place of birth for the foreign-born population - Germany (%)
Place of birth for the foreign-born population - Netherlands (%)
Place of birth for the foreign-born population - Switzerland (%)
Place of birth for the foreign-born population - Other Western Europe (%)
Place of birth for the foreign-born population - Greece (%)
Place of birth for the foreign-born population - Italy (%)
Place of birth for the foreign-born population - Portugal (%)
Place of birth for the foreign-born population - Spain (%)
Place of birth for the foreign-born population - Other Southern Europe (%)
Place of birth for the foreign-born population - Albania (%)
Place of birth for the foreign-born population - Belarus (%)
Place of birth for the foreign-born population - Bosnia and Herzegovina (%)
Place of birth for the foreign-born population - Bulgaria (%)
Place of birth for the foreign-born population - Croatia (%)
Place of birth for the foreign-born population - Czechoslovakia (%)
Place of birth for the foreign-born population - Hungary (%)
Place of birth for the foreign-born population - Latvia (%)
Place of birth for the foreign-born population - Lithuania (%)
Place of birth for the foreign-born population - North Macedonia (Macedonia) (%)
Place of birth for the foreign-born population - Moldova (%)
Place of birth for the foreign-born population - Poland (%)
Place of birth for the foreign-born population - Romania (%)
Place of birth for the foreign-born population - Russia (%)
Place of birth for the foreign-born population - Serbia (%)
Place of birth for the foreign-born population - Ukraine (%)
Place of birth for the foreign-born population - Other Eastern Europe (%)
Place of birth for the foreign-born population - China (%)
Place of birth for the foreign-born population - Hong Kong (%)
Place of birth for the foreign-born population - Taiwan (%)
Place of birth for the foreign-born population - Japan (%)
Place of birth for the foreign-born population - Korea (%)
Place of birth for the foreign-born population - Other Eastern Asia (%)
Place of birth for the foreign-born population - Afghanistan (%)
Place of birth for the foreign-born population - Bangladesh (%)
Place of birth for the foreign-born population - India (%)
Place of birth for the foreign-born population - Iran (%)
Place of birth for the foreign-born population - Kazakhstan (%)
Place of birth for the foreign-born population - Nepal (%)
Place of birth for the foreign-born population - Pakistan (%)
Place of birth for the foreign-born population - Sri Lanka (%)
Place of birth for the foreign-born population - Uzbekistan (%)
Place of birth for the foreign-born population - Other South Central Asia (%)
Place of birth for the foreign-born population - Burma (%)
Place of birth for the foreign-born population - Cambodia (%)
Place of birth for the foreign-born population - Indonesia (%)
Place of birth for the foreign-born population - Laos (%)
Place of birth for the foreign-born population - Malaysia (%)
Place of birth for the foreign-born population - Philippines (%)
Place of birth for the foreign-born population - Singapore (%)
Place of birth for the foreign-born population - Thailand (%)
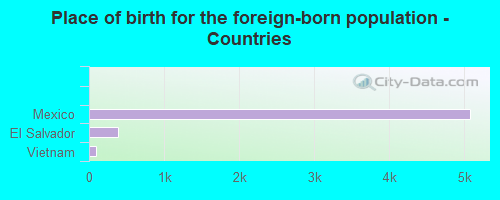
Place of birth for the foreign-born population - Vietnam (%)
Place of birth for the foreign-born population - Other South Eastern Asia (%)
Place of birth for the foreign-born population - Armenia (%)
Place of birth for the foreign-born population - Iraq (%)
Place of birth for the foreign-born population - Israel (%)
Place of birth for the foreign-born population - Jordan (%)
Place of birth for the foreign-born population - Kuwait (%)
Place of birth for the foreign-born population - Lebanon (%)
Place of birth for the foreign-born population - Saudi Arabia (%)
Place of birth for the foreign-born population - Syria (%)
Place of birth for the foreign-born population - Turkey (%)
Place of birth for the foreign-born population - Yemen (%)
Place of birth for the foreign-born population - Other Western Asia (%)
Place of birth for the foreign-born population - Eritrea (%)
Place of birth for the foreign-born population - Ethiopia (%)
Place of birth for the foreign-born population - Kenya (%)
Place of birth for the foreign-born population - Somalia (%)
Place of birth for the foreign-born population - Uganda (%)
Place of birth for the foreign-born population - Zimbabwe (%)
Place of birth for the foreign-born population - Other Eastern Africa (%)
Place of birth for the foreign-born population - Cameroon (%)
Place of birth for the foreign-born population - Congo (%)
Place of birth for the foreign-born population - Democratic Republic of Congo (Zaire) (%)
Place of birth for the foreign-born population - Other Middle Africa (%)
Place of birth for the foreign-born population - Egypt (%)
Place of birth for the foreign-born population - Morocco (%)
Place of birth for the foreign-born population - Sudan (%)
Place of birth for the foreign-born population - Other Northern Africa (%)
Place of birth for the foreign-born population - South Africa (%)
Place of birth for the foreign-born population - Other Southern Africa (%)
Place of birth for the foreign-born population - Cabo Verde (%)
Place of birth for the foreign-born population - Ghana (%)
Place of birth for the foreign-born population - Liberia (%)
Place of birth for the foreign-born population - Nigeria (%)
Place of birth for the foreign-born population - Senegal (%)
Place of birth for the foreign-born population - Sierra Leone (%)
Place of birth for the foreign-born population - Other Western Africa (%)
Place of birth for the foreign-born population - Australia (%)
Place of birth for the foreign-born population - New Zealand (%)
Place of birth for the foreign-born population - Fiji (%)
Place of birth for the foreign-born population - Micronesia (%)
Place of birth for the foreign-born population - Bahamas (%)
Place of birth for the foreign-born population - Barbados (%)
Place of birth for the foreign-born population - Cuba (%)
Place of birth for the foreign-born population - Dominica (%)
Place of birth for the foreign-born population - Dominican Republic (%)
Place of birth for the foreign-born population - Grenada (%)
Place of birth for the foreign-born population - Haiti (%)
Place of birth for the foreign-born population - Jamaica (%)
Place of birth for the foreign-born population - St. Vincent and the Grenadines (%)
Place of birth for the foreign-born population - Trinidad and Tobago (%)
Place of birth for the foreign-born population - West Indies (%)
Place of birth for the foreign-born population - Other Caribbean (%)
Place of birth for the foreign-born population - Belize (%)
Place of birth for the foreign-born population - Costa Rica (%)
Place of birth for the foreign-born population - El Salvador (%)
Place of birth for the foreign-born population - Guatemala (%)
Place of birth for the foreign-born population - Honduras (%)
Place of birth for the foreign-born population - Mexico (%)
Place of birth for the foreign-born population - Nicaragua (%)
Place of birth for the foreign-born population - Panama (%)
Place of birth for the foreign-born population - Other Central America (%)
Place of birth for the foreign-born population - Argentina (%)
Place of birth for the foreign-born population - Bolivia (%)
Place of birth for the foreign-born population - Brazil (%)
Place of birth for the foreign-born population - Chile (%)
Place of birth for the foreign-born population - Colombia (%)
Place of birth for the foreign-born population - Ecuador (%)
Place of birth for the foreign-born population - Guyana (%)
Place of birth for the foreign-born population - Peru (%)
Place of birth for the foreign-born population - Uruguay (%)
Place of birth for the foreign-born population - Venezuela (%)
Place of birth for the foreign-born population - Other South America (%)
Place of birth for the foreign-born population - Canada (%)
Place of birth for the foreign-born population - Other Northern America (%)
Place of birth for the foreign-born population - Other (%)
Latest news about races in Sunnyside, WA collected exclusively by city-data.com from local newspapers, TV, and radio stations
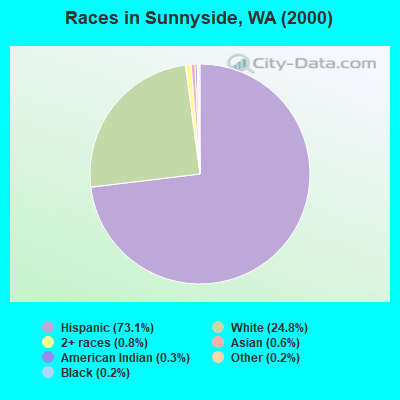
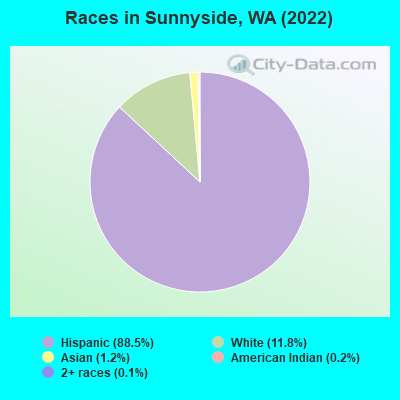
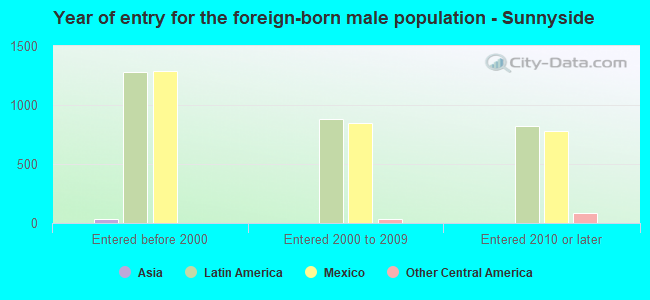
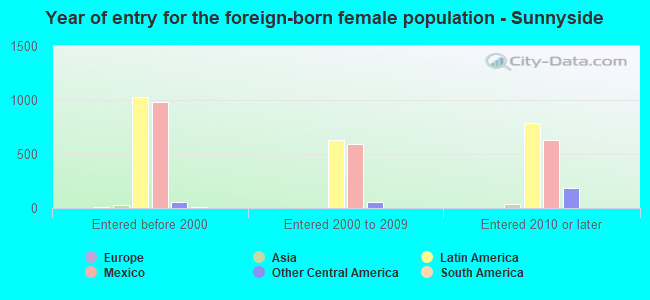
According to 2022 data, the most numerous races in Sunnyside, WA are White alone (1,937 residents), Hispanic (14,492 residents), and Asian alone (191 residents). 26.2% of Sunnyside residents speak English at home. 34.1% of Sunnyside, WA residents are foreign-born (32.3% born in Latin America), which is 55.9% greater than the foreign-born rate of 15.0% across the entire state of Washington.
Race distribution in Sunnyside
2000 2022
4,652,490 78.9% White alone 441,509 7.5% Hispanic 319,401 5.4% Asian alone 184,631 3.1% Black alone 175,926 3.0% Two or more races 85,396 1.4% American Indian alone 22,779 0.4% Native Hawaiian and Other 11,989 0.2% Other race alone
4,941,456 63.5% White alone 1,093,313 14.0% Hispanic 755,832 9.7% Asian alone 523,448 6.7% Two or more races 299,537 3.8% Black alone 69,024 0.9% American Indian alone 52,231 0.7% Native Hawaiian and Other 50,945 0.7% Other race alone
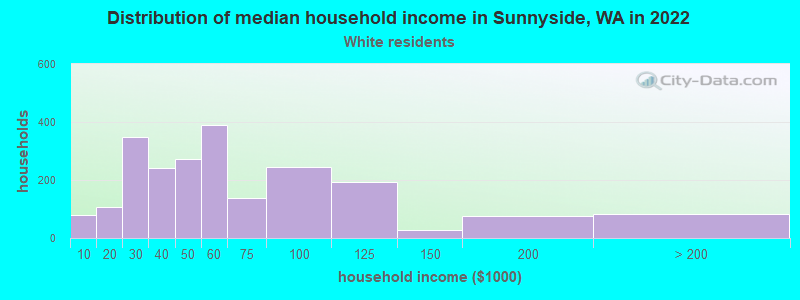
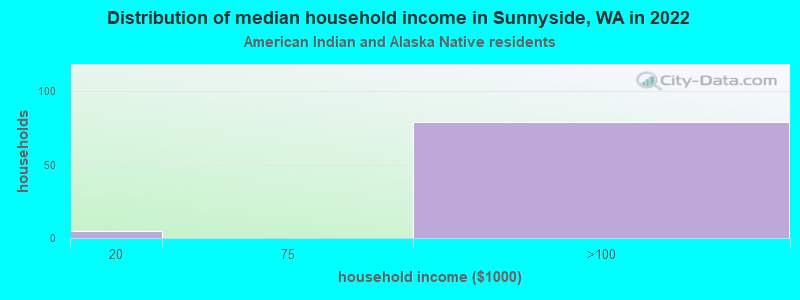
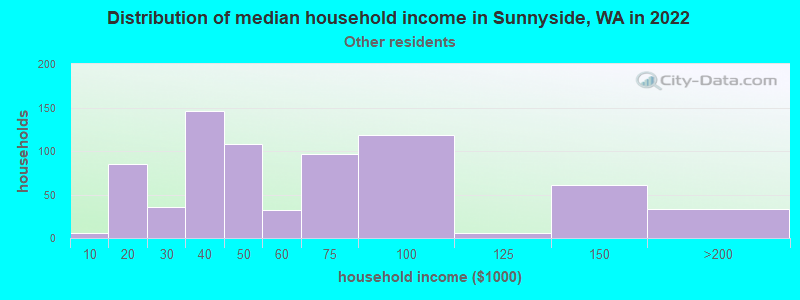
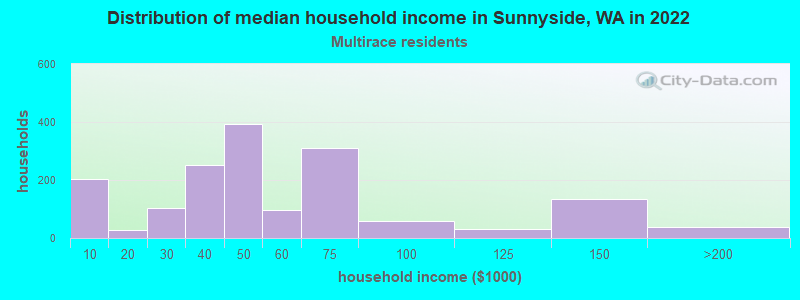
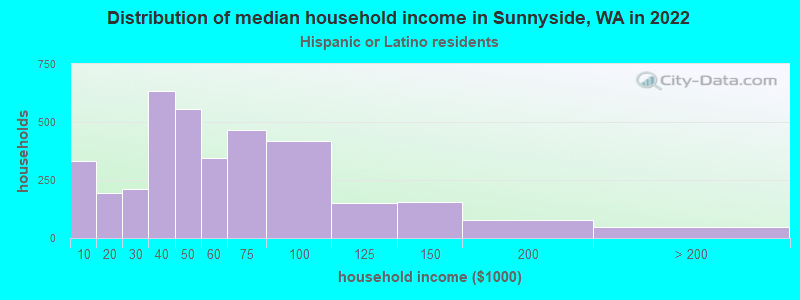
Income and house value in Sunnyside Median household income in 2022 $35,366 White non-Hispanic householders$53,054 Some other race householders$41,622 Two or more races householders$49,482 Hispanic or Latino race householdersMedian 2022 house value $268,447 White Non-Hispanic householders $298,717 Asian householders$213,748 Some other race householders$179,230 Two or more races householders$211,093 Hispanic or Latino householders
Median age by race in Sunnyside
28.5 Median age for White residents28.2 28.8 12.0 Median age for Black or African American residents-684,418,145.3 12.3 27.5 Median age for American Indian / Alaska Native residents11.1 63.5 40.1 Median age for Asian residents48.0 26.1 18.1 Median age for Native Hawaiian / Pacific Islander residents18.5 -666,666,666.0 32.5 Median age for Other race residents47.0 28.1 28.7 Median age for Two or more races residents26.5 33.6 61.5 Median age for White alone residents59.0 63.3 24.3 Median age for Hispanic or Latino residents24.4 24.4
Owner/renter occupied households by race in Sunnyside
House owners and renters - White residents 1,442 64.5% Owner occupied793 35.5% Renter occupiedHouse owners and renters - American Indian / Alaska Native residents 94 100.0% Renter occupiedHouse owners and renters - Asian residents 49 100.0% Owner occupiedHouse owners and renters - Other race residents 627 81.4% Owner occupied143 18.6% Renter occupiedHouse owners and renters - Two or more races residents 919 53.2% Owner occupied807 46.8% Renter occupiedHouse owners and renters - White alone residents 642 63.0% Owner occupied377 37.0% Renter occupiedHouse owners and renters - Hispanic or Latino residents 2,154 60.2% Owner occupied1,424 39.8% Renter occupied
Language usage in Sunnyside
English speakers - Total 26.2% of residents of Sunnyside speak English at home.
74.7% of residents speak Spanish at home 5,291 47.4% Speak English very well5,880 52.6% Speak English less than very well1.1% of residents speak other language at home 38 22.9% Speak English very well128 77.1% Speak English less than very well
English speakers - Born in the United States 41.8% of residents of Sunnyside speak English at home.
62.7% of residents speak Spanish at home 973 90.8% Speak English very well99 9.2% Speak English less than very well1.7% of residents speak other language at home 29 100.0% Speak English very well
English speakers - Native, born elsewhere 71.4% of residents of Sunnyside speak English at home.
English speakers - Foreign-born 2.4% of residents of Sunnyside speak English at home.
96.7% of residents speak Spanish at home 697 13.7% Speak English very well4,400 86.3% Speak English less than very well1.4% of residents speak other language at home 72 100.0% Speak English less than very well
White (Caucasian) - Speak only English Native:
51.5% (2,601)Foreign-born:
2.5% (55)
White (Caucasian) - Speak another language Native:
27.2% (1,374)Foreign-born:
93.9% (2,073)
American Indian / Alaska Native - Speak another language Native:
100.0% (192)Foreign-born:
53.8% (53)
Asian - Speak another language Native:
80.0% (75)Foreign-born:
97.7% (74)
Other race - Speak only English Native:
27.2% (458)Foreign-born:
3.9% (40)
Other race - Speak another language Native:
70.5% (1,185)Foreign-born:
95.8% (972)
Two or more races - Speak only English Native:
19.7% (573)Foreign-born:
1.2% (34)
Two or more races - Speak another language Native:
88.3% (2,575)Foreign-born:
98.2% (2,703)
White alone - Speak only English Native:
96.5% (1,849)Foreign-born:
87.2% (7)
Hispanic or Latino - Speak only English Native:
24.0% (1,881)Foreign-born:
2.7% (143)
Hispanic or Latino - Speak another language Native:
76.4% (5,997)Foreign-born:
96.3% (5,039)
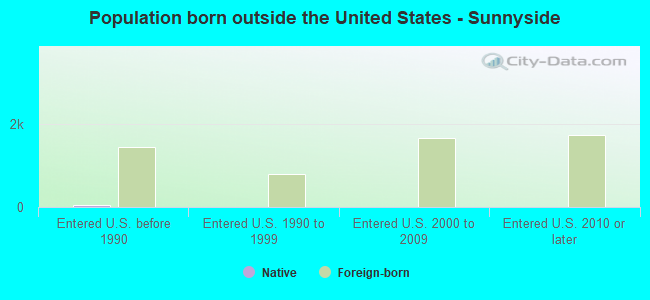
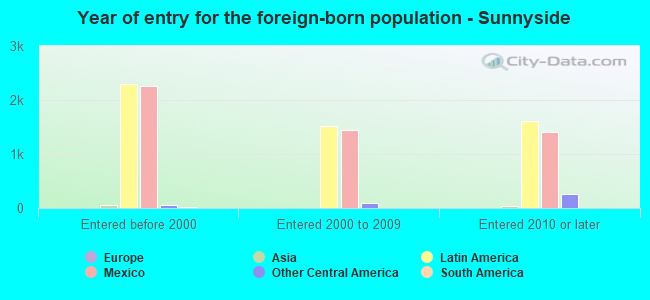
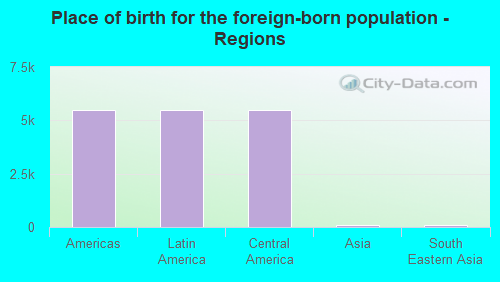
Foreign-born residents in Sunnyside 5,579 residents are foreign born (32.3% Latin America ).
This city:
34.1%Washington:
14.9%
Marital status for residents in Sunnyside Marital status - White (Caucasian) population 15 years and over
Males 37.4% Never married51.8% Now married0.7% Separated5.8% Widowed4.3% DivorcedFemales 26.5% Never married40.9% Now married4.1% Separated13.3% Widowed15.2% DivorcedWomen who gave birth in the past 12 months Now married:
63.8% (92)Unmarried:
36.2% (52)
Women who did not give birth in the past 12 months Now married:
46.9% (625)Unmarried:
53.1% (707)
Marital status - American Indian / Alaska Native population 15 years and over
Males 92.3% Never married1.1% Now married6.6% Separated0.0% Widowed0.0% DivorcedFemales 37.5% Never married62.5% Now married0.0% Separated0.0% Widowed0.0% DivorcedWomen who did not give birth in the past 12 months Now married:
0.0% (0)Unmarried:
100.0% (29)
Marital status - Asian population 15 years and over
Males 0.0% Never married100.0% Now married0.0% Separated0.0% Widowed0.0% DivorcedFemales 0.0% Never married100.0% Now married0.0% Separated0.0% Widowed0.0% DivorcedWomen who did not give birth in the past 12 months Now married:
100.0% (32)Unmarried:
0.0% (0)
Marital status - Other race population 15 years and over
Males 33.6% Never married59.9% Now married0.0% Separated6.4% Widowed0.1% DivorcedFemales 33.5% Never married40.6% Now married10.2% Separated12.2% Widowed3.4% DivorcedWomen who did not give birth in the past 12 months Now married:
45.4% (351)Unmarried:
54.6% (422)
Marital status - Two or more races population 15 years and over
Males 42.0% Never married45.8% Now married0.5% Separated5.0% Widowed6.7% DivorcedFemales 36.9% Never married47.6% Now married4.2% Separated7.4% Widowed3.8% DivorcedWomen who did not give birth in the past 12 months Now married:
44.4% (527)Unmarried:
55.6% (661)
Marital status - White alone, not Hispanic / Latino population 15 years and over
Males 19.7% Never married44.0% Now married2.5% Separated18.9% Widowed14.8% DivorcedFemales 5.3% Never married39.6% Now married4.5% Separated25.5% Widowed25.1% DivorcedWomen who gave birth in the past 12 months Now married:
100.0% (9)Unmarried:
0.0% (0)
Women who did not give birth in the past 12 months Now married:
81.1% (150)Unmarried:
18.9% (35)
Marital status - Hispanic or Latino population 15 years and over
Males 42.4% Never married52.3% Now married0.2% Separated3.1% Widowed1.9% DivorcedFemales 36.2% Never married43.2% Now married5.6% Separated8.4% Widowed6.6% DivorcedWomen who gave birth in the past 12 months Now married:
62.0% (114)Unmarried:
38.0% (70)
Women who did not give birth in the past 12 months Now married:
43.6% (1,361)Unmarried:
56.4% (1,758)
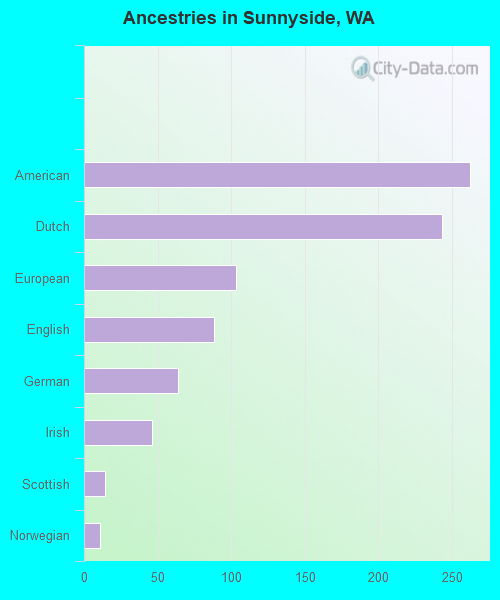
Ancestries in Sunnyside
262 1.9% American243 1.7% Dutch103 0.7% European88 0.6% English64 0.5% German46 0.3% Irish14 0.1% Scottish11 0.08% Norwegian
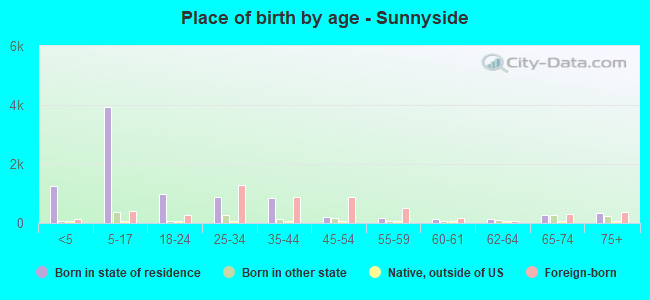
Children Nativity (place of birth) in Sunnyside
Children under 6 years - Living with two parents Both parents native 274 100.0% NativeBoth parents foreign-born 460 84.9% Native82 15.1% Foreign-bornOne native, one foreign-born parent 227 100.0% NativeChildren under 6 years - Living with one parent Native parent 272 84.0% Native52 16.0% Foreign-bornForeign-born parent 263 84.8% Native47 15.2% Foreign-bornChildren 6 to 17 years - Living with two parents Both parents native 434 96.0% Native18 4.0% Foreign-bornBoth parents foreign-born 1,273 82.8% Native264 17.2% Foreign-bornOne native, one foreign-born parent 799 100.0% NativeChildren 6 to 17 years - Living with one parent Native parent 775 100.0% NativeForeign-born parent 713 53.7% Native616 46.3% Foreign-born
Grandparents responsible for own grandchildren in Sunnyside
Grandparents (30 to 59 years) White / Caucasian 119 100.0% Not responsible for grandchildrenAsian 34 100.0% Not responsible for grandchildrenOther race 22 100.0% Responsible for grandchildrenWhite alone, not Hispanic / Latino 57 100.0% Not responsible for grandchildrenHispanic or Latino 21 17.2% Responsible for grandchildren99 82.8% Not responsible for grandchildren
Grandparents (60 years and over) White / Caucasian 4 100.0% Not responsible for grandchildrenAsian 29 100.0% Not responsible for grandchildrenOther race 119 100.0% Not responsible for grandchildrenWhite alone, not Hispanic / Latino 6 100.0% Not responsible for grandchildrenHispanic or Latino 151 100.0% Not responsible for grandchildren