Races in Superior, Wisconsin (WI) Detailed Stats
Data:
Races - White alone (%)
Races - White alone (% change since 2000)
Races - Black alone (%)
Races - Black alone (% change since 2000)
Races - American Indian alone (%)
Races - American Indian alone (% change since 2000)
Races - Asian alone (%)
Races - Asian alone (% change since 2000)
Races - Hispanic (%)
Races - Hispanic (% change since 2000)
Races - Native Hawaiian and Other Pacific Islander alone (%)
Races - Native Hawaiian and Other Pacific Islander alone (% change since 2000)
Races - Two or more races(%)
Races - Two or more races(% change since 2000)
Races - Other race alone (%)
Races - Other race alone (% change since 2000)
Racial diversity
Place of birth - Born in state of residence (%)
Place of birth - Born in state of residence (%) - White
Place of birth - Born in state of residence (%) - Black or African American
Place of birth - Born in state of residence (%) - Asian
Place of birth - Born in state of residence (%) - Hispanic or Latino
Place of birth - Born in state of residence (%) - American Indian and Alaska Native
Place of birth - Born in state of residence (%) - Multirace
Place of birth - Born in state of residence (%) - Other Race
Place of birth - Born in other state (%)
Place of birth - Born in other state (%) - White
Place of birth - Born in other state (%) - Black or African American
Place of birth - Born in other state (%) - Asian
Place of birth - Born in other state (%) - Hispanic or Latino
Place of birth - Born in other state (%) - American Indian and Alaska Native
Place of birth - Born in other state (%) - Multirace
Place of birth - Born in other state (%) - Other Race
Place of birth - Native, outside of US (%)
Place of birth - Native, outside of US (%) - White
Place of birth - Native, outside of US (%) - Black or African American
Place of birth - Native, outside of US (%) - Asian
Place of birth - Native, outside of US (%) - Hispanic or Latino
Place of birth - Native, outside of US (%) - American Indian and Alaska Native
Place of birth - Native, outside of US (%) - Multirace
Place of birth - Native, outside of US (%) - Other Race
Place of birth - Foreign born (%)
Place of birth - Foreign born (%) - White
Place of birth - Foreign born (%) - Black or African American
Place of birth - Foreign born (%) - Asian
Place of birth - Foreign born (%) - Hispanic or Latino
Place of birth - Foreign born (%) - American Indian and Alaska Native
Place of birth - Foreign born (%) - Multirace
Place of birth - Foreign born (%) - Other Race
Residents speaking English at home (%)
Residents speaking English at home - Born in the United States (%)
Residents speaking English at home - Native, born elsewhere (%)
Residents speaking English at home - Foreign born (%)
Residents speaking Spanish at home (%)
Residents speaking Spanish at home - Born in the United States (%)
Residents speaking Spanish at home - Native, born elsewhere (%)
Residents speaking Spanish at home - Foreign born (%)
Residents speaking other language at home (%)
Residents speaking other language at home - Born in the United States (%)
Residents speaking other language at home - Native, born elsewhere (%)
Residents speaking other language at home - Foreign born (%)
Marital status - Never married (%)
Marital status - Now married (%)
Marital status - Separated (%)
Marital status - Widowed (%)
Marital status - Divorced (%)
Ancestries Reported - Arab (%)
Ancestries Reported - Czech (%)
Ancestries Reported - Danish (%)
Ancestries Reported - Dutch (%)
Ancestries Reported - English (%)
Ancestries Reported - French (%)
Ancestries Reported - French Canadian (%)
Ancestries Reported - German (%)
Ancestries Reported - Greek (%)
Ancestries Reported - Hungarian (%)
Ancestries Reported - Irish (%)
Ancestries Reported - Italian (%)
Ancestries Reported - Lithuanian (%)
Ancestries Reported - Norwegian (%)
Ancestries Reported - Polish (%)
Ancestries Reported - Portuguese (%)
Ancestries Reported - Russian (%)
Ancestries Reported - Scotch-Irish (%)
Ancestries Reported - Scottish (%)
Ancestries Reported - Slovak (%)
Ancestries Reported - Subsaharan African (%)
Ancestries Reported - Swedish (%)
Ancestries Reported - Swiss (%)
Ancestries Reported - Ukrainian (%)
Ancestries Reported - United States (%)
Ancestries Reported - Welsh (%)
Ancestries Reported - West Indian (%)
Ancestries Reported - Other (%)
Geographical mobility - Same house 1 year ago (%)
Geographical mobility - Same house 1 year ago (%) - White
Geographical mobility - Same house 1 year ago (%) - Black or African American
Geographical mobility - Same house 1 year ago (%) - Asian
Geographical mobility - Same house 1 year ago (%) - Hispanic or Latino
Geographical mobility - Same house 1 year ago (%) - American Indian and Alaska Native
Geographical mobility - Same house 1 year ago (%) - Multirace
Geographical mobility - Same house 1 year ago (%) - Other Race
Geographical mobility - Moved within same county (%)
Geographical mobility - Moved within same county (%) - White
Geographical mobility - Moved within same county (%) - Black or African American
Geographical mobility - Moved within same county (%) - Asian
Geographical mobility - Moved within same county (%) - Hispanic or Latino
Geographical mobility - Moved within same county (%) - American Indian and Alaska Native
Geographical mobility - Moved within same county (%) - Multirace
Geographical mobility - Moved within same county (%) - Other Race
Geographical mobility - Moved from different county within same state (%)
Geographical mobility - Moved from different county within same state (%) - White
Geographical mobility - Moved from different county within same state (%) - Black or African American
Geographical mobility - Moved from different county within same state (%) - Asian
Geographical mobility - Moved from different county within same state (%) - Hispanic or Latino
Geographical mobility - Moved from different county within same state (%) - American Indian and Alaska Native
Geographical mobility - Moved from different county within same state (%) - Multirace
Geographical mobility - Moved from different county within same state (%) - Other Race
Geographical mobility - Moved from different state (%)
Geographical mobility - Moved from different state (%) - White
Geographical mobility - Moved from different state (%) - Black or African American
Geographical mobility - Moved from different state (%) - Asian
Geographical mobility - Moved from different state (%) - Hispanic or Latino
Geographical mobility - Moved from different state (%) - American Indian and Alaska Native
Geographical mobility - Moved from different state (%) - Multirace
Geographical mobility - Moved from different state (%) - Other Race
Geographical mobility - Moved from abroad (%)
Geographical mobility - Moved from abroad (%) - White
Geographical mobility - Moved from abroad (%) - Black or African American
Geographical mobility - Moved from abroad (%) - Asian
Geographical mobility - Moved from abroad (%) - Hispanic or Latino
Geographical mobility - Moved from abroad (%) - American Indian and Alaska Native
Geographical mobility - Moved from abroad (%) - Multirace
Geographical mobility - Moved from abroad (%) - Other Race
Place of birth for the foreign-born population - Ireland (%)
Place of birth for the foreign-born population - Denmark (%)
Place of birth for the foreign-born population - Norway (%)
Place of birth for the foreign-born population - Sweden (%)
Place of birth for the foreign-born population - United Kingdom (%)
Place of birth for the foreign-born population - England (%)
Place of birth for the foreign-born population - Scotland (%)
Place of birth for the foreign-born population - Other Northern Europe (%)
Place of birth for the foreign-born population - Austria (%)
Place of birth for the foreign-born population - Belgium (%)
Place of birth for the foreign-born population - France (%)
Place of birth for the foreign-born population - Germany (%)
Place of birth for the foreign-born population - Netherlands (%)
Place of birth for the foreign-born population - Switzerland (%)
Place of birth for the foreign-born population - Other Western Europe (%)
Place of birth for the foreign-born population - Greece (%)
Place of birth for the foreign-born population - Italy (%)
Place of birth for the foreign-born population - Portugal (%)
Place of birth for the foreign-born population - Spain (%)
Place of birth for the foreign-born population - Other Southern Europe (%)
Place of birth for the foreign-born population - Albania (%)
Place of birth for the foreign-born population - Belarus (%)
Place of birth for the foreign-born population - Bosnia and Herzegovina (%)
Place of birth for the foreign-born population - Bulgaria (%)
Place of birth for the foreign-born population - Croatia (%)
Place of birth for the foreign-born population - Czechoslovakia (%)
Place of birth for the foreign-born population - Hungary (%)
Place of birth for the foreign-born population - Latvia (%)
Place of birth for the foreign-born population - Lithuania (%)
Place of birth for the foreign-born population - North Macedonia (Macedonia) (%)
Place of birth for the foreign-born population - Moldova (%)
Place of birth for the foreign-born population - Poland (%)
Place of birth for the foreign-born population - Romania (%)
Place of birth for the foreign-born population - Russia (%)
Place of birth for the foreign-born population - Serbia (%)
Place of birth for the foreign-born population - Ukraine (%)
Place of birth for the foreign-born population - Other Eastern Europe (%)
Place of birth for the foreign-born population - China (%)
Place of birth for the foreign-born population - Hong Kong (%)
Place of birth for the foreign-born population - Taiwan (%)
Place of birth for the foreign-born population - Japan (%)
Place of birth for the foreign-born population - Korea (%)
Place of birth for the foreign-born population - Other Eastern Asia (%)
Place of birth for the foreign-born population - Afghanistan (%)
Place of birth for the foreign-born population - Bangladesh (%)
Place of birth for the foreign-born population - India (%)
Place of birth for the foreign-born population - Iran (%)
Place of birth for the foreign-born population - Kazakhstan (%)
Place of birth for the foreign-born population - Nepal (%)
Place of birth for the foreign-born population - Pakistan (%)
Place of birth for the foreign-born population - Sri Lanka (%)
Place of birth for the foreign-born population - Uzbekistan (%)
Place of birth for the foreign-born population - Other South Central Asia (%)
Place of birth for the foreign-born population - Burma (%)
Place of birth for the foreign-born population - Cambodia (%)
Place of birth for the foreign-born population - Indonesia (%)
Place of birth for the foreign-born population - Laos (%)
Place of birth for the foreign-born population - Malaysia (%)
Place of birth for the foreign-born population - Philippines (%)
Place of birth for the foreign-born population - Singapore (%)
Place of birth for the foreign-born population - Thailand (%)
Place of birth for the foreign-born population - Vietnam (%)
Place of birth for the foreign-born population - Other South Eastern Asia (%)
Place of birth for the foreign-born population - Armenia (%)
Place of birth for the foreign-born population - Iraq (%)
Place of birth for the foreign-born population - Israel (%)
Place of birth for the foreign-born population - Jordan (%)
Place of birth for the foreign-born population - Kuwait (%)
Place of birth for the foreign-born population - Lebanon (%)
Place of birth for the foreign-born population - Saudi Arabia (%)
Place of birth for the foreign-born population - Syria (%)
Place of birth for the foreign-born population - Turkey (%)
Place of birth for the foreign-born population - Yemen (%)
Place of birth for the foreign-born population - Other Western Asia (%)
Place of birth for the foreign-born population - Eritrea (%)
Place of birth for the foreign-born population - Ethiopia (%)
Place of birth for the foreign-born population - Kenya (%)
Place of birth for the foreign-born population - Somalia (%)
Place of birth for the foreign-born population - Uganda (%)
Place of birth for the foreign-born population - Zimbabwe (%)
Place of birth for the foreign-born population - Other Eastern Africa (%)
Place of birth for the foreign-born population - Cameroon (%)
Place of birth for the foreign-born population - Congo (%)
Place of birth for the foreign-born population - Democratic Republic of Congo (Zaire) (%)
Place of birth for the foreign-born population - Other Middle Africa (%)
Place of birth for the foreign-born population - Egypt (%)
Place of birth for the foreign-born population - Morocco (%)
Place of birth for the foreign-born population - Sudan (%)
Place of birth for the foreign-born population - Other Northern Africa (%)
Place of birth for the foreign-born population - South Africa (%)
Place of birth for the foreign-born population - Other Southern Africa (%)
Place of birth for the foreign-born population - Cabo Verde (%)
Place of birth for the foreign-born population - Ghana (%)
Place of birth for the foreign-born population - Liberia (%)
Place of birth for the foreign-born population - Nigeria (%)
Place of birth for the foreign-born population - Senegal (%)
Place of birth for the foreign-born population - Sierra Leone (%)
Place of birth for the foreign-born population - Other Western Africa (%)
Place of birth for the foreign-born population - Australia (%)
Place of birth for the foreign-born population - New Zealand (%)
Place of birth for the foreign-born population - Fiji (%)
Place of birth for the foreign-born population - Micronesia (%)
Place of birth for the foreign-born population - Bahamas (%)
Place of birth for the foreign-born population - Barbados (%)
Place of birth for the foreign-born population - Cuba (%)
Place of birth for the foreign-born population - Dominica (%)
Place of birth for the foreign-born population - Dominican Republic (%)
Place of birth for the foreign-born population - Grenada (%)
Place of birth for the foreign-born population - Haiti (%)
Place of birth for the foreign-born population - Jamaica (%)
Place of birth for the foreign-born population - St. Vincent and the Grenadines (%)
Place of birth for the foreign-born population - Trinidad and Tobago (%)
Place of birth for the foreign-born population - West Indies (%)
Place of birth for the foreign-born population - Other Caribbean (%)
Place of birth for the foreign-born population - Belize (%)
Place of birth for the foreign-born population - Costa Rica (%)
Place of birth for the foreign-born population - El Salvador (%)
Place of birth for the foreign-born population - Guatemala (%)
Place of birth for the foreign-born population - Honduras (%)
Place of birth for the foreign-born population - Mexico (%)
Place of birth for the foreign-born population - Nicaragua (%)
Place of birth for the foreign-born population - Panama (%)
Place of birth for the foreign-born population - Other Central America (%)
Place of birth for the foreign-born population - Argentina (%)
Place of birth for the foreign-born population - Bolivia (%)
Place of birth for the foreign-born population - Brazil (%)
Place of birth for the foreign-born population - Chile (%)
Place of birth for the foreign-born population - Colombia (%)
Place of birth for the foreign-born population - Ecuador (%)
Place of birth for the foreign-born population - Guyana (%)
Place of birth for the foreign-born population - Peru (%)
Place of birth for the foreign-born population - Uruguay (%)
Place of birth for the foreign-born population - Venezuela (%)
Place of birth for the foreign-born population - Other South America (%)
Place of birth for the foreign-born population - Canada (%)
Place of birth for the foreign-born population - Other Northern America (%)
Place of birth for the foreign-born population - Other (%)
Latest news about races in Superior, WI collected exclusively by city-data.com from local newspapers, TV, and radio stations
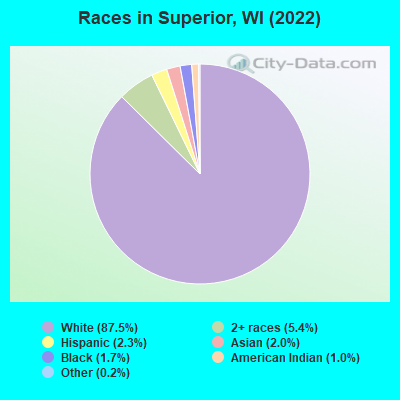
According to 2022 data, the most numerous races in Superior, WI are White alone (23,285 residents), Hispanic (618 residents), and Black alone (454 residents). 96.3% of Superior residents speak English at home. 2.9% of Superior, WI residents are foreign-born (1.5% born in Asia, 0.7% born in Europe, 0.3% born in Latin America), which is 72.6% less than the foreign-born rate of 5.0% across the entire state of Wisconsin.
Race distribution in Superior
2000 2022
4,681,630 87.3% White alone 300,245 5.6% Black alone 192,921 3.6% Hispanic 87,995 1.6% Asian alone 51,921 1.0% Two or more races 43,980 0.8% American Indian alone 3,637 0.07% Other race alone 1,346 0.03% Native Hawaiian and Other
4,654,031 79.0% White alone 447,022 7.6% Hispanic 345,678 5.9% Black alone 217,532 3.7% Two or more races 172,242 2.9% Asian alone 33,762 0.6% American Indian alone 19,680 0.3% Other race alone 2,592 0.04% Native Hawaiian and Other
Income and house value in Superior Median household income in 2022 $53,950 White non-Hispanic householders$62,621 Black householders$34,230 American Indian and Alaska Native householders$86,783 Asian householders$45,634 Two or more races householders$67,923 Hispanic or Latino race householdersMedian 2022 house value $174,819 White Non-Hispanic householders$298,893 Black or African American householders$158,612 American Indian or Alaska Native householders $199,262 Asian householders$172,693 Some other race householders$287,734 Two or more races householders$277,638 Hispanic or Latino householders
Median age by race in Superior
40.7 Median age for White residents39.4 41.4 24.4 Median age for Black or African American residents31.1 23.2 54.5 Median age for American Indian / Alaska Native residents55.2 54.9 30.4 Median age for Asian residents33.4 30.1 -825,688,072.6 Median age for Native Hawaiian / Pacific Islander residents-862,745,097.2 -732,444,443.7 55.7 Median age for Other race residents55.7 21.2 31.6 Median age for Two or more races residents31.8 29.7 40.6 Median age for White alone residents39.4 41.4 21.7 Median age for Hispanic or Latino residents23.5 21.3
Owner/renter occupied households by race in Superior
House owners and renters - White residents 6,536 59.8% Owner occupied4,392 40.2% Renter occupiedHouse owners and renters - Black or African American residents 33 52.0% Owner occupied31 48.0% Renter occupiedHouse owners and renters - American Indian / Alaska Native residents 51 46.1% Owner occupied60 53.9% Renter occupiedHouse owners and renters - Asian residents 30 25.7% Owner occupied88 74.3% Renter occupiedHouse owners and renters - Other race residents 50 100.0% Owner occupiedHouse owners and renters - Two or more races residents 408 60.4% Owner occupied267 39.6% Renter occupiedHouse owners and renters - White alone residents 6,520 59.6% Owner occupied4,425 40.4% Renter occupiedHouse owners and renters - Hispanic or Latino residents 61 43.8% Owner occupied78 56.2% Renter occupied
Language usage in Superior
English speakers - Total 96.3% of residents of Superior speak English at home.
1.0% of residents speak Spanish at home 172 65.2% Speak English very well92 34.8% Speak English less than very well2.7% of residents speak other language at home 341 50.1% Speak English very well340 49.9% Speak English less than very well
English speakers - Born in the United States 98.3% of residents of Superior speak English at home.
0.7% of residents speak Spanish at home 74 67.9% Speak English very well35 32.1% Speak English less than very well0.9% of residents speak other language at home 82 62.6% Speak English very well49 37.4% Speak English less than very well
All residents speak only English at home
English speakers - Foreign-born 31.2% of residents of Superior speak English at home.
11.3% of residents speak Spanish at home 29 33.3% Speak English very well58 66.7% Speak English less than very well56.7% of residents speak other language at home 181 41.3% Speak English very well257 58.7% Speak English less than very well
White (Caucasian) - Speak only English Native:
99.3% (22,047)Foreign-born:
65.1% (103)
White (Caucasian) - Speak another language Native:
1.0% (219)Foreign-born:
42.0% (66)
American Indian / Alaska Native - Speak only English Native:
88.7% (289)Foreign-born:
55.9% (40)
American Indian / Alaska Native - Speak another language Native:
9.4% (31)Foreign-born:
42.1% (30)
Asian - Speak only English Native:
31.5% (43)Foreign-born:
22.4% (86)
Asian - Speak another language Native:
65.4% (89)Foreign-born:
77.1% (295)
Other race - Speak another language Native:
7.0% (4)Foreign-born:
98.8% (7)
Two or more races - Speak only English Native:
90.5% (1,447)Foreign-born:
50.4% (20)
Two or more races - Speak another language Native:
2.9% (47)Foreign-born:
32.9% (13)
White alone - Speak only English Native:
99.0% (21,900)Foreign-born:
60.8% (113)
White alone - Speak another language Native:
1.0% (232)Foreign-born:
39.2% (73)
Hispanic or Latino - Speak another language Native:
11.3% (56)Foreign-born:
100.0% (72)
Foreign-born residents in Superior 771 residents are foreign born (1.5% Asia , 0.7% Europe , 0.3% Latin America ).
This city:
2.9%Wisconsin:
5.0%
Marital status for residents in Superior Marital status - White (Caucasian) population 15 years and over
Males 38.2% Never married43.1% Now married1.4% Separated3.8% Widowed13.5% DivorcedFemales 31.5% Never married37.6% Now married2.5% Separated12.3% Widowed16.1% DivorcedWomen who gave birth in the past 12 months Now married:
72.1% (200)Unmarried:
27.9% (77)
Women who did not give birth in the past 12 months Now married:
35.8% (1,987)Unmarried:
64.2% (3,563)
Marital status - Black or African American population 15 years and over
Males 68.6% Never married28.3% Now married0.0% Separated0.0% Widowed3.1% DivorcedFemales 47.0% Never married29.3% Now married5.5% Separated0.0% Widowed18.3% DivorcedWomen who gave birth in the past 12 months Now married:
96.4% (1)Unmarried:
0.0% (0)
Women who did not give birth in the past 12 months Now married:
33.1% (51)Unmarried:
66.9% (103)
Marital status - American Indian / Alaska Native population 15 years and over
Males 51.0% Never married14.8% Now married6.2% Separated21.0% Widowed7.0% DivorcedFemales 29.4% Never married14.7% Now married0.0% Separated28.4% Widowed27.5% DivorcedWomen who did not give birth in the past 12 months Now married:
0.0% (0)Unmarried:
100.0% (30)
Marital status - Asian population 15 years and over
Males 60.6% Never married23.6% Now married0.0% Separated0.0% Widowed15.9% DivorcedFemales 68.4% Never married31.6% Now married0.0% Separated0.0% Widowed0.0% DivorcedWomen who gave birth in the past 12 months Now married:
100.0% (18)Unmarried:
0.0% (0)
Women who did not give birth in the past 12 months Now married:
17.3% (35)Unmarried:
82.7% (165)
Marital status - Other race population 15 years and over
Males 9.8% Never married90.2% Now married0.0% Separated0.0% Widowed0.0% DivorcedFemales 60.0% Never married25.0% Now married0.0% Separated0.0% Widowed15.0% DivorcedWomen who did not give birth in the past 12 months Now married:
0.0% (0)Unmarried:
100.0% (11)
Marital status - Two or more races population 15 years and over
Males 49.2% Never married23.1% Now married0.0% Separated2.8% Widowed24.9% DivorcedFemales 54.7% Never married29.1% Now married0.0% Separated2.9% Widowed13.3% DivorcedWomen who gave birth in the past 12 months Now married:
100.0% (15)Unmarried:
0.0% (0)
Women who did not give birth in the past 12 months Now married:
25.4% (147)Unmarried:
74.6% (433)
Marital status - White alone, not Hispanic / Latino population 15 years and over
Males 38.3% Never married42.9% Now married1.3% Separated3.8% Widowed13.6% DivorcedFemales 31.1% Never married37.8% Now married2.5% Separated12.4% Widowed16.2% DivorcedWomen who gave birth in the past 12 months Now married:
72.1% (204)Unmarried:
27.9% (79)
Women who did not give birth in the past 12 months Now married:
36.1% (1,992)Unmarried:
63.9% (3,529)
Marital status - Hispanic or Latino population 15 years and over
Males 50.7% Never married28.1% Now married10.3% Separated10.8% Widowed0.0% DivorcedFemales 55.3% Never married29.3% Now married0.0% Separated4.5% Widowed10.9% DivorcedWomen who gave birth in the past 12 months Now married:
100.0% (10)Unmarried:
0.0% (0)
Women who did not give birth in the past 12 months Now married:
18.3% (36)Unmarried:
81.7% (162)
Ancestries in Superior
1,123 12.7% German789 8.9% Polish675 7.6% Irish662 7.5% American646 7.3% Norwegian475 5.4% Finnish406 4.6% Swedish401 4.5% European370 4.2% Scandinavian310 3.5% English228 2.6% Italian151 1.7% French Canadian143 1.6% French67 0.8% Romanian57 0.6% Scotch-Irish37 0.4% Northern European33 0.4% Dutch27 0.3% Scottish26 0.3% Lithuanian25 0.3% Belgian24 0.3% Slovak21 0.2% Slovene19 0.2% Greek17 0.2% Croatian17 0.2% Jamaican15 0.2% Australian14 0.2% Ukrainian10 0.1% African9 0.1% Russian8 0.09% Moroccan6 0.07% Czech6 0.07% Nigerian6 0.07% Swiss5 0.06% Eastern European5 0.06% Hungarian4 0.05% Icelander4 0.05% Serbian2 0.02% Ghanaian1 0.01% Armenian
Geographical mobility in Superior Same house 1 year ago 19,543 84.8% White (Caucasian)359 78.8% Black or African American361 87.0% American Indian / Alaska Native403 77.1% Asian46 73.0% Other race1,608 86.2% Two or more races19,569 84.8% White alone, not Hispanic / Latino439 71.7% Hispanic or LatinoMoved within same county 2,012 8.7% White / Caucasian64 14.0% Black or African American56 13.4% American Indian / Alaska Native50 9.6% Asian1 1.4% Other race60 3.2% Two or more races2,028 8.8% White alone, not Hispanic / Latino85 13.9% Hispanic or LatinoMoved within same state 413 1.8% White / Caucasian19 4.2% Black or African American36 1.9% Two or more races411 1.8% White alone, not Hispanic / Latino14 2.2% Hispanic or LatinoMoved from different state 924 4.0% White / Caucasian8 1.8% Black or African American42 8.0% Asian22 35.0% Other race186 10.0% Two or more races923 4.0% White alone, not Hispanic / Latino75 12.2% Hispanic or LatinoMoved from abroad 38 0.2% White8 1.8% Black or African American27 5.1% Asian40 0.2% White alone, not Hispanic / Latino
Children Nativity (place of birth) in Superior
Children under 6 years - Living with two parents Both parents native 802 100.0% NativeOne native, one foreign-born parent 77 100.0% NativeChildren under 6 years - Living with one parent Native parent 483 100.0% NativeChildren 6 to 17 years - Living with two parents Both parents native 1,932 100.0% NativeBoth parents foreign-born 92 100.0% Foreign-bornOne native, one foreign-born parent 112 100.0% NativeChildren 6 to 17 years - Living with one parent Native parent 1,319 100.0% NativeForeign-born parent 49 50.5% Native48 49.5% Foreign-born
Grandparents responsible for own grandchildren in Superior
Grandparents (30 to 59 years) White / Caucasian 42 39.8% Responsible for grandchildren64 60.2% Not responsible for grandchildrenTwo or more races 12 100.0% Responsible for grandchildrenWhite alone, not Hispanic / Latino 44 39.8% Responsible for grandchildren66 60.2% Not responsible for grandchildrenGrandparents (60 years and over) White / Caucasian 57 46.4% Responsible for grandchildren66 53.6% Not responsible for grandchildrenTwo or more races 25 100.0% Responsible for grandchildrenWhite alone, not Hispanic / Latino 58 45.7% Responsible for grandchildren69 54.3% Not responsible for grandchildren