Races in Swarthmore, Pennsylvania (PA) Detailed Stats
Data:
Races - White alone (%)
Races - White alone (% change since 2000)
Races - Black alone (%)
Races - Black alone (% change since 2000)
Races - American Indian alone (%)
Races - American Indian alone (% change since 2000)
Races - Asian alone (%)
Races - Asian alone (% change since 2000)
Races - Hispanic (%)
Races - Hispanic (% change since 2000)
Races - Native Hawaiian and Other Pacific Islander alone (%)
Races - Native Hawaiian and Other Pacific Islander alone (% change since 2000)
Races - Two or more races(%)
Races - Two or more races(% change since 2000)
Races - Other race alone (%)
Races - Other race alone (% change since 2000)
Racial diversity
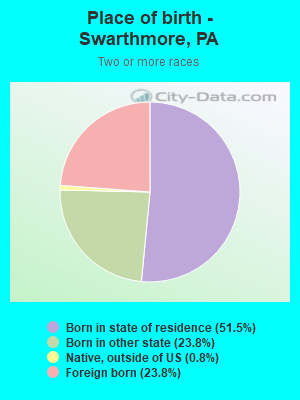
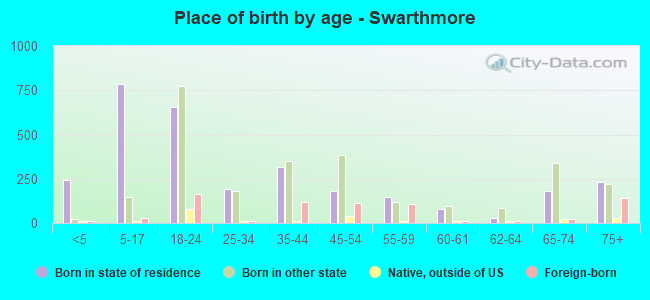
Place of birth - Born in state of residence (%)
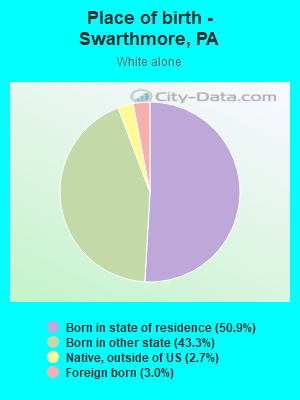
Place of birth - Born in state of residence (%) - White
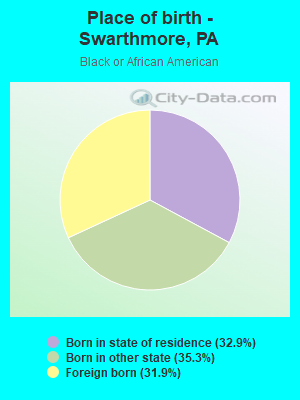
Place of birth - Born in state of residence (%) - Black or African American
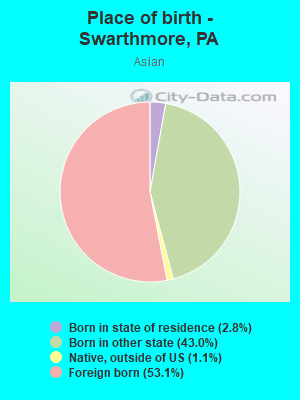
Place of birth - Born in state of residence (%) - Asian
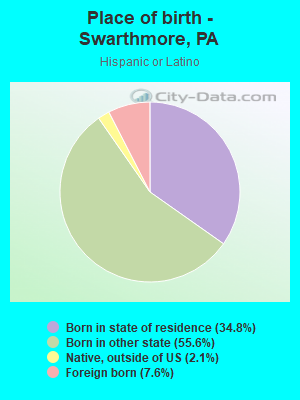
Place of birth - Born in state of residence (%) - Hispanic or Latino
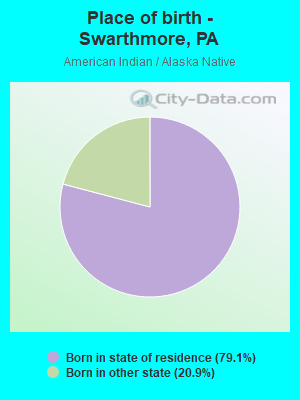
Place of birth - Born in state of residence (%) - American Indian and Alaska Native
Place of birth - Born in state of residence (%) - Multirace
Place of birth - Born in state of residence (%) - Other Race
Place of birth - Born in other state (%)
Place of birth - Born in other state (%) - White
Place of birth - Born in other state (%) - Black or African American
Place of birth - Born in other state (%) - Asian
Place of birth - Born in other state (%) - Hispanic or Latino
Place of birth - Born in other state (%) - American Indian and Alaska Native
Place of birth - Born in other state (%) - Multirace
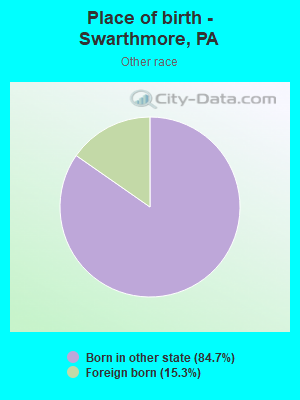
Place of birth - Born in other state (%) - Other Race
Place of birth - Native, outside of US (%)
Place of birth - Native, outside of US (%) - White
Place of birth - Native, outside of US (%) - Black or African American
Place of birth - Native, outside of US (%) - Asian
Place of birth - Native, outside of US (%) - Hispanic or Latino
Place of birth - Native, outside of US (%) - American Indian and Alaska Native
Place of birth - Native, outside of US (%) - Multirace
Place of birth - Native, outside of US (%) - Other Race
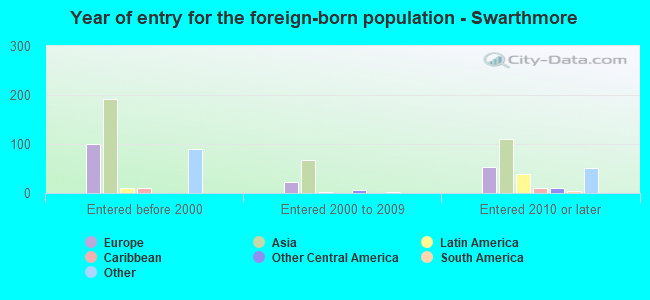
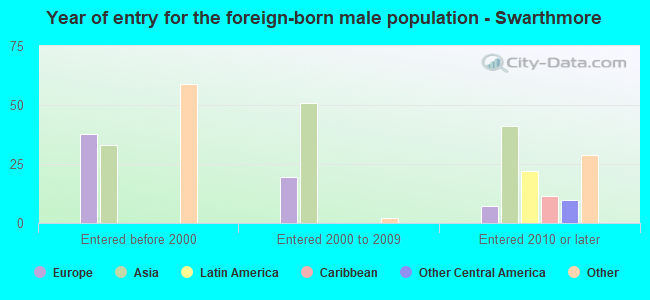
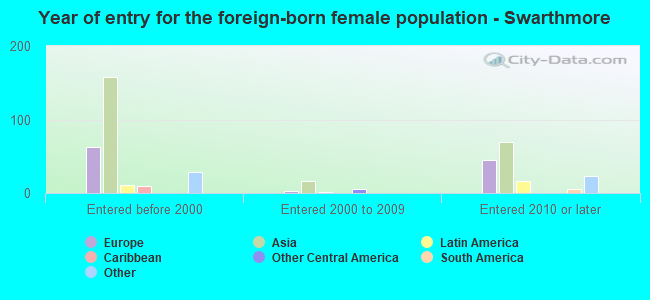
Place of birth - Foreign born (%)
Place of birth - Foreign born (%) - White
Place of birth - Foreign born (%) - Black or African American
Place of birth - Foreign born (%) - Asian
Place of birth - Foreign born (%) - Hispanic or Latino
Place of birth - Foreign born (%) - American Indian and Alaska Native
Place of birth - Foreign born (%) - Multirace
Place of birth - Foreign born (%) - Other Race
Residents speaking English at home (%)
Residents speaking English at home - Born in the United States (%)
Residents speaking English at home - Native, born elsewhere (%)
Residents speaking English at home - Foreign born (%)
Residents speaking Spanish at home (%)
Residents speaking Spanish at home - Born in the United States (%)
Residents speaking Spanish at home - Native, born elsewhere (%)
Residents speaking Spanish at home - Foreign born (%)
Residents speaking other language at home (%)
Residents speaking other language at home - Born in the United States (%)
Residents speaking other language at home - Native, born elsewhere (%)
Residents speaking other language at home - Foreign born (%)
Marital status - Never married (%)
Marital status - Now married (%)
Marital status - Separated (%)
Marital status - Widowed (%)
Marital status - Divorced (%)
Ancestries Reported - Arab (%)
Ancestries Reported - Czech (%)
Ancestries Reported - Danish (%)
Ancestries Reported - Dutch (%)
Ancestries Reported - English (%)
Ancestries Reported - French (%)
Ancestries Reported - French Canadian (%)
Ancestries Reported - German (%)
Ancestries Reported - Greek (%)
Ancestries Reported - Hungarian (%)
Ancestries Reported - Irish (%)
Ancestries Reported - Italian (%)
Ancestries Reported - Lithuanian (%)
Ancestries Reported - Norwegian (%)
Ancestries Reported - Polish (%)
Ancestries Reported - Portuguese (%)
Ancestries Reported - Russian (%)
Ancestries Reported - Scotch-Irish (%)
Ancestries Reported - Scottish (%)
Ancestries Reported - Slovak (%)
Ancestries Reported - Subsaharan African (%)
Ancestries Reported - Swedish (%)
Ancestries Reported - Swiss (%)
Ancestries Reported - Ukrainian (%)
Ancestries Reported - United States (%)
Ancestries Reported - Welsh (%)
Ancestries Reported - West Indian (%)
Ancestries Reported - Other (%)
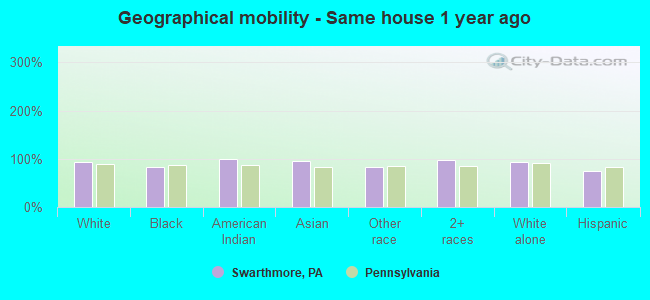
Geographical mobility - Same house 1 year ago (%)
Geographical mobility - Same house 1 year ago (%) - White
Geographical mobility - Same house 1 year ago (%) - Black or African American
Geographical mobility - Same house 1 year ago (%) - Asian
Geographical mobility - Same house 1 year ago (%) - Hispanic or Latino
Geographical mobility - Same house 1 year ago (%) - American Indian and Alaska Native
Geographical mobility - Same house 1 year ago (%) - Multirace
Geographical mobility - Same house 1 year ago (%) - Other Race
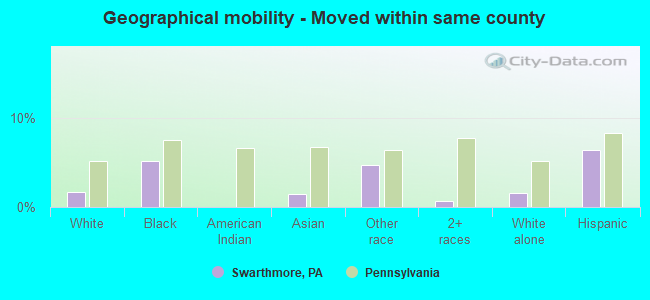
Geographical mobility - Moved within same county (%)
Geographical mobility - Moved within same county (%) - White
Geographical mobility - Moved within same county (%) - Black or African American
Geographical mobility - Moved within same county (%) - Asian
Geographical mobility - Moved within same county (%) - Hispanic or Latino
Geographical mobility - Moved within same county (%) - American Indian and Alaska Native
Geographical mobility - Moved within same county (%) - Multirace
Geographical mobility - Moved within same county (%) - Other Race
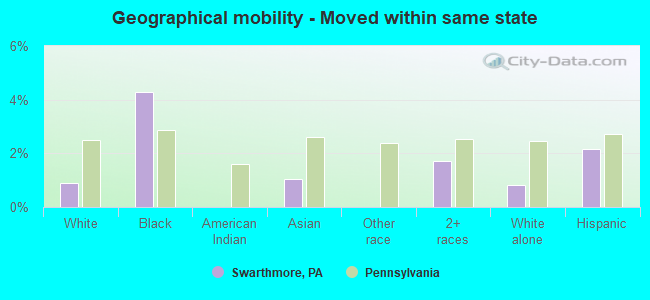
Geographical mobility - Moved from different county within same state (%)
Geographical mobility - Moved from different county within same state (%) - White
Geographical mobility - Moved from different county within same state (%) - Black or African American
Geographical mobility - Moved from different county within same state (%) - Asian
Geographical mobility - Moved from different county within same state (%) - Hispanic or Latino
Geographical mobility - Moved from different county within same state (%) - American Indian and Alaska Native
Geographical mobility - Moved from different county within same state (%) - Multirace
Geographical mobility - Moved from different county within same state (%) - Other Race
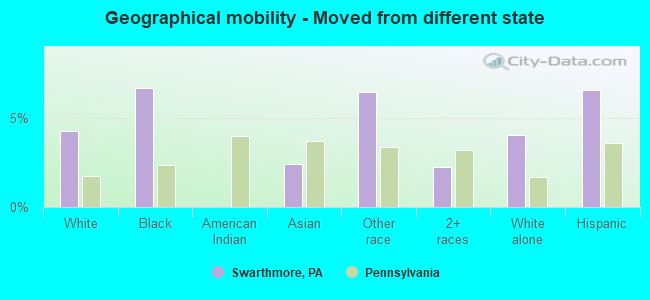
Geographical mobility - Moved from different state (%)
Geographical mobility - Moved from different state (%) - White
Geographical mobility - Moved from different state (%) - Black or African American
Geographical mobility - Moved from different state (%) - Asian
Geographical mobility - Moved from different state (%) - Hispanic or Latino
Geographical mobility - Moved from different state (%) - American Indian and Alaska Native
Geographical mobility - Moved from different state (%) - Multirace
Geographical mobility - Moved from different state (%) - Other Race
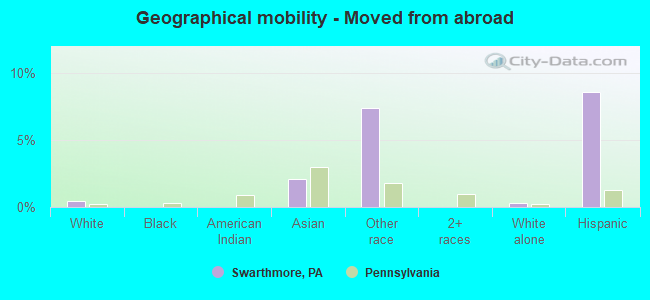
Geographical mobility - Moved from abroad (%)
Geographical mobility - Moved from abroad (%) - White
Geographical mobility - Moved from abroad (%) - Black or African American
Geographical mobility - Moved from abroad (%) - Asian
Geographical mobility - Moved from abroad (%) - Hispanic or Latino
Geographical mobility - Moved from abroad (%) - American Indian and Alaska Native
Geographical mobility - Moved from abroad (%) - Multirace
Geographical mobility - Moved from abroad (%) - Other Race
Place of birth for the foreign-born population - Ireland (%)
Place of birth for the foreign-born population - Denmark (%)
Place of birth for the foreign-born population - Norway (%)
Place of birth for the foreign-born population - Sweden (%)
Place of birth for the foreign-born population - United Kingdom (%)
Place of birth for the foreign-born population - England (%)
Place of birth for the foreign-born population - Scotland (%)
Place of birth for the foreign-born population - Other Northern Europe (%)
Place of birth for the foreign-born population - Austria (%)
Place of birth for the foreign-born population - Belgium (%)
Place of birth for the foreign-born population - France (%)
Place of birth for the foreign-born population - Germany (%)
Place of birth for the foreign-born population - Netherlands (%)
Place of birth for the foreign-born population - Switzerland (%)
Place of birth for the foreign-born population - Other Western Europe (%)
Place of birth for the foreign-born population - Greece (%)
Place of birth for the foreign-born population - Italy (%)
Place of birth for the foreign-born population - Portugal (%)
Place of birth for the foreign-born population - Spain (%)
Place of birth for the foreign-born population - Other Southern Europe (%)
Place of birth for the foreign-born population - Albania (%)
Place of birth for the foreign-born population - Belarus (%)
Place of birth for the foreign-born population - Bosnia and Herzegovina (%)
Place of birth for the foreign-born population - Bulgaria (%)
Place of birth for the foreign-born population - Croatia (%)
Place of birth for the foreign-born population - Czechoslovakia (%)
Place of birth for the foreign-born population - Hungary (%)
Place of birth for the foreign-born population - Latvia (%)
Place of birth for the foreign-born population - Lithuania (%)
Place of birth for the foreign-born population - North Macedonia (Macedonia) (%)
Place of birth for the foreign-born population - Moldova (%)
Place of birth for the foreign-born population - Poland (%)
Place of birth for the foreign-born population - Romania (%)
Place of birth for the foreign-born population - Russia (%)
Place of birth for the foreign-born population - Serbia (%)
Place of birth for the foreign-born population - Ukraine (%)
Place of birth for the foreign-born population - Other Eastern Europe (%)
Place of birth for the foreign-born population - China (%)
Place of birth for the foreign-born population - Hong Kong (%)
Place of birth for the foreign-born population - Taiwan (%)
Place of birth for the foreign-born population - Japan (%)
Place of birth for the foreign-born population - Korea (%)
Place of birth for the foreign-born population - Other Eastern Asia (%)
Place of birth for the foreign-born population - Afghanistan (%)
Place of birth for the foreign-born population - Bangladesh (%)
Place of birth for the foreign-born population - India (%)
Place of birth for the foreign-born population - Iran (%)
Place of birth for the foreign-born population - Kazakhstan (%)
Place of birth for the foreign-born population - Nepal (%)
Place of birth for the foreign-born population - Pakistan (%)
Place of birth for the foreign-born population - Sri Lanka (%)
Place of birth for the foreign-born population - Uzbekistan (%)
Place of birth for the foreign-born population - Other South Central Asia (%)
Place of birth for the foreign-born population - Burma (%)
Place of birth for the foreign-born population - Cambodia (%)
Place of birth for the foreign-born population - Indonesia (%)
Place of birth for the foreign-born population - Laos (%)
Place of birth for the foreign-born population - Malaysia (%)
Place of birth for the foreign-born population - Philippines (%)
Place of birth for the foreign-born population - Singapore (%)
Place of birth for the foreign-born population - Thailand (%)
Place of birth for the foreign-born population - Vietnam (%)
Place of birth for the foreign-born population - Other South Eastern Asia (%)
Place of birth for the foreign-born population - Armenia (%)
Place of birth for the foreign-born population - Iraq (%)
Place of birth for the foreign-born population - Israel (%)
Place of birth for the foreign-born population - Jordan (%)
Place of birth for the foreign-born population - Kuwait (%)
Place of birth for the foreign-born population - Lebanon (%)
Place of birth for the foreign-born population - Saudi Arabia (%)
Place of birth for the foreign-born population - Syria (%)
Place of birth for the foreign-born population - Turkey (%)
Place of birth for the foreign-born population - Yemen (%)
Place of birth for the foreign-born population - Other Western Asia (%)
Place of birth for the foreign-born population - Eritrea (%)
Place of birth for the foreign-born population - Ethiopia (%)
Place of birth for the foreign-born population - Kenya (%)
Place of birth for the foreign-born population - Somalia (%)
Place of birth for the foreign-born population - Uganda (%)
Place of birth for the foreign-born population - Zimbabwe (%)
Place of birth for the foreign-born population - Other Eastern Africa (%)
Place of birth for the foreign-born population - Cameroon (%)
Place of birth for the foreign-born population - Congo (%)
Place of birth for the foreign-born population - Democratic Republic of Congo (Zaire) (%)
Place of birth for the foreign-born population - Other Middle Africa (%)
Place of birth for the foreign-born population - Egypt (%)
Place of birth for the foreign-born population - Morocco (%)
Place of birth for the foreign-born population - Sudan (%)
Place of birth for the foreign-born population - Other Northern Africa (%)
Place of birth for the foreign-born population - South Africa (%)
Place of birth for the foreign-born population - Other Southern Africa (%)
Place of birth for the foreign-born population - Cabo Verde (%)
Place of birth for the foreign-born population - Ghana (%)
Place of birth for the foreign-born population - Liberia (%)
Place of birth for the foreign-born population - Nigeria (%)
Place of birth for the foreign-born population - Senegal (%)
Place of birth for the foreign-born population - Sierra Leone (%)
Place of birth for the foreign-born population - Other Western Africa (%)
Place of birth for the foreign-born population - Australia (%)
Place of birth for the foreign-born population - New Zealand (%)
Place of birth for the foreign-born population - Fiji (%)
Place of birth for the foreign-born population - Micronesia (%)
Place of birth for the foreign-born population - Bahamas (%)
Place of birth for the foreign-born population - Barbados (%)
Place of birth for the foreign-born population - Cuba (%)
Place of birth for the foreign-born population - Dominica (%)
Place of birth for the foreign-born population - Dominican Republic (%)
Place of birth for the foreign-born population - Grenada (%)
Place of birth for the foreign-born population - Haiti (%)
Place of birth for the foreign-born population - Jamaica (%)
Place of birth for the foreign-born population - St. Vincent and the Grenadines (%)
Place of birth for the foreign-born population - Trinidad and Tobago (%)
Place of birth for the foreign-born population - West Indies (%)
Place of birth for the foreign-born population - Other Caribbean (%)
Place of birth for the foreign-born population - Belize (%)
Place of birth for the foreign-born population - Costa Rica (%)
Place of birth for the foreign-born population - El Salvador (%)
Place of birth for the foreign-born population - Guatemala (%)
Place of birth for the foreign-born population - Honduras (%)
Place of birth for the foreign-born population - Mexico (%)
Place of birth for the foreign-born population - Nicaragua (%)
Place of birth for the foreign-born population - Panama (%)
Place of birth for the foreign-born population - Other Central America (%)
Place of birth for the foreign-born population - Argentina (%)
Place of birth for the foreign-born population - Bolivia (%)
Place of birth for the foreign-born population - Brazil (%)
Place of birth for the foreign-born population - Chile (%)
Place of birth for the foreign-born population - Colombia (%)
Place of birth for the foreign-born population - Ecuador (%)
Place of birth for the foreign-born population - Guyana (%)
Place of birth for the foreign-born population - Peru (%)
Place of birth for the foreign-born population - Uruguay (%)
Place of birth for the foreign-born population - Venezuela (%)
Place of birth for the foreign-born population - Other South America (%)
Place of birth for the foreign-born population - Canada (%)
Place of birth for the foreign-born population - Other Northern America (%)
Place of birth for the foreign-born population - Other (%)
Latest news about races in Swarthmore, PA collected exclusively by city-data.com from local newspapers, TV, and radio stations
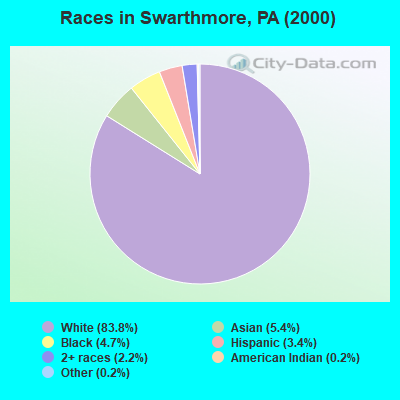
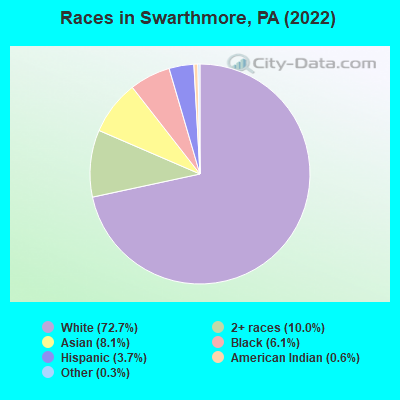
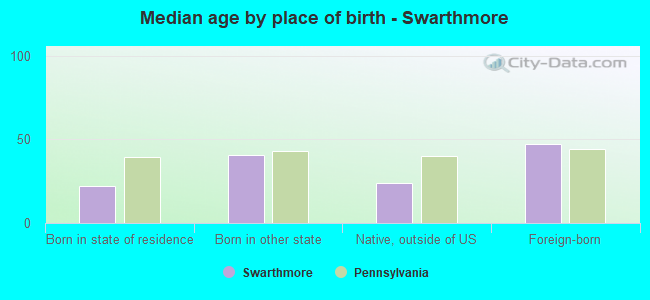
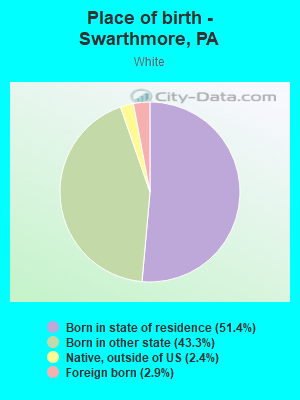
According to 2022 data, the most numerous races in Swarthmore, PA are White alone (4,728 residents), Black alone (396 residents), and Hispanic (243 residents). 86.2% of Swarthmore residents speak English at home. 12.2% of Swarthmore, PA residents are foreign-born (6.1% born in Asia, 2.4% born in Europe, 1.8% born in Africa), which is 42.4% greater than the foreign-born rate of 7.0% across the entire state of Pennsylvania.
Race distribution in Swarthmore
2000 2022
10,322,455 84.1% White alone 1,202,437 9.8% Black alone 394,088 3.2% Hispanic 218,296 1.8% Asian alone 113,097 0.9% Two or more races 13,086 0.1% Other race alone 14,904 0.1% American Indian alone 2,691 0.02% Native Hawaiian and Other
9,487,228 73.1% White alone 1,311,581 10.1% Black alone 1,115,997 8.6% Hispanic 493,942 3.8% Two or more races 487,124 3.8% Asian alone 63,582 0.5% Other race alone 10,130 0.08% American Indian alone 2,424 0.02% Native Hawaiian and Other
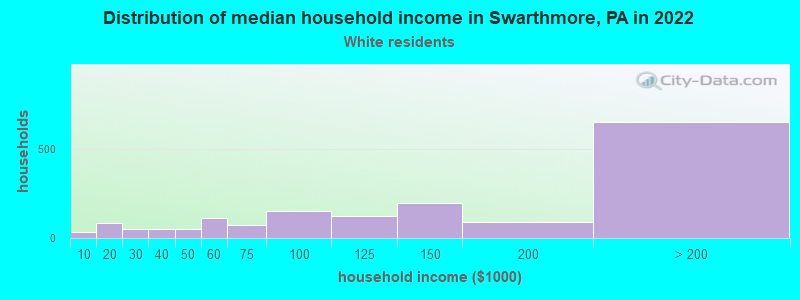
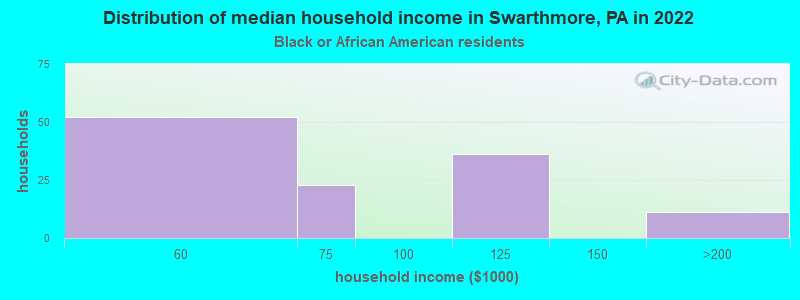
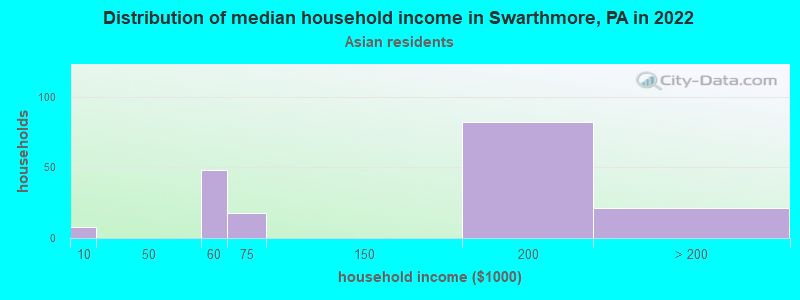
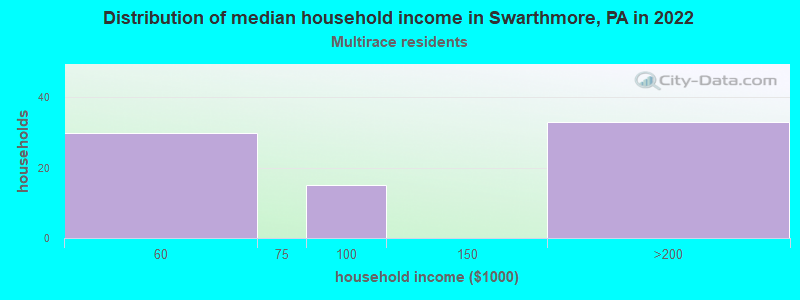
Income and house value in Swarthmore Median household income in 2022 $135,671 White non-Hispanic householders$85,924 Two or more races householdersMedian 2022 house value $598,347 White Non-Hispanic householders$423,752 Black or African American householders$802,996 American Indian or Alaska Native householders $405,169 Asian householders$172,070 Two or more races householders$630,926 Hispanic or Latino householders
Median age by race in Swarthmore
40.3 Median age for White residents37.7 40.6 26.0 Median age for Black or African American residents21.5 43.1 49.2 Median age for American Indian / Alaska Native residents-1,478,964,399.8 36.9 41.0 Median age for Asian residents23.4 41.3 -680,432,644.4 Median age for Native Hawaiian / Pacific Islander residents-666,666,666.0 -747,474,746.7 20.5 Median age for Other race residents17.3 22.0 19.3 Median age for Two or more races residents19.9 18.3 40.6 Median age for White alone residents40.2 40.9 19.1 Median age for Hispanic or Latino residents20.0 19.4
Owner/renter occupied households by race in Swarthmore
House owners and renters - White residents 1,429 83.9% Owner occupied273 16.1% Renter occupiedHouse owners and renters - Black or African American residents 34 31.5% Owner occupied74 68.5% Renter occupiedHouse owners and renters - American Indian / Alaska Native residents 12 100.0% Owner occupiedHouse owners and renters - Asian residents 167 72.6% Owner occupied63 27.4% Renter occupiedHouse owners and renters - Other race residents 21 100.0% Renter occupiedHouse owners and renters - Two or more races residents 42 64.8% Owner occupied23 35.2% Renter occupiedHouse owners and renters - White alone residents 1,433 83.7% Owner occupied280 16.3% Renter occupied
Language usage in Swarthmore
English speakers - Total 86.2% of residents of Swarthmore speak English at home.
2.6% of residents speak Spanish at home 130 80.7% Speak English very well31 19.3% Speak English less than very well11.1% of residents speak other language at home 578 83.8% Speak English very well112 16.2% Speak English less than very well
English speakers - Born in the United States 92.0% of residents of Swarthmore speak English at home.
4.8% of residents speak Spanish at home 75 56.8% Speak English very well57 43.2% Speak English less than very well3.2% of residents speak other language at home 82 94.3% Speak English very well5 5.7% Speak English less than very well
English speakers - Native, born elsewhere 77.6% of residents of Swarthmore speak English at home.
2.0% of residents speak Spanish at home 3 100.0% Speak English very well2.6% of residents speak other language at home 4 100.0% Speak English less than very well
English speakers - Foreign-born 28.5% of residents of Swarthmore speak English at home.
1.6% of residents speak Spanish at home 11 100.0% Speak English very well70.4% of residents speak other language at home 387 78.7% Speak English very well105 21.3% Speak English less than very well
White (Caucasian) - Speak only English Native:
96.5% (4,363)Foreign-born:
58.0% (83)
White (Caucasian) - Speak another language Native:
3.2% (147)Foreign-born:
46.9% (68)
Black or African American - Speak only English Native:
93.9% (254)Foreign-born:
20.9% (28)
Black or African American - Speak another language Native:
6.1% (16)Foreign-born:
78.2% (103)
Asian - Speak only English Native:
69.6% (164)Foreign-born:
25.9% (79)
Asian - Speak another language Native:
29.3% (69)Foreign-born:
78.1% (238)
Other race - Speak only English Native:
22.1% (18)Foreign-born:
82.6% (16)
Other race - Speak another language Native:
82.1% (68)Foreign-born:
52.7% (10)
Two or more races - Speak only English Native:
92.5% (370)Foreign-born:
15.4% (23)
Two or more races - Speak another language Native:
7.8% (31)Foreign-born:
85.6% (130)
White alone - Speak only English Native:
97.5% (4,356)Foreign-born:
57.8% (84)
White alone - Speak another language Native:
2.5% (111)Foreign-born:
45.3% (66)
Hispanic or Latino - Speak only English Native:
25.3% (49)Foreign-born:
33.0% (6)
Hispanic or Latino - Speak another language Native:
71.0% (137)Foreign-born:
51.4% (9)
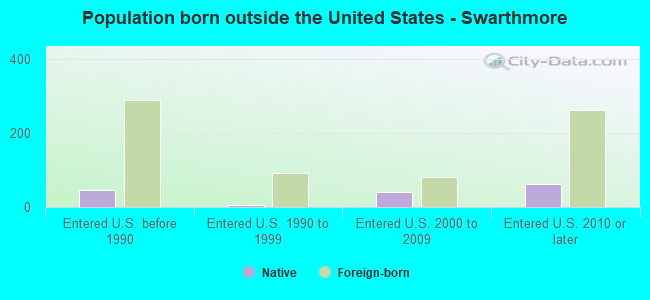
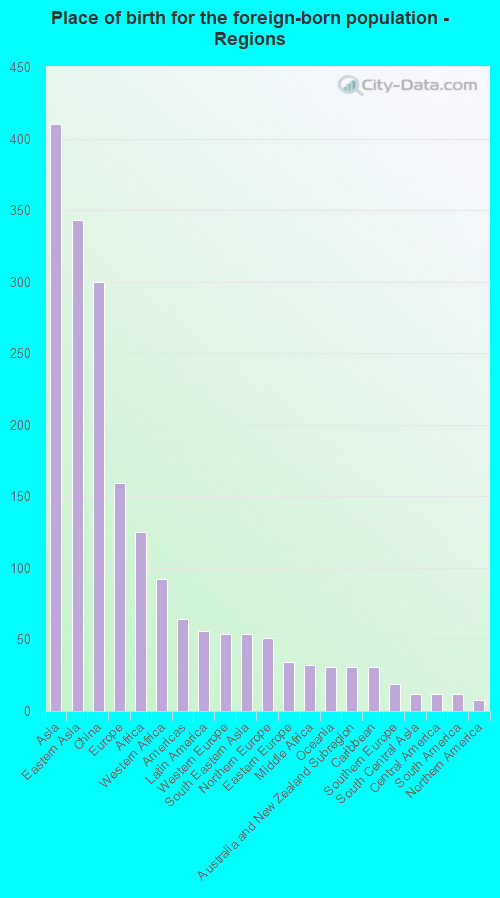
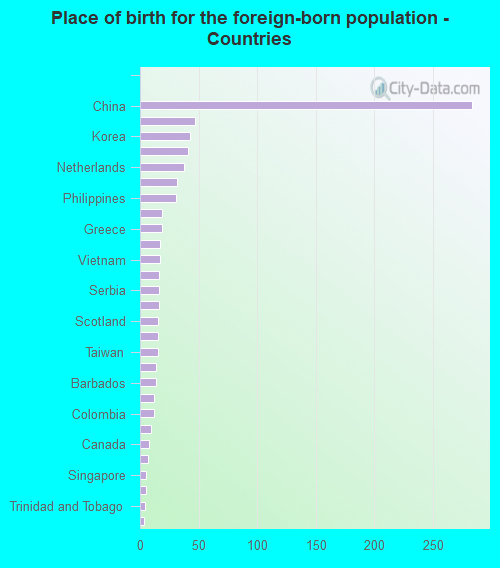
Foreign-born residents in Swarthmore 791 residents are foreign born (6.1% Asia , 2.4% Europe , 1.8% Africa ).
This city:
12.2%Pennsylvania:
7.3%
Marital status for residents in Swarthmore Marital status - White (Caucasian) population 15 years and over
Males 36.8% Never married55.2% Now married2.3% Separated1.3% Widowed4.4% DivorcedFemales 38.6% Never married45.8% Now married0.0% Separated5.9% Widowed9.7% DivorcedWomen who gave birth in the past 12 months Now married:
100.0% (31)Unmarried:
0.0% (0)
Women who did not give birth in the past 12 months Now married:
31.2% (339)Unmarried:
68.8% (748)
Marital status - Black or African American population 15 years and over
Males 49.5% Never married37.7% Now married9.3% Separated0.0% Widowed3.4% DivorcedFemales 51.2% Never married24.4% Now married13.1% Separated8.7% Widowed2.5% DivorcedWomen who did not give birth in the past 12 months Now married:
35.9% (47)Unmarried:
64.1% (83)
Marital status - American Indian / Alaska Native population 15 years and over
Males 100.0% Never married0.0% Now married0.0% Separated0.0% Widowed0.0% DivorcedFemales 68.0% Never married32.0% Now married0.0% Separated0.0% Widowed0.0% DivorcedWomen who did not give birth in the past 12 months Now married:
0.0% (0)Unmarried:
100.0% (31)
Marital status - Asian population 15 years and over
Males 52.3% Never married47.7% Now married0.0% Separated0.0% Widowed0.0% DivorcedFemales 19.8% Never married48.4% Now married0.0% Separated0.0% Widowed31.8% DivorcedWomen who did not give birth in the past 12 months Now married:
71.0% (189)Unmarried:
29.0% (77)
Marital status - Other race population 15 years and over
Males 100.0% Never married0.0% Now married0.0% Separated0.0% Widowed0.0% DivorcedFemales 75.5% Never married24.5% Now married0.0% Separated0.0% Widowed0.0% DivorcedWomen who did not give birth in the past 12 months Now married:
24.5% (15)Unmarried:
75.5% (46)
Marital status - Two or more races population 15 years and over
Males 88.5% Never married11.5% Now married0.0% Separated0.0% Widowed0.0% DivorcedFemales 83.9% Never married16.1% Now married0.0% Separated0.0% Widowed0.0% DivorcedWomen who did not give birth in the past 12 months Now married:
18.2% (26)Unmarried:
81.8% (119)
Marital status - White alone, not Hispanic / Latino population 15 years and over
Males 35.0% Never married56.8% Now married2.3% Separated1.4% Widowed4.5% DivorcedFemales 37.8% Never married46.4% Now married0.0% Separated6.0% Widowed9.8% DivorcedWomen who gave birth in the past 12 months Now married:
100.0% (31)Unmarried:
0.0% (0)
Women who did not give birth in the past 12 months Now married:
31.9% (343)Unmarried:
68.1% (732)
Marital status - Hispanic or Latino population 15 years and over
Males 100.0% Never married0.0% Now married0.0% Separated0.0% Widowed0.0% DivorcedFemales 70.2% Never married29.8% Now married0.0% Separated0.0% Widowed0.0% DivorcedWomen who did not give birth in the past 12 months Now married:
29.8% (37)Unmarried:
70.2% (87)
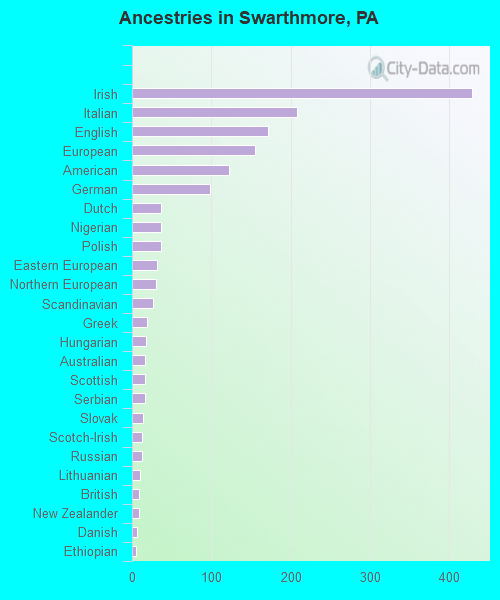
Ancestries in Swarthmore
429 18.1% Irish208 8.8% Italian171 7.2% English155 6.5% European123 5.2% American99 4.2% German37 1.6% Dutch37 1.6% Nigerian36 1.5% Polish31 1.3% Eastern European30 1.3% Northern European26 1.1% Scandinavian19 0.8% Greek18 0.8% Hungarian17 0.7% Australian16 0.7% Scottish16 0.7% Serbian14 0.6% Slovak13 0.5% Scotch-Irish12 0.5% Russian10 0.4% Lithuanian9 0.4% British9 0.4% New Zealander6 0.3% Danish5 0.2% Ethiopian4 0.2% African3 0.1% Welsh
Children Nativity (place of birth) in Swarthmore
Children under 6 years - Living with two parents Both parents native 236 100.0% NativeBoth parents foreign-born 19 100.0% NativeOne native, one foreign-born parent 36 100.0% NativeChildren under 6 years - Living with one parent Native parent 25 100.0% NativeChildren 6 to 17 years - Living with two parents Both parents native 691 100.0% NativeBoth parents foreign-born 64 85.7% Native11 14.3% Foreign-bornOne native, one foreign-born parent 40 100.0% NativeChildren 6 to 17 years - Living with one parent Native parent 50 100.0% NativeForeign-born parent 22 55.6% Native18 44.4% Foreign-born
Grandparents responsible for own grandchildren in Swarthmore
Grandparents (30 to 59 years) White / Caucasian 20 100.0% Responsible for grandchildrenWhite alone, not Hispanic / Latino 20 100.0% Responsible for grandchildren
Grandparents (60 years and over) White / Caucasian 7 100.0% Responsible for grandchildrenWhite alone, not Hispanic / Latino 7 100.0% Responsible for grandchildren