Races in Swinomish Reservation, Washington (WA) Detailed Stats
Ancestries, Foreign-born residents, place of birth
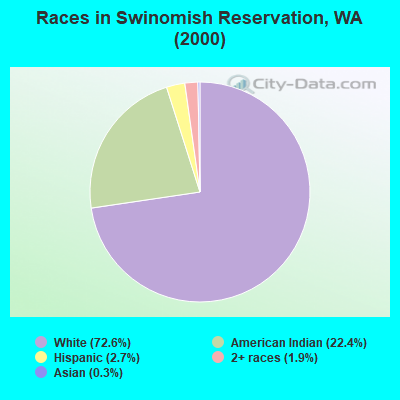
Race distribution in Swinomish Reservation

- 1,93372.6%White alone
- 59822.4%American Indian alone
- 732.7%Hispanic
- 501.9%Two or more races
- 80.3%Asian alone
- 20.08%Black alone
2000
2022
-
- 4,652,49078.9%White alone
- 441,5097.5%Hispanic
- 319,4015.4%Asian alone
- 184,6313.1%Black alone
- 175,9263.0%Two or more races
- 85,3961.4%American Indian alone
- 22,7790.4%Native Hawaiian and Other
Pacific Islander alone - 11,9890.2%Other race alone

-
- 4,941,45663.5%White alone
- 1,093,31314.0%Hispanic
- 755,8329.7%Asian alone
- 523,4486.7%Two or more races
- 299,5373.8%Black alone
- 69,0240.9%American Indian alone
- 52,2310.7%Native Hawaiian and Other
Pacific Islander alone - 50,9450.7%Other race alone

Income and house value in Swinomish Reservation
- Median household income in 2022
- $96,659White non-Hispanic householders
- $103,487American Indian and Alaska Native householders
- $120,560Asian householders
- $132,112Two or more races householders
- $19,095Hispanic or Latino race householders
- Median 2022 house value
- $665,007White Non-Hispanic householders
- $368,956American Indian or Alaska Native householders
- $581,881Two or more races householders
- $289,578Hispanic or Latino householders
Household income for White non-Hispanic householders

Household income for American Indian and Alaska Native householders

Household income for Asian householders

Household income for Two or more races householders

Household income for Hispanic or Latino race householders
