Races in Sylvania, Ohio (OH) Detailed Stats
Data:
Races - White alone (%)
Races - White alone (% change since 2000)
Races - Black alone (%)
Races - Black alone (% change since 2000)
Races - American Indian alone (%)
Races - American Indian alone (% change since 2000)
Races - Asian alone (%)
Races - Asian alone (% change since 2000)
Races - Hispanic (%)
Races - Hispanic (% change since 2000)
Races - Native Hawaiian and Other Pacific Islander alone (%)
Races - Native Hawaiian and Other Pacific Islander alone (% change since 2000)
Races - Two or more races(%)
Races - Two or more races(% change since 2000)
Races - Other race alone (%)
Races - Other race alone (% change since 2000)
Racial diversity
Place of birth - Born in state of residence (%)
Place of birth - Born in state of residence (%) - White
Place of birth - Born in state of residence (%) - Black or African American
Place of birth - Born in state of residence (%) - Asian
Place of birth - Born in state of residence (%) - Hispanic or Latino
Place of birth - Born in state of residence (%) - American Indian and Alaska Native
Place of birth - Born in state of residence (%) - Multirace
Place of birth - Born in state of residence (%) - Other Race
Place of birth - Born in other state (%)
Place of birth - Born in other state (%) - White
Place of birth - Born in other state (%) - Black or African American
Place of birth - Born in other state (%) - Asian
Place of birth - Born in other state (%) - Hispanic or Latino
Place of birth - Born in other state (%) - American Indian and Alaska Native
Place of birth - Born in other state (%) - Multirace
Place of birth - Born in other state (%) - Other Race
Place of birth - Native, outside of US (%)
Place of birth - Native, outside of US (%) - White
Place of birth - Native, outside of US (%) - Black or African American
Place of birth - Native, outside of US (%) - Asian
Place of birth - Native, outside of US (%) - Hispanic or Latino
Place of birth - Native, outside of US (%) - American Indian and Alaska Native
Place of birth - Native, outside of US (%) - Multirace
Place of birth - Native, outside of US (%) - Other Race
Place of birth - Foreign born (%)
Place of birth - Foreign born (%) - White
Place of birth - Foreign born (%) - Black or African American
Place of birth - Foreign born (%) - Asian
Place of birth - Foreign born (%) - Hispanic or Latino
Place of birth - Foreign born (%) - American Indian and Alaska Native
Place of birth - Foreign born (%) - Multirace
Place of birth - Foreign born (%) - Other Race
Residents speaking English at home (%)
Residents speaking English at home - Born in the United States (%)
Residents speaking English at home - Native, born elsewhere (%)
Residents speaking English at home - Foreign born (%)
Residents speaking Spanish at home (%)
Residents speaking Spanish at home - Born in the United States (%)
Residents speaking Spanish at home - Native, born elsewhere (%)
Residents speaking Spanish at home - Foreign born (%)
Residents speaking other language at home (%)
Residents speaking other language at home - Born in the United States (%)
Residents speaking other language at home - Native, born elsewhere (%)
Residents speaking other language at home - Foreign born (%)
Marital status - Never married (%)
Marital status - Now married (%)
Marital status - Separated (%)
Marital status - Widowed (%)
Marital status - Divorced (%)
Ancestries Reported - Arab (%)
Ancestries Reported - Czech (%)
Ancestries Reported - Danish (%)
Ancestries Reported - Dutch (%)
Ancestries Reported - English (%)
Ancestries Reported - French (%)
Ancestries Reported - French Canadian (%)
Ancestries Reported - German (%)
Ancestries Reported - Greek (%)
Ancestries Reported - Hungarian (%)
Ancestries Reported - Irish (%)
Ancestries Reported - Italian (%)
Ancestries Reported - Lithuanian (%)
Ancestries Reported - Norwegian (%)
Ancestries Reported - Polish (%)
Ancestries Reported - Portuguese (%)
Ancestries Reported - Russian (%)
Ancestries Reported - Scotch-Irish (%)
Ancestries Reported - Scottish (%)
Ancestries Reported - Slovak (%)
Ancestries Reported - Subsaharan African (%)
Ancestries Reported - Swedish (%)
Ancestries Reported - Swiss (%)
Ancestries Reported - Ukrainian (%)
Ancestries Reported - United States (%)
Ancestries Reported - Welsh (%)
Ancestries Reported - West Indian (%)
Ancestries Reported - Other (%)
Geographical mobility - Same house 1 year ago (%)
Geographical mobility - Same house 1 year ago (%) - White
Geographical mobility - Same house 1 year ago (%) - Black or African American
Geographical mobility - Same house 1 year ago (%) - Asian
Geographical mobility - Same house 1 year ago (%) - Hispanic or Latino
Geographical mobility - Same house 1 year ago (%) - American Indian and Alaska Native
Geographical mobility - Same house 1 year ago (%) - Multirace
Geographical mobility - Same house 1 year ago (%) - Other Race
Geographical mobility - Moved within same county (%)
Geographical mobility - Moved within same county (%) - White
Geographical mobility - Moved within same county (%) - Black or African American
Geographical mobility - Moved within same county (%) - Asian
Geographical mobility - Moved within same county (%) - Hispanic or Latino
Geographical mobility - Moved within same county (%) - American Indian and Alaska Native
Geographical mobility - Moved within same county (%) - Multirace
Geographical mobility - Moved within same county (%) - Other Race
Geographical mobility - Moved from different county within same state (%)
Geographical mobility - Moved from different county within same state (%) - White
Geographical mobility - Moved from different county within same state (%) - Black or African American
Geographical mobility - Moved from different county within same state (%) - Asian
Geographical mobility - Moved from different county within same state (%) - Hispanic or Latino
Geographical mobility - Moved from different county within same state (%) - American Indian and Alaska Native
Geographical mobility - Moved from different county within same state (%) - Multirace
Geographical mobility - Moved from different county within same state (%) - Other Race
Geographical mobility - Moved from different state (%)
Geographical mobility - Moved from different state (%) - White
Geographical mobility - Moved from different state (%) - Black or African American
Geographical mobility - Moved from different state (%) - Asian
Geographical mobility - Moved from different state (%) - Hispanic or Latino
Geographical mobility - Moved from different state (%) - American Indian and Alaska Native
Geographical mobility - Moved from different state (%) - Multirace
Geographical mobility - Moved from different state (%) - Other Race
Geographical mobility - Moved from abroad (%)
Geographical mobility - Moved from abroad (%) - White
Geographical mobility - Moved from abroad (%) - Black or African American
Geographical mobility - Moved from abroad (%) - Asian
Geographical mobility - Moved from abroad (%) - Hispanic or Latino
Geographical mobility - Moved from abroad (%) - American Indian and Alaska Native
Geographical mobility - Moved from abroad (%) - Multirace
Geographical mobility - Moved from abroad (%) - Other Race
Place of birth for the foreign-born population - Ireland (%)
Place of birth for the foreign-born population - Denmark (%)
Place of birth for the foreign-born population - Norway (%)
Place of birth for the foreign-born population - Sweden (%)
Place of birth for the foreign-born population - United Kingdom (%)
Place of birth for the foreign-born population - England (%)
Place of birth for the foreign-born population - Scotland (%)
Place of birth for the foreign-born population - Other Northern Europe (%)
Place of birth for the foreign-born population - Austria (%)
Place of birth for the foreign-born population - Belgium (%)
Place of birth for the foreign-born population - France (%)
Place of birth for the foreign-born population - Germany (%)
Place of birth for the foreign-born population - Netherlands (%)
Place of birth for the foreign-born population - Switzerland (%)
Place of birth for the foreign-born population - Other Western Europe (%)
Place of birth for the foreign-born population - Greece (%)
Place of birth for the foreign-born population - Italy (%)
Place of birth for the foreign-born population - Portugal (%)
Place of birth for the foreign-born population - Spain (%)
Place of birth for the foreign-born population - Other Southern Europe (%)
Place of birth for the foreign-born population - Albania (%)
Place of birth for the foreign-born population - Belarus (%)
Place of birth for the foreign-born population - Bosnia and Herzegovina (%)
Place of birth for the foreign-born population - Bulgaria (%)
Place of birth for the foreign-born population - Croatia (%)
Place of birth for the foreign-born population - Czechoslovakia (%)
Place of birth for the foreign-born population - Hungary (%)
Place of birth for the foreign-born population - Latvia (%)
Place of birth for the foreign-born population - Lithuania (%)
Place of birth for the foreign-born population - North Macedonia (Macedonia) (%)
Place of birth for the foreign-born population - Moldova (%)
Place of birth for the foreign-born population - Poland (%)
Place of birth for the foreign-born population - Romania (%)
Place of birth for the foreign-born population - Russia (%)
Place of birth for the foreign-born population - Serbia (%)
Place of birth for the foreign-born population - Ukraine (%)
Place of birth for the foreign-born population - Other Eastern Europe (%)
Place of birth for the foreign-born population - China (%)
Place of birth for the foreign-born population - Hong Kong (%)
Place of birth for the foreign-born population - Taiwan (%)
Place of birth for the foreign-born population - Japan (%)
Place of birth for the foreign-born population - Korea (%)
Place of birth for the foreign-born population - Other Eastern Asia (%)
Place of birth for the foreign-born population - Afghanistan (%)
Place of birth for the foreign-born population - Bangladesh (%)
Place of birth for the foreign-born population - India (%)
Place of birth for the foreign-born population - Iran (%)
Place of birth for the foreign-born population - Kazakhstan (%)
Place of birth for the foreign-born population - Nepal (%)
Place of birth for the foreign-born population - Pakistan (%)
Place of birth for the foreign-born population - Sri Lanka (%)
Place of birth for the foreign-born population - Uzbekistan (%)
Place of birth for the foreign-born population - Other South Central Asia (%)
Place of birth for the foreign-born population - Burma (%)
Place of birth for the foreign-born population - Cambodia (%)
Place of birth for the foreign-born population - Indonesia (%)
Place of birth for the foreign-born population - Laos (%)
Place of birth for the foreign-born population - Malaysia (%)
Place of birth for the foreign-born population - Philippines (%)
Place of birth for the foreign-born population - Singapore (%)
Place of birth for the foreign-born population - Thailand (%)
Place of birth for the foreign-born population - Vietnam (%)
Place of birth for the foreign-born population - Other South Eastern Asia (%)
Place of birth for the foreign-born population - Armenia (%)
Place of birth for the foreign-born population - Iraq (%)
Place of birth for the foreign-born population - Israel (%)
Place of birth for the foreign-born population - Jordan (%)
Place of birth for the foreign-born population - Kuwait (%)
Place of birth for the foreign-born population - Lebanon (%)
Place of birth for the foreign-born population - Saudi Arabia (%)
Place of birth for the foreign-born population - Syria (%)
Place of birth for the foreign-born population - Turkey (%)
Place of birth for the foreign-born population - Yemen (%)
Place of birth for the foreign-born population - Other Western Asia (%)
Place of birth for the foreign-born population - Eritrea (%)
Place of birth for the foreign-born population - Ethiopia (%)
Place of birth for the foreign-born population - Kenya (%)
Place of birth for the foreign-born population - Somalia (%)
Place of birth for the foreign-born population - Uganda (%)
Place of birth for the foreign-born population - Zimbabwe (%)
Place of birth for the foreign-born population - Other Eastern Africa (%)
Place of birth for the foreign-born population - Cameroon (%)
Place of birth for the foreign-born population - Congo (%)
Place of birth for the foreign-born population - Democratic Republic of Congo (Zaire) (%)
Place of birth for the foreign-born population - Other Middle Africa (%)
Place of birth for the foreign-born population - Egypt (%)
Place of birth for the foreign-born population - Morocco (%)
Place of birth for the foreign-born population - Sudan (%)
Place of birth for the foreign-born population - Other Northern Africa (%)
Place of birth for the foreign-born population - South Africa (%)
Place of birth for the foreign-born population - Other Southern Africa (%)
Place of birth for the foreign-born population - Cabo Verde (%)
Place of birth for the foreign-born population - Ghana (%)
Place of birth for the foreign-born population - Liberia (%)
Place of birth for the foreign-born population - Nigeria (%)
Place of birth for the foreign-born population - Senegal (%)
Place of birth for the foreign-born population - Sierra Leone (%)
Place of birth for the foreign-born population - Other Western Africa (%)
Place of birth for the foreign-born population - Australia (%)
Place of birth for the foreign-born population - New Zealand (%)
Place of birth for the foreign-born population - Fiji (%)
Place of birth for the foreign-born population - Micronesia (%)
Place of birth for the foreign-born population - Bahamas (%)
Place of birth for the foreign-born population - Barbados (%)
Place of birth for the foreign-born population - Cuba (%)
Place of birth for the foreign-born population - Dominica (%)
Place of birth for the foreign-born population - Dominican Republic (%)
Place of birth for the foreign-born population - Grenada (%)
Place of birth for the foreign-born population - Haiti (%)
Place of birth for the foreign-born population - Jamaica (%)
Place of birth for the foreign-born population - St. Vincent and the Grenadines (%)
Place of birth for the foreign-born population - Trinidad and Tobago (%)
Place of birth for the foreign-born population - West Indies (%)
Place of birth for the foreign-born population - Other Caribbean (%)
Place of birth for the foreign-born population - Belize (%)
Place of birth for the foreign-born population - Costa Rica (%)
Place of birth for the foreign-born population - El Salvador (%)
Place of birth for the foreign-born population - Guatemala (%)
Place of birth for the foreign-born population - Honduras (%)
Place of birth for the foreign-born population - Mexico (%)
Place of birth for the foreign-born population - Nicaragua (%)
Place of birth for the foreign-born population - Panama (%)
Place of birth for the foreign-born population - Other Central America (%)
Place of birth for the foreign-born population - Argentina (%)
Place of birth for the foreign-born population - Bolivia (%)
Place of birth for the foreign-born population - Brazil (%)
Place of birth for the foreign-born population - Chile (%)
Place of birth for the foreign-born population - Colombia (%)
Place of birth for the foreign-born population - Ecuador (%)
Place of birth for the foreign-born population - Guyana (%)
Place of birth for the foreign-born population - Peru (%)
Place of birth for the foreign-born population - Uruguay (%)
Place of birth for the foreign-born population - Venezuela (%)
Place of birth for the foreign-born population - Other South America (%)
Place of birth for the foreign-born population - Canada (%)
Place of birth for the foreign-born population - Other Northern America (%)
Place of birth for the foreign-born population - Other (%)
Latest news about races in Sylvania, OH collected exclusively by city-data.com from local newspapers, TV, and radio stations
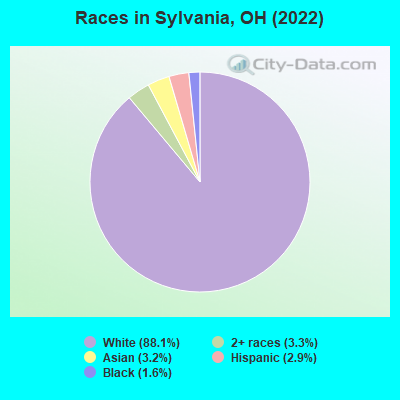
According to 2022 data, the most numerous races in Sylvania, OH are White alone (16,639 residents), Black alone (294 residents), and Two or more races (630 residents). 92.7% of Sylvania residents speak English at home. 5.5% of Sylvania, OH residents are foreign-born (3.8% born in Asia, 0.8% born in Europe), which is 27.1% greater than the foreign-born rate of 4.0% across the entire state of Ohio.
Race distribution in Sylvania
2000 2022
9,538,111 84.0% White alone 1,290,662 11.4% Black alone 217,123 1.9% Hispanic 137,770 1.2% Two or more races 131,670 1.2% Asian alone 21,985 0.2% American Indian alone 13,483 0.1% Other race alone 2,336 0.02% Native Hawaiian and Other
8,948,793 76.1% White alone 1,401,403 11.9% Black alone 529,291 4.5% Two or more races 517,232 4.4% Hispanic 293,387 2.5% Asian alone 52,805 0.4% Other race alone 9,785 0.08% American Indian alone 3,362 0.03% Native Hawaiian and Other
Income and house value in Sylvania Median household income in 2022 $83,585 White non-Hispanic householders$44,340 Black householders$115,980 Two or more races householders$137,889 Hispanic or Latino race householdersMedian 2022 house value $232,915 White Non-Hispanic householders$218,862 Black or African American householders $266,103 Asian householders$224,244 Some other race householders$388,092 Two or more races householders$215,573 Hispanic or Latino householders
Median age by race in Sylvania
44.2 Median age for White residents41.0 46.4 37.3 Median age for Black or African American residents28.1 51.8 -518,174,786.8 Median age for American Indian / Alaska Native residents-525,581,394.8 -658,163,264.6 33.9 Median age for Asian residents25.7 40.1 -800,387,596.1 Median age for Native Hawaiian / Pacific Islander residents-750,242,953.6 -805,394,989.6 16.1 Median age for Other race residents-722,610,721.9 16.0 19.3 Median age for Two or more races residents16.2 22.2 44.1 Median age for White alone residents40.9 46.7 16.1 Median age for Hispanic or Latino residents15.3 16.4
Owner/renter occupied households by race in Sylvania
House owners and renters - White residents 5,871 78.7% Owner occupied1,586 21.3% Renter occupiedHouse owners and renters - Black or African American residents 23 21.5% Owner occupied85 78.5% Renter occupiedHouse owners and renters - Asian residents 131 74.0% Owner occupied46 26.0% Renter occupiedHouse owners and renters - Other race residents 7 100.0% Owner occupiedHouse owners and renters - Two or more races residents 148 86.3% Owner occupied23 13.7% Renter occupiedHouse owners and renters - White alone residents 5,773 78.3% Owner occupied1,596 21.7% Renter occupiedHouse owners and renters - Hispanic or Latino residents 166 90.2% Owner occupied18 9.8% Renter occupied
Language usage in Sylvania
English speakers - Total 92.7% of residents of Sylvania speak English at home.
1.1% of residents speak Spanish at home 192 97.5% Speak English very well5 2.5% Speak English less than very well6.2% of residents speak other language at home 683 62.5% Speak English very well409 37.5% Speak English less than very well
English speakers - Born in the United States 98.2% of residents of Sylvania speak English at home.
0.6% of residents speak Spanish at home 23 92.0% Speak English very well2 8.0% Speak English less than very well1.9% of residents speak other language at home 52 63.4% Speak English very well30 36.6% Speak English less than very well
English speakers - Native, born elsewhere 68.6% of residents of Sylvania speak English at home.
5.8% of residents speak Spanish at home 7 100.0% Speak English very well29.8% of residents speak other language at home 36 100.0% Speak English very well
English speakers - Foreign-born 28.5% of residents of Sylvania speak English at home.
1.1% of residents speak Spanish at home 12 100.0% Speak English very well71.8% of residents speak other language at home 471 60.0% Speak English very well314 40.0% Speak English less than very well
White (Caucasian) - Speak only English Native:
97.1% (14,830)Foreign-born:
23.5% (122)
White (Caucasian) - Speak another language Native:
2.8% (431)Foreign-born:
76.6% (397)
Asian - Speak only English Native:
69.2% (74)Foreign-born:
34.8% (161)
Asian - Speak another language Native:
30.9% (33)Foreign-born:
65.6% (303)
Two or more races - Speak only English Native:
95.3% (523)Foreign-born:
14.0% (8)
Two or more races - Speak another language Native:
4.9% (27)Foreign-born:
79.4% (47)
White alone - Speak only English Native:
97.6% (14,773)Foreign-born:
21.5% (113)
White alone - Speak another language Native:
2.4% (360)Foreign-born:
79.0% (413)
Hispanic or Latino - Speak only English Native:
70.6% (353)Foreign-born:
72.9% (19)
Hispanic or Latino - Speak another language Native:
27.1% (135)Foreign-born:
47.8% (13)
Foreign-born residents in Sylvania 1,037 residents are foreign born (3.8% Asia , 0.8% Europe ).
Marital status for residents in Sylvania Marital status - White (Caucasian) population 15 years and over
Males 25.2% Never married62.6% Now married2.5% Separated3.2% Widowed6.5% DivorcedFemales 21.8% Never married52.8% Now married1.4% Separated10.2% Widowed13.7% DivorcedWomen who gave birth in the past 12 months Now married:
79.7% (166)Unmarried:
20.3% (42)
Women who did not give birth in the past 12 months Now married:
48.2% (1,641)Unmarried:
51.8% (1,766)
Marital status - Black or African American population 15 years and over
Males 39.9% Never married55.2% Now married0.0% Separated1.6% Widowed3.3% DivorcedFemales 18.7% Never married48.2% Now married2.7% Separated3.6% Widowed26.8% DivorcedWomen who did not give birth in the past 12 months Now married:
0.0% (0)Unmarried:
100.0% (38)
Marital status - Asian population 15 years and over
Males 20.7% Never married74.6% Now married4.7% Separated0.0% Widowed0.0% DivorcedFemales 3.8% Never married72.5% Now married0.0% Separated9.4% Widowed14.4% DivorcedWomen who did not give birth in the past 12 months Now married:
90.9% (56)Unmarried:
9.1% (6)
Marital status - Two or more races population 15 years and over
Males 52.9% Never married47.1% Now married0.0% Separated0.0% Widowed0.0% DivorcedFemales 24.8% Never married40.7% Now married11.0% Separated0.0% Widowed23.4% DivorcedWomen who did not give birth in the past 12 months Now married:
46.6% (55)Unmarried:
53.4% (63)
Marital status - White alone, not Hispanic / Latino population 15 years and over
Males 25.1% Never married63.0% Now married2.5% Separated3.3% Widowed6.1% DivorcedFemales 21.8% Never married53.1% Now married1.5% Separated10.2% Widowed13.4% DivorcedWomen who gave birth in the past 12 months Now married:
79.7% (168)Unmarried:
20.3% (43)
Women who did not give birth in the past 12 months Now married:
48.1% (1,636)Unmarried:
51.9% (1,766)
Marital status - Hispanic or Latino population 15 years and over
Males 33.7% Never married37.1% Now married0.0% Separated0.0% Widowed29.2% DivorcedFemales 42.9% Never married31.0% Now married0.0% Separated5.9% Widowed20.2% DivorcedWomen who gave birth in the past 12 months Now married:
100.0% (4)Unmarried:
0.0% (0)
Women who did not give birth in the past 12 months Now married:
23.6% (26)Unmarried:
76.4% (84)
Ancestries in Sylvania
1,961 25.4% German740 9.6% Polish665 8.6% English572 7.4% American519 6.7% Irish380 4.9% European232 3.0% Italian177 2.3% Lebanese146 1.9% Ukrainian124 1.6% Syrian122 1.6% Turkish95 1.2% Hungarian75 1.0% French72 0.9% Scotch-Irish62 0.8% Scottish57 0.7% Norwegian56 0.7% Brazilian56 0.7% Eastern European47 0.6% Greek32 0.4% Israeli32 0.4% Serbian24 0.3% African22 0.3% Russian21 0.3% Slovak20 0.3% Cypriot20 0.3% Czech18 0.2% Dutch16 0.2% Swiss14 0.2% Northern European14 0.2% Swedish12 0.2% Cajun12 0.2% Lithuanian12 0.2% Romanian11 0.1% Welsh10 0.1% French Canadian9 0.1% Canadian7 0.09% Finnish
Children Nativity (place of birth) in Sylvania
Children under 6 years - Living with two parents Both parents native 1,071 100.0% NativeBoth parents foreign-born 19 61.7% Native12 38.3% Foreign-bornOne native, one foreign-born parent 16 100.0% NativeChildren under 6 years - Living with one parent Native parent 211 100.0% NativeForeign-born parent 16 100.0% NativeChildren 6 to 17 years - Living with two parents Both parents native 1,699 97.9% Native37 2.1% Foreign-bornBoth parents foreign-born 68 60.1% Native45 39.9% Foreign-bornOne native, one foreign-born parent 108 59.0% Native75 41.0% Foreign-bornChildren 6 to 17 years - Living with one parent Native parent 780 100.0% NativeForeign-born parent 77 48.6% Native82 51.4% Foreign-born
Grandparents responsible for own grandchildren in Sylvania
Grandparents (30 to 59 years) White / Caucasian 15 28.8% Responsible for grandchildren37 71.2% Not responsible for grandchildrenAsian 13 100.0% Not responsible for grandchildrenWhite alone, not Hispanic / Latino 16 35.0% Responsible for grandchildren29 65.0% Not responsible for grandchildrenHispanic or Latino 8 100.0% Not responsible for grandchildrenGrandparents (60 years and over) White / Caucasian 31 47.8% Responsible for grandchildren33 52.2% Not responsible for grandchildrenAsian 3 100.0% Not responsible for grandchildrenWhite alone, not Hispanic / Latino 31 47.6% Responsible for grandchildren34 52.4% Not responsible for grandchildren