Races in Syracuse, Utah (UT) Detailed Stats
Ancestries, Foreign-born residents, place of birth
Settings
X


Recent posts about races in Syracuse, Utah on our local forum with over 2,400,000 registered users:
 | narrowing down areas- pros and cons! (4 replies) |
| Syracuse - are we crazy for planning to build here? (9 replies) |
| Observations Since Arriving in SLC from Florida (124 replies) |
| Questions about Roy, UT (3 replies) |
| Moving to Ogden for work, having trouble finding a rental (22 replies) |
| Hill afb but live in SLC? (4 replies) |
Latest news about races in Syracuse, UT collected exclusively by city-data.com from local newspapers, TV, and radio stations
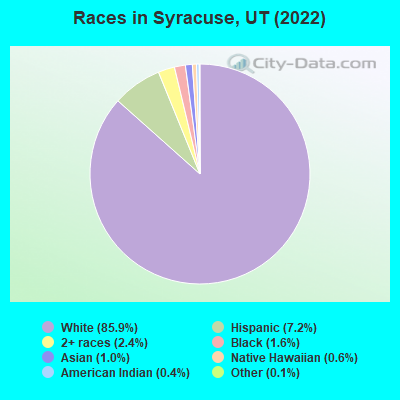
According to 2022 data, the most numerous races in Syracuse, UT are White alone (28,719 residents), Hispanic (2,412 residents), and Two or more races (795 residents). 92.2% of Syracuse residents speak English at home. 2.2% of Syracuse, UT residents are foreign-born (1.4% born in Latin America, 0.4% born in Asia, 0.2% born in Europe), which is 262.3% less than the foreign-born rate of 8.0% across the entire state of Utah.
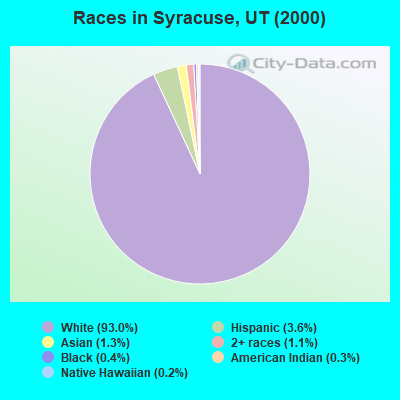
Race distribution in Syracuse
2000
2022

- 8,73993.0%White alone
- 3433.6%Hispanic
- 1261.3%Asian alone
- 1071.1%Two or more races
- 400.4%Black alone
- 240.3%American Indian alone
- 180.2%Native Hawaiian and Other
Pacific Islander alone - 10.01%Other race alone
-
- 28,71985.9%White alone
- 2,4127.2%Hispanic
- 7952.4%Two or more races
- 5291.6%Black alone
- 3181.0%Asian alone
- 1970.6%Native Hawaiian and Other
Pacific Islander alone - 1480.4%American Indian alone
- 430.1%Other race alone
2000
2022
-
- 1,904,26585.3%White alone
- 201,5599.0%Hispanic
- 36,4831.6%Asian alone
- 31,3081.4%Two or more races
- 26,6631.2%American Indian alone
- 14,8060.7%Native Hawaiian and Other
Pacific Islander alone - 16,1370.7%Black alone
- 1,9480.09%Other race alone

-
- 2,557,46675.6%White alone
- 512,08615.1%Hispanic
- 119,3083.5%Two or more races
- 82,3882.4%Asian alone
- 36,9781.1%Native Hawaiian and Other
Pacific Islander alone - 34,8731.0%Black alone
- 22,8030.7%American Indian alone
- 14,8980.4%Other race alone

Income and house value in Syracuse
- Median household income in 2022
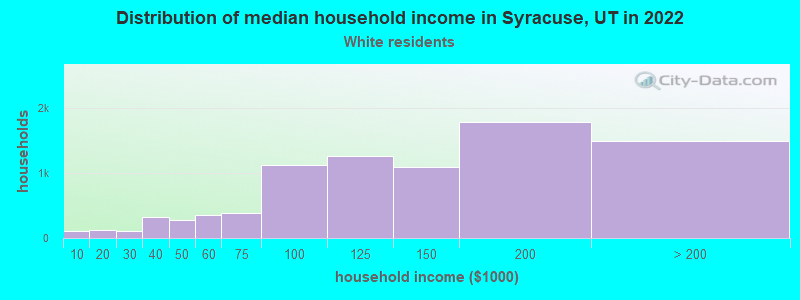
- $127,741White non-Hispanic householders
- $116,085Asian householders
- $71,499Some other race householders
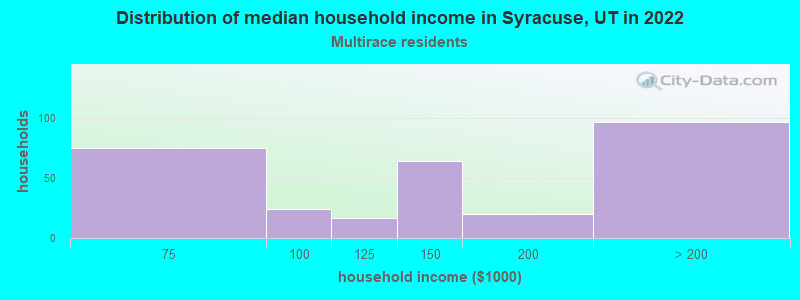
- $168,957Two or more races householders
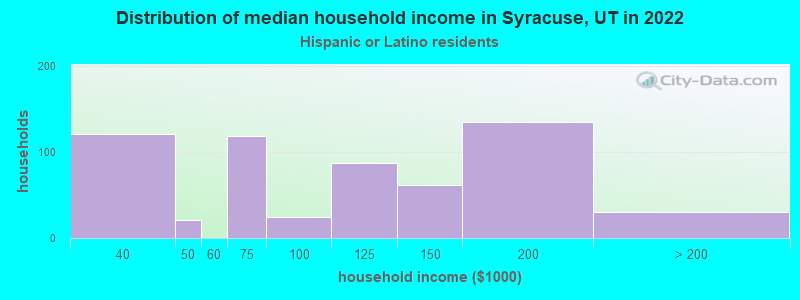
- $107,473Hispanic or Latino race householders
- Median 2022 house value
- $586,564White Non-Hispanic householders
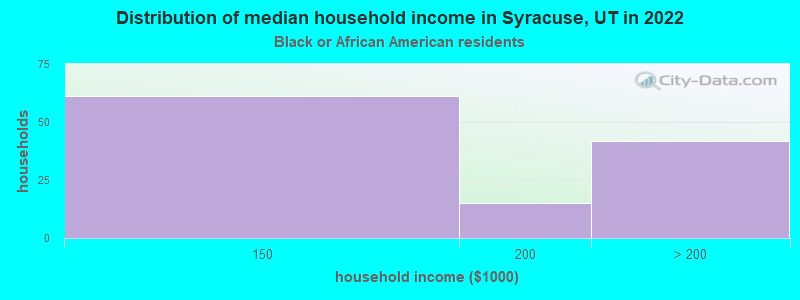
- $594,985Black or African American householders
- $579,607Asian householders
- $542,626Native Hawaiian and other Pacific Islander householders
- $503,449Some other race householders
- $478,185Two or more races householders
- $503,449Hispanic or Latino householders
Household income for White non-Hispanic householders
Household income for Black householders
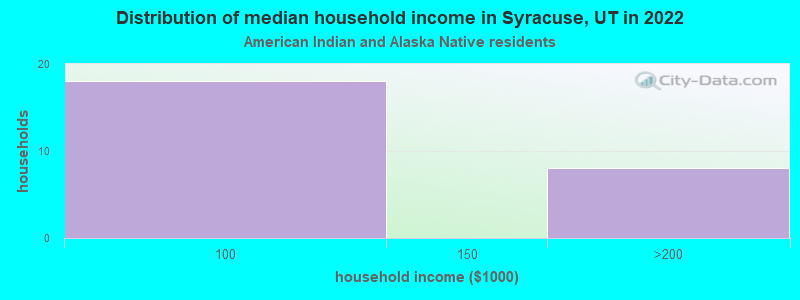
Household income for American Indian and Alaska Native householders
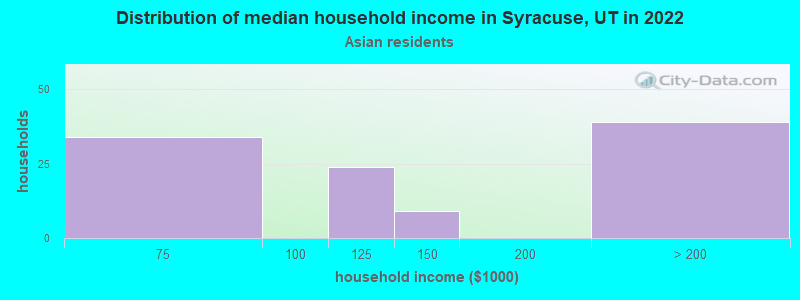
Household income for Asian householders
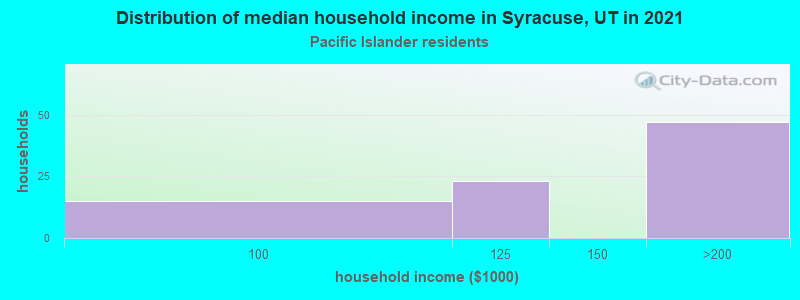
Household income for Native Hawaiian and other Pacific Islander householders
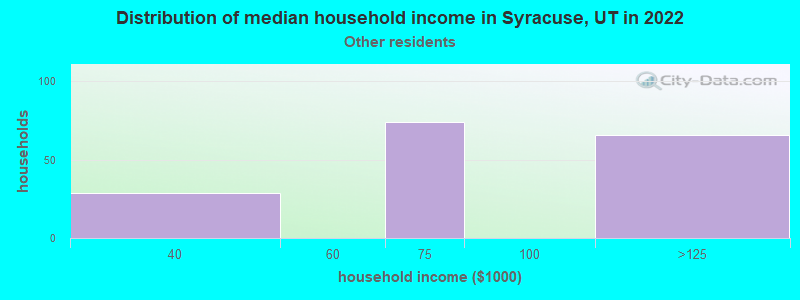
Household income for Some other race householders
Household income for Two or more races householders
Household income for Hispanic or Latino race householders
Median age by race in Syracuse
- 29.2Median age for White residents
- 30.0Males
- 28.7Females
- 18.5Median age for Black or African American residents
- 45.3Males
- 17.7Females
- 34.9Median age for American Indian / Alaska Native residents
- 25.1Males
- 24.4Females
- 53.8Median age for Asian residents
- 55.0Males
- 52.0Females
- 19.6Median age for Native Hawaiian / Pacific Islander residents
- 27.6Males
- -383,116,882.7Females
- 37.6Median age for Other race residents
- 47.3Males
- 30.0Females
- 16.7Median age for Two or more races residents
- 17.2Males
- 15.9Females
- 29.7Median age for White alone residents
- 30.7Males
- 28.6Females
- 23.8Median age for Hispanic or Latino residents
- 23.2Males
- 29.4Females
Owner/renter occupied households by race in Syracuse
- House owners and renters - White residents
- 7,73992.6%Owner occupied
- 6207.4%Renter occupied
- House owners and renters - Black or African American residents
- 81100.0%Owner occupied
- House owners and renters - American Indian / Alaska Native residents
- 23100.0%Owner occupied
- House owners and renters - Asian residents
- 71100.0%Owner occupied
- House owners and renters - Native Hawaiian / Pacific Islander residents
- 67100.0%Owner occupied
- House owners and renters - Other race residents
- 17686.0%Owner occupied
- 2914.0%Renter occupied
- House owners and renters - Two or more races residents
- 22594.9%Owner occupied
- 125.1%Renter occupied
- House owners and renters - White alone residents
- 7,55092.6%Owner occupied
- 6047.4%Renter occupied
- House owners and renters - Hispanic or Latino residents
- 44393.3%Owner occupied
- 326.7%Renter occupied
Language usage in Syracuse
- English speakers - Total
- 92.2% of residents of Syracuse speak English at home.
- 5.2% of residents speak Spanish at home
- 1,29280.3%Speak English very well
- 31719.7%Speak English less than very well
- 2.3% of residents speak other language at home
- 55876.2%Speak English very well
- 17423.8%Speak English less than very well
- English speakers - Born in the United States
- 90.4% of residents of Syracuse speak English at home.
- 6.2% of residents speak Spanish at home
- 59099.2%Speak English very well
- 50.8%Speak English less than very well
- 3.5% of residents speak other language at home
- 21864.5%Speak English very well
- 12035.5%Speak English less than very well
- English speakers - Native, born elsewhere
- 88.5% of residents of Syracuse speak English at home.
- 7.4% of residents speak other language at home
- 33100.0%Speak English very well
- English speakers - Foreign-born
- 6.5% of residents of Syracuse speak English at home.
- 62.2% of residents speak Spanish at home
- 13939.2%Speak English very well
- 21660.8%Speak English less than very well
- 31.7% of residents speak other language at home
- 14881.8%Speak English very well
- 3318.2%Speak English less than very well
White (Caucasian) - Speak only English
| Native: | 95.6% (26,846) |
| Foreign-born: | 24.0% (26) |
White (Caucasian) - Speak another language
| Native: | 4.4% (1,224) |
| Foreign-born: | 76.0% (81) |
Asian - Speak only English
| Native: | 76.7% (184) |
| Foreign-born: | 4.0% (5) |
Asian - Speak another language
| Native: | 9.1% (22) |
| Foreign-born: | 100.0% (114) |
Native Hawaiian / Pacific Islander - Speak another language
| Native: | 31.9% (40) |
| Foreign-born: | 100.0% (22) |
Other race - Speak another language
| Native: | 82.9% (238) |
| Foreign-born: | 90.7% (307) |
Two or more races - Speak another language
| Native: | 22.9% (289) |
| Foreign-born: | 100.0% (16) |
White alone - Speak only English
| Native: | 95.8% (25,947) |
| Foreign-born: | 41.7% (30) |
White alone - Speak another language
| Native: | 4.3% (1,170) |
| Foreign-born: | 61.6% (45) |
Hispanic or Latino - Speak another language
| Native: | 34.0% (588) |
| Foreign-born: | 100.0% (389) |
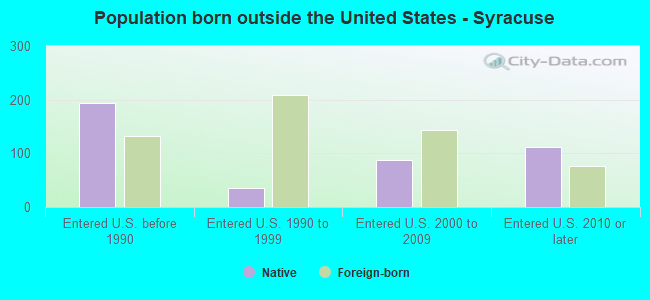
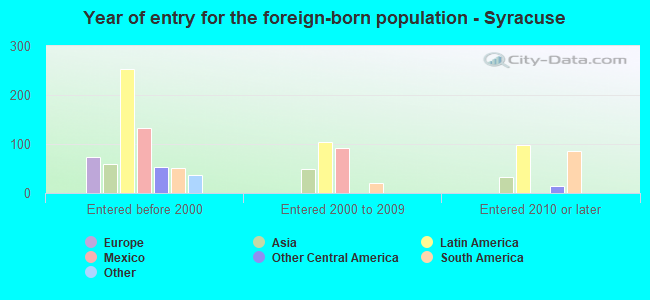
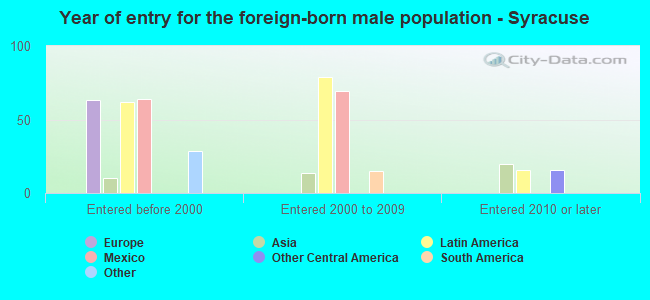
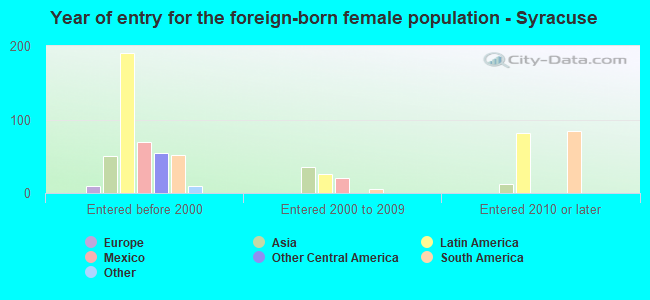
Foreign-born residents in Syracuse
738 residents are foreign born (1.4% Latin America, 0.4% Asia, 0.2% Europe).
| This city: | 2.2% |
| Utah: | 8.4% |

Marital status for residents in Syracuse
Marital status - White (Caucasian) population 15 years and over
- Males
- 29.7%Never married
- 62.1%Now married
- 0.7%Separated
- 1.9%Widowed
- 5.6%Divorced
- Females
- 24.1%Never married
- 63.0%Now married
- 0.8%Separated
- 4.5%Widowed
- 7.6%Divorced
Women who gave birth in the past 12 months
| Now married: | 100.0% (373) |
| Unmarried: | 0.0% (0) |
Women who did not give birth in the past 12 months
| Now married: | 55.7% (3,849) |
| Unmarried: | 44.3% (3,060) |
Marital status - Black or African American population 15 years and over
- Males
- 33.3%Never married
- 66.7%Now married
- 0.0%Separated
- 0.0%Widowed
- 0.0%Divorced
- Females
- 40.6%Never married
- 59.4%Now married
- 0.0%Separated
- 0.0%Widowed
- 0.0%Divorced
Women who did not give birth in the past 12 months
| Now married: | 52.6% (90) |
| Unmarried: | 47.4% (81) |
Marital status - American Indian / Alaska Native population 15 years and over
- Males
- 63.2%Never married
- 36.8%Now married
- 0.0%Separated
- 0.0%Widowed
- 0.0%Divorced
- Females
- 0.0%Never married
- 100.0%Now married
- 0.0%Separated
- 0.0%Widowed
- 0.0%Divorced
Women who did not give birth in the past 12 months
| Now married: | 100.0% (83) |
| Unmarried: | 0.0% (0) |
Marital status - Asian population 15 years and over
- Males
- 46.7%Never married
- 22.5%Now married
- 0.0%Separated
- 0.0%Widowed
- 30.8%Divorced
- Females
- 13.3%Never married
- 57.2%Now married
- 0.0%Separated
- 15.1%Widowed
- 14.5%Divorced
Women who did not give birth in the past 12 months
| Now married: | 61.6% (50) |
| Unmarried: | 38.4% (31) |
Marital status - Other race population 15 years and over
- Males
- 35.7%Never married
- 64.3%Now married
- 0.0%Separated
- 0.0%Widowed
- 0.0%Divorced
- Females
- 6.8%Never married
- 68.3%Now married
- 0.0%Separated
- 24.9%Widowed
- 0.0%Divorced
Women who did not give birth in the past 12 months
| Now married: | 87.8% (114) |
| Unmarried: | 12.2% (16) |
Marital status - Two or more races population 15 years and over
- Males
- 55.5%Never married
- 44.5%Now married
- 0.0%Separated
- 0.0%Widowed
- 0.0%Divorced
- Females
- 26.7%Never married
- 64.9%Now married
- 0.0%Separated
- 0.0%Widowed
- 8.4%Divorced
Women who gave birth in the past 12 months
| Now married: | 100.0% (29) |
| Unmarried: | 0.0% (0) |
Women who did not give birth in the past 12 months
| Now married: | 62.5% (246) |
| Unmarried: | 37.5% (148) |
Marital status - White alone, not Hispanic / Latino population 15 years and over
- Males
- 29.4%Never married
- 62.5%Now married
- 0.7%Separated
- 1.8%Widowed
- 5.6%Divorced
- Females
- 24.0%Never married
- 63.1%Now married
- 0.8%Separated
- 4.6%Widowed
- 7.4%Divorced
Women who gave birth in the past 12 months
| Now married: | 100.0% (375) |
| Unmarried: | 0.0% (0) |
Women who did not give birth in the past 12 months
| Now married: | 55.5% (3,686) |
| Unmarried: | 44.5% (2,958) |
Marital status - Hispanic or Latino population 15 years and over
- Males
- 35.6%Never married
- 58.4%Now married
- 0.0%Separated
- 2.7%Widowed
- 3.3%Divorced
- Females
- 18.6%Never married
- 66.9%Now married
- 0.0%Separated
- 8.8%Widowed
- 5.7%Divorced
Women who gave birth in the past 12 months
| Now married: | 100.0% (13) |
| Unmarried: | 0.0% (0) |
Women who did not give birth in the past 12 months
| Now married: | 70.5% (382) |
| Unmarried: | 29.5% (160) |
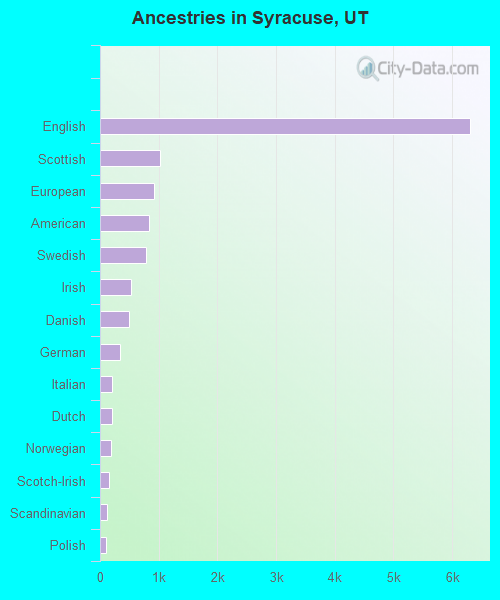
Ancestries in Syracuse

- 6,31242.2%English
- 1,0276.9%Scottish
- 9236.2%European
- 8415.6%American
- 7815.2%Swedish
- 5273.5%Irish
- 4863.2%Danish
- 3432.3%German
- 2111.4%Italian
- 1971.3%Dutch
- 1951.3%Norwegian
- 1461.0%Scotch-Irish
- 1270.8%Scandinavian
- 1070.7%Polish
- 530.4%Greek
- 500.3%British
- 320.2%French
- 310.2%Welsh
- 220.1%Portuguese
- 200.1%Canadian
- 200.1%Northern European
- 180.1%Ukrainian
- 130.09%Belgian
- 130.09%Trinidadian and Tobagonian
- 120.08%Syrian
- 110.07%Swiss
- 100.07%Russian
- 90.06%Armenian
- 80.05%Eastern European
- 60.04%Albanian
- 60.04%African
- 50.03%Croatian
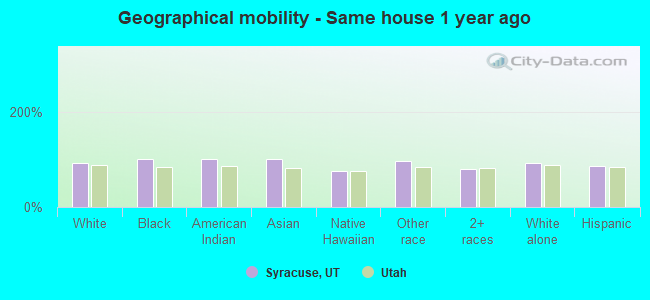
Geographical mobility in Syracuse

- Same house 1 year ago
- 27,33093.0%White (Caucasian)
- 465100.0%Black or African American
- 195100.0%American Indian / Alaska Native
- 338100.0%Asian
- 13074.7%Native Hawaiian / Pacific Islander
- 73897.2%Other race
- 1,14478.9%Two or more races
- 26,38293.1%White alone, not Hispanic / Latino
- 2,01984.9%Hispanic or Latino
-
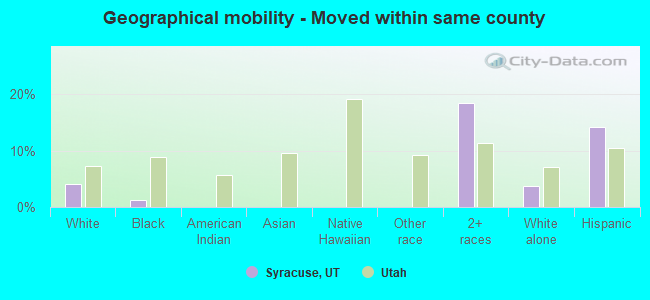
- Moved within same county
- 1,2144.1%White / Caucasian
- 61.2%Black or African American
- 26818.5%Two or more races
- 1,0753.8%White alone, not Hispanic / Latino
- 33714.2%Hispanic or Latino
-
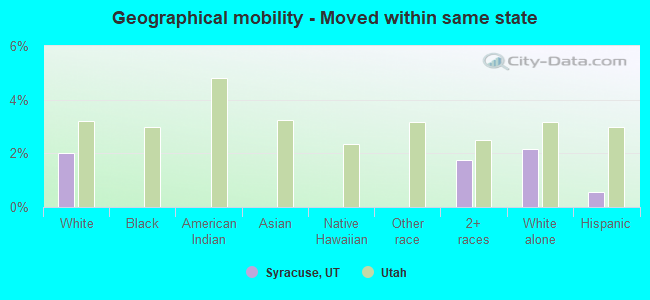
- Moved within same state
- 5942.0%White / Caucasian
- 251.7%Two or more races
- 6172.2%White alone, not Hispanic / Latino
- 140.6%Hispanic or Latino
-
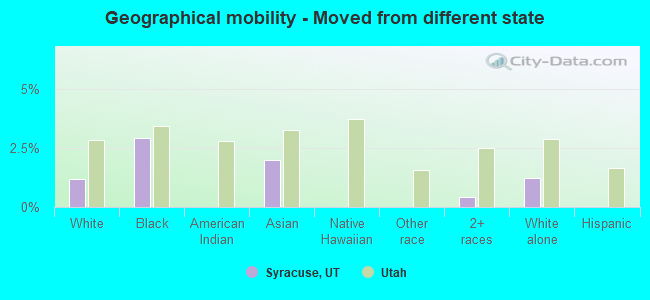
- Moved from different state
- 3471.2%White / Caucasian
- 132.9%Black or African American
- 72.0%Asian
- 60.4%Two or more races
- 3421.2%White alone, not Hispanic / Latino
-
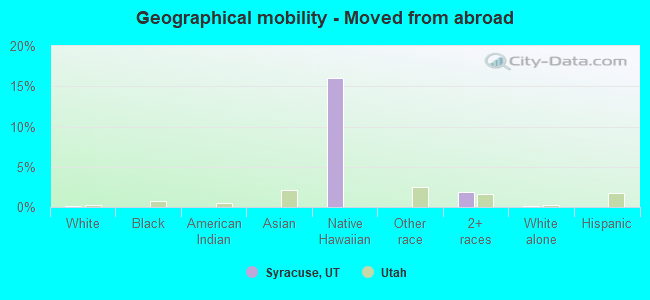
- Moved from abroad
- 220.1%White
- 2816.1%Native Hawaiian / Pacific Islander
- 281.9%Two or more races
- 220.1%White alone, not Hispanic / Latino
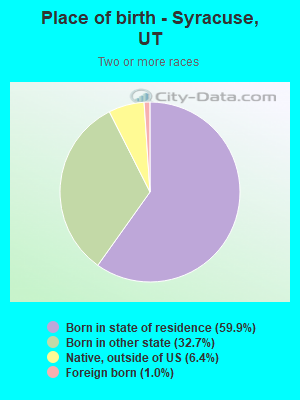
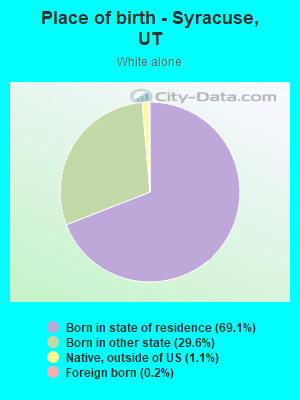
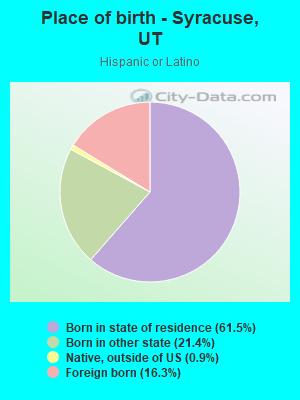
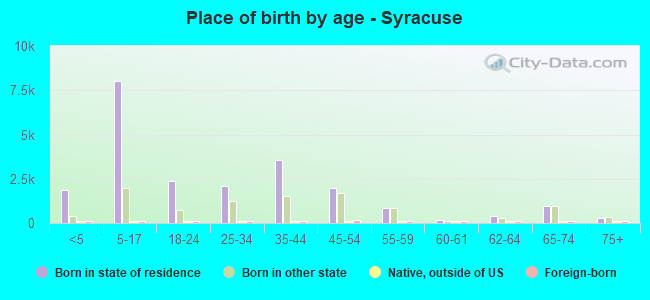
Children Nativity (place of birth) in Syracuse
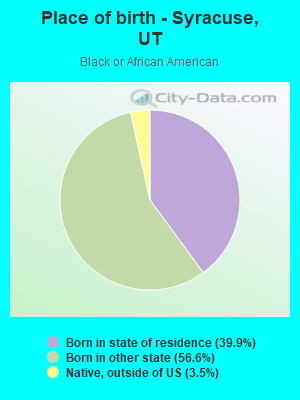
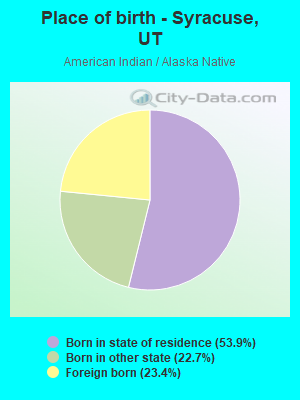
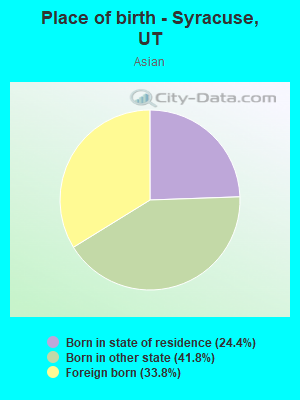
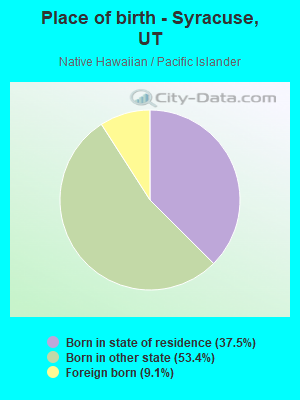
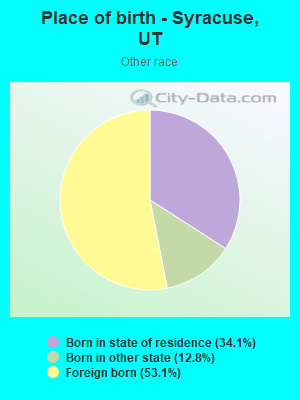
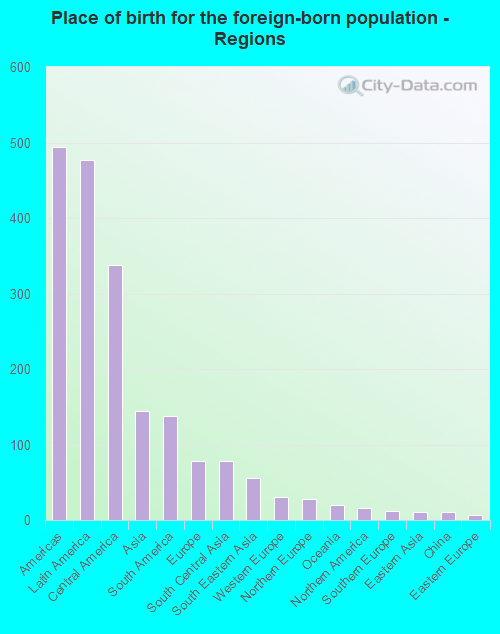
Place of birth for residents in Syracuse
![Place of birth for the foreign-born population - Regions]()
- 494Americas
- 477Latin America
- 338Central America
- 145Asia
- 138South America
- 78Europe
- 78South Central Asia
- 56South Eastern Asia
- 30Western Europe
- 28Northern Europe
- 20Oceania
- 16Northern America
- 12Southern Europe
- 10Eastern Asia
- 10China
- 6Eastern Europe
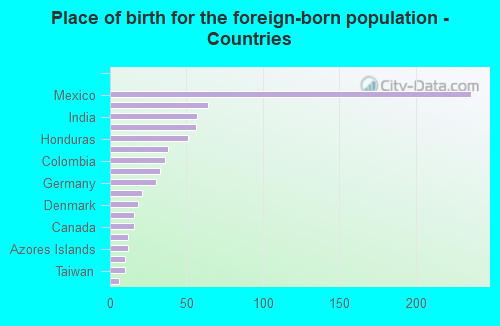
![Place of birth for the foreign-born population - Countries]()
- 236Mexico
- 64Venezuela
- 57India
- 56Philippines
- 51Honduras
- 38Chile
- 36Colombia
- 33El Salvador
- 30Germany
- 21Uzbekistan
- 18Denmark
- 16Guatemala
- 16Canada
- 12Portugal
- 12Azores Islands
- 10England
- 10Taiwan
- 6Belarus
Grandparents responsible for own grandchildren in Syracuse
Zip codes: 84075.