Races in Table Rock, Missouri (MO) Detailed Stats
Ancestries, Foreign-born residents, place of birth

Recent posts about races in Table Rock, Missouri on our local forum with over 2,400,000 registered users:
 | table rock vs loto (5 replies) |
| What is living in SW MO like? (27 replies) |
| OVER THE FENCE COFFEE CLUB Part II (492 replies) |
| From Florida to Missouri (8 replies) |
| would we fit in Springfield, MO??? (35 replies) |
| Is Springfield, Mo really that racist? (186 replies) |
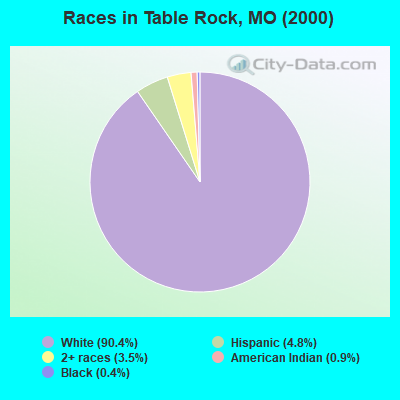
Race distribution in Table Rock

- 20790.4%White alone
- 114.8%Hispanic
- 83.5%Two or more races
- 20.9%American Indian alone
- 10.4%Black alone
2000
2022
-
- 4,686,47483.8%White alone
- 625,66711.2%Black alone
- 118,5922.1%Hispanic
- 71,9051.3%Two or more races
- 61,0411.1%Asian alone
- 23,3020.4%American Indian alone
- 5,2910.09%Other race alone
- 2,9390.05%Native Hawaiian and Other
Pacific Islander alone

-
- 4,733,41176.6%White alone
- 656,73910.6%Black alone
- 316,3005.1%Two or more races
- 291,7634.7%Hispanic
- 132,4362.1%Asian alone
- 27,4670.4%Other race alone
- 12,3130.2%American Indian alone
- 7,5280.1%Native Hawaiian and Other
Pacific Islander alone

Income and house value in Table Rock
- Median household income in 2022
- $84,747White non-Hispanic householders
- $67,589American Indian and Alaska Native householders
- $69,919Two or more races householders
- $63,681Hispanic or Latino race householders
- Median 2022 house value
- $335,729White Non-Hispanic householders
- $227,816American Indian or Alaska Native householders
- $155,874Hispanic or Latino householders
Household income for White non-Hispanic householders

Household income for American Indian and Alaska Native householders

Household income for Two or more races householders

Household income for Hispanic or Latino race householders

Ancestries in Table Rock

- 6527.5%German
- 3514.8%Irish
- 3414.4%English
- 2711.4%Other
- 177.2%United States
- 104.2%French
- 83.4%French Canadian
- 83.4%Norwegian
- 73.0%Polish
- 62.5%Scotch-Irish
- 62.5%Swedish
- 31.3%Dutch
- 31.3%Hungarian
- 31.3%Italian
- 20.8%Welsh
- 10.4%Russian
- 10.4%Scottish

Zip codes: 65616.