Races in Tacoma, Washington (WA) Detailed Stats
Data:
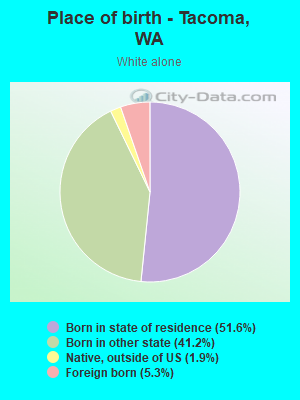
Races - White alone (%)
Races - White alone (% change since 2000)
Races - Black alone (%)
Races - Black alone (% change since 2000)
Races - American Indian alone (%)
Races - American Indian alone (% change since 2000)
Races - Asian alone (%)
Races - Asian alone (% change since 2000)
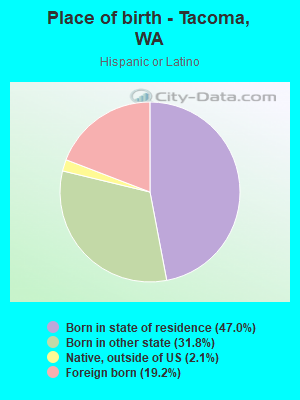
Races - Hispanic (%)
Races - Hispanic (% change since 2000)
Races - Native Hawaiian and Other Pacific Islander alone (%)
Races - Native Hawaiian and Other Pacific Islander alone (% change since 2000)
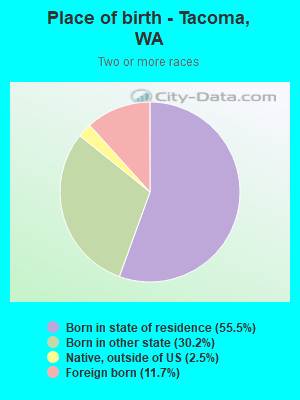
Races - Two or more races(%)
Races - Two or more races(% change since 2000)
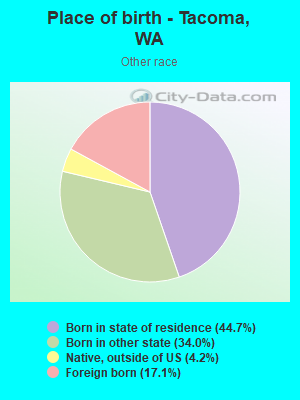
Races - Other race alone (%)
Races - Other race alone (% change since 2000)
Racial diversity
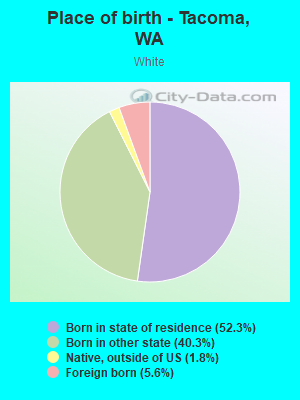
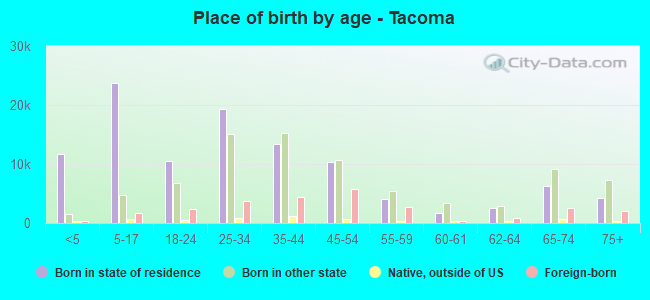
Place of birth - Born in state of residence (%)
Place of birth - Born in state of residence (%) - White
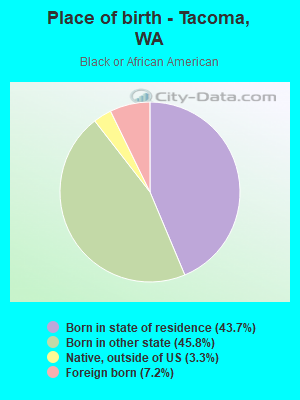
Place of birth - Born in state of residence (%) - Black or African American
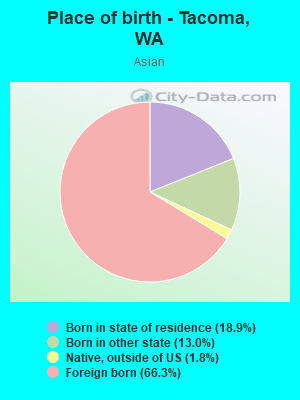
Place of birth - Born in state of residence (%) - Asian
Place of birth - Born in state of residence (%) - Hispanic or Latino
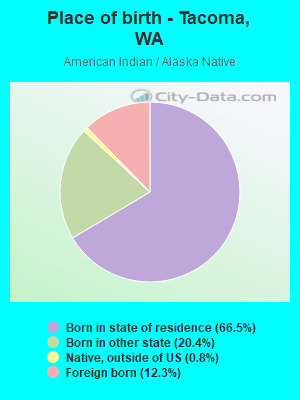
Place of birth - Born in state of residence (%) - American Indian and Alaska Native
Place of birth - Born in state of residence (%) - Multirace
Place of birth - Born in state of residence (%) - Other Race
Place of birth - Born in other state (%)
Place of birth - Born in other state (%) - White
Place of birth - Born in other state (%) - Black or African American
Place of birth - Born in other state (%) - Asian
Place of birth - Born in other state (%) - Hispanic or Latino
Place of birth - Born in other state (%) - American Indian and Alaska Native
Place of birth - Born in other state (%) - Multirace
Place of birth - Born in other state (%) - Other Race
Place of birth - Native, outside of US (%)
Place of birth - Native, outside of US (%) - White
Place of birth - Native, outside of US (%) - Black or African American
Place of birth - Native, outside of US (%) - Asian
Place of birth - Native, outside of US (%) - Hispanic or Latino
Place of birth - Native, outside of US (%) - American Indian and Alaska Native
Place of birth - Native, outside of US (%) - Multirace
Place of birth - Native, outside of US (%) - Other Race
Place of birth - Foreign born (%)
Place of birth - Foreign born (%) - White
Place of birth - Foreign born (%) - Black or African American
Place of birth - Foreign born (%) - Asian
Place of birth - Foreign born (%) - Hispanic or Latino
Place of birth - Foreign born (%) - American Indian and Alaska Native
Place of birth - Foreign born (%) - Multirace
Place of birth - Foreign born (%) - Other Race
Residents speaking English at home (%)
Residents speaking English at home - Born in the United States (%)
Residents speaking English at home - Native, born elsewhere (%)
Residents speaking English at home - Foreign born (%)
Residents speaking Spanish at home (%)
Residents speaking Spanish at home - Born in the United States (%)
Residents speaking Spanish at home - Native, born elsewhere (%)
Residents speaking Spanish at home - Foreign born (%)
Residents speaking other language at home (%)
Residents speaking other language at home - Born in the United States (%)
Residents speaking other language at home - Native, born elsewhere (%)
Residents speaking other language at home - Foreign born (%)
Marital status - Never married (%)
Marital status - Now married (%)
Marital status - Separated (%)
Marital status - Widowed (%)
Marital status - Divorced (%)
Ancestries Reported - Arab (%)
Ancestries Reported - Czech (%)
Ancestries Reported - Danish (%)
Ancestries Reported - Dutch (%)
Ancestries Reported - English (%)
Ancestries Reported - French (%)
Ancestries Reported - French Canadian (%)
Ancestries Reported - German (%)
Ancestries Reported - Greek (%)
Ancestries Reported - Hungarian (%)
Ancestries Reported - Irish (%)
Ancestries Reported - Italian (%)
Ancestries Reported - Lithuanian (%)
Ancestries Reported - Norwegian (%)
Ancestries Reported - Polish (%)
Ancestries Reported - Portuguese (%)
Ancestries Reported - Russian (%)
Ancestries Reported - Scotch-Irish (%)
Ancestries Reported - Scottish (%)
Ancestries Reported - Slovak (%)
Ancestries Reported - Subsaharan African (%)
Ancestries Reported - Swedish (%)
Ancestries Reported - Swiss (%)
Ancestries Reported - Ukrainian (%)
Ancestries Reported - United States (%)
Ancestries Reported - Welsh (%)
Ancestries Reported - West Indian (%)
Ancestries Reported - Other (%)
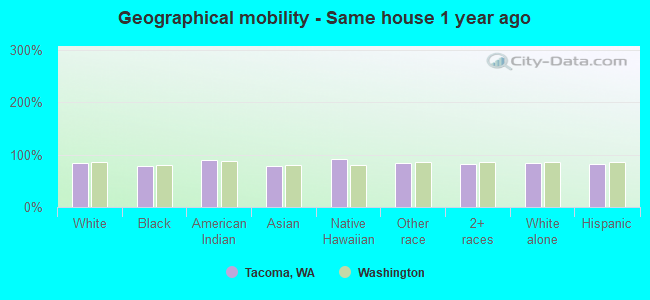
Geographical mobility - Same house 1 year ago (%)
Geographical mobility - Same house 1 year ago (%) - White
Geographical mobility - Same house 1 year ago (%) - Black or African American
Geographical mobility - Same house 1 year ago (%) - Asian
Geographical mobility - Same house 1 year ago (%) - Hispanic or Latino
Geographical mobility - Same house 1 year ago (%) - American Indian and Alaska Native
Geographical mobility - Same house 1 year ago (%) - Multirace
Geographical mobility - Same house 1 year ago (%) - Other Race
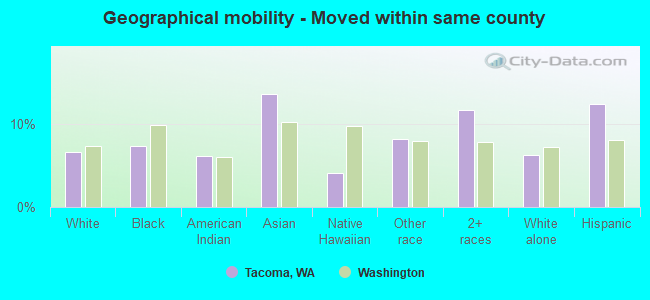
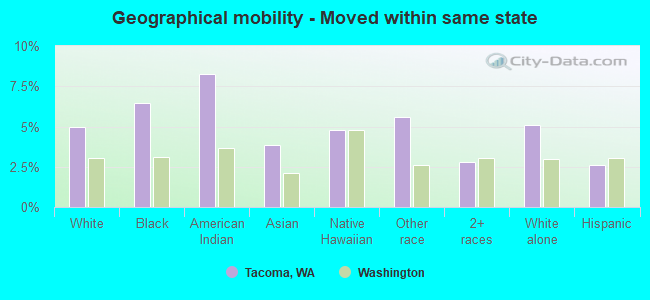
Geographical mobility - Moved within same county (%)
Geographical mobility - Moved within same county (%) - White
Geographical mobility - Moved within same county (%) - Black or African American
Geographical mobility - Moved within same county (%) - Asian
Geographical mobility - Moved within same county (%) - Hispanic or Latino
Geographical mobility - Moved within same county (%) - American Indian and Alaska Native
Geographical mobility - Moved within same county (%) - Multirace
Geographical mobility - Moved within same county (%) - Other Race
Geographical mobility - Moved from different county within same state (%)
Geographical mobility - Moved from different county within same state (%) - White
Geographical mobility - Moved from different county within same state (%) - Black or African American
Geographical mobility - Moved from different county within same state (%) - Asian
Geographical mobility - Moved from different county within same state (%) - Hispanic or Latino
Geographical mobility - Moved from different county within same state (%) - American Indian and Alaska Native
Geographical mobility - Moved from different county within same state (%) - Multirace
Geographical mobility - Moved from different county within same state (%) - Other Race
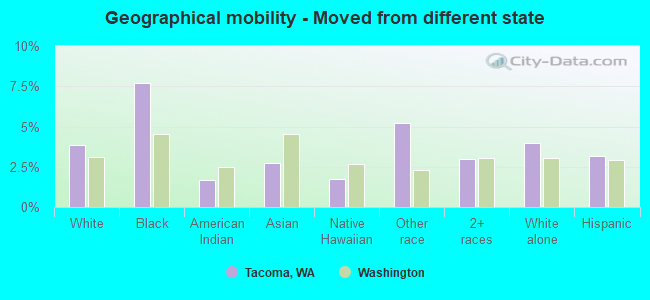
Geographical mobility - Moved from different state (%)
Geographical mobility - Moved from different state (%) - White
Geographical mobility - Moved from different state (%) - Black or African American
Geographical mobility - Moved from different state (%) - Asian
Geographical mobility - Moved from different state (%) - Hispanic or Latino
Geographical mobility - Moved from different state (%) - American Indian and Alaska Native
Geographical mobility - Moved from different state (%) - Multirace
Geographical mobility - Moved from different state (%) - Other Race
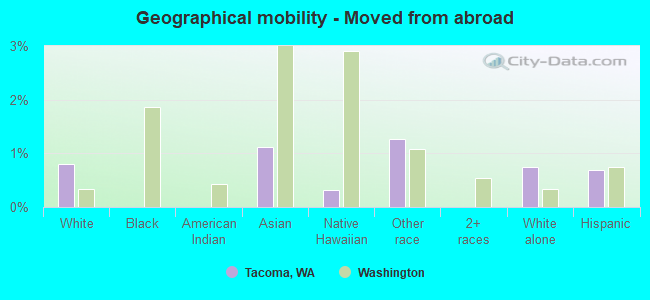
Geographical mobility - Moved from abroad (%)
Geographical mobility - Moved from abroad (%) - White
Geographical mobility - Moved from abroad (%) - Black or African American
Geographical mobility - Moved from abroad (%) - Asian
Geographical mobility - Moved from abroad (%) - Hispanic or Latino
Geographical mobility - Moved from abroad (%) - American Indian and Alaska Native
Geographical mobility - Moved from abroad (%) - Multirace
Geographical mobility - Moved from abroad (%) - Other Race
Place of birth for the foreign-born population - Ireland (%)
Place of birth for the foreign-born population - Denmark (%)
Place of birth for the foreign-born population - Norway (%)
Place of birth for the foreign-born population - Sweden (%)
Place of birth for the foreign-born population - United Kingdom (%)
Place of birth for the foreign-born population - England (%)
Place of birth for the foreign-born population - Scotland (%)
Place of birth for the foreign-born population - Other Northern Europe (%)
Place of birth for the foreign-born population - Austria (%)
Place of birth for the foreign-born population - Belgium (%)
Place of birth for the foreign-born population - France (%)
Place of birth for the foreign-born population - Germany (%)
Place of birth for the foreign-born population - Netherlands (%)
Place of birth for the foreign-born population - Switzerland (%)
Place of birth for the foreign-born population - Other Western Europe (%)
Place of birth for the foreign-born population - Greece (%)
Place of birth for the foreign-born population - Italy (%)
Place of birth for the foreign-born population - Portugal (%)
Place of birth for the foreign-born population - Spain (%)
Place of birth for the foreign-born population - Other Southern Europe (%)
Place of birth for the foreign-born population - Albania (%)
Place of birth for the foreign-born population - Belarus (%)
Place of birth for the foreign-born population - Bosnia and Herzegovina (%)
Place of birth for the foreign-born population - Bulgaria (%)
Place of birth for the foreign-born population - Croatia (%)
Place of birth for the foreign-born population - Czechoslovakia (%)
Place of birth for the foreign-born population - Hungary (%)
Place of birth for the foreign-born population - Latvia (%)
Place of birth for the foreign-born population - Lithuania (%)
Place of birth for the foreign-born population - North Macedonia (Macedonia) (%)
Place of birth for the foreign-born population - Moldova (%)
Place of birth for the foreign-born population - Poland (%)
Place of birth for the foreign-born population - Romania (%)
Place of birth for the foreign-born population - Russia (%)
Place of birth for the foreign-born population - Serbia (%)
Place of birth for the foreign-born population - Ukraine (%)
Place of birth for the foreign-born population - Other Eastern Europe (%)
Place of birth for the foreign-born population - China (%)
Place of birth for the foreign-born population - Hong Kong (%)
Place of birth for the foreign-born population - Taiwan (%)
Place of birth for the foreign-born population - Japan (%)
Place of birth for the foreign-born population - Korea (%)
Place of birth for the foreign-born population - Other Eastern Asia (%)
Place of birth for the foreign-born population - Afghanistan (%)
Place of birth for the foreign-born population - Bangladesh (%)
Place of birth for the foreign-born population - India (%)
Place of birth for the foreign-born population - Iran (%)
Place of birth for the foreign-born population - Kazakhstan (%)
Place of birth for the foreign-born population - Nepal (%)
Place of birth for the foreign-born population - Pakistan (%)
Place of birth for the foreign-born population - Sri Lanka (%)
Place of birth for the foreign-born population - Uzbekistan (%)
Place of birth for the foreign-born population - Other South Central Asia (%)
Place of birth for the foreign-born population - Burma (%)
Place of birth for the foreign-born population - Cambodia (%)
Place of birth for the foreign-born population - Indonesia (%)
Place of birth for the foreign-born population - Laos (%)
Place of birth for the foreign-born population - Malaysia (%)
Place of birth for the foreign-born population - Philippines (%)
Place of birth for the foreign-born population - Singapore (%)
Place of birth for the foreign-born population - Thailand (%)
Place of birth for the foreign-born population - Vietnam (%)
Place of birth for the foreign-born population - Other South Eastern Asia (%)
Place of birth for the foreign-born population - Armenia (%)
Place of birth for the foreign-born population - Iraq (%)
Place of birth for the foreign-born population - Israel (%)
Place of birth for the foreign-born population - Jordan (%)
Place of birth for the foreign-born population - Kuwait (%)
Place of birth for the foreign-born population - Lebanon (%)
Place of birth for the foreign-born population - Saudi Arabia (%)
Place of birth for the foreign-born population - Syria (%)
Place of birth for the foreign-born population - Turkey (%)
Place of birth for the foreign-born population - Yemen (%)
Place of birth for the foreign-born population - Other Western Asia (%)
Place of birth for the foreign-born population - Eritrea (%)
Place of birth for the foreign-born population - Ethiopia (%)
Place of birth for the foreign-born population - Kenya (%)
Place of birth for the foreign-born population - Somalia (%)
Place of birth for the foreign-born population - Uganda (%)
Place of birth for the foreign-born population - Zimbabwe (%)
Place of birth for the foreign-born population - Other Eastern Africa (%)
Place of birth for the foreign-born population - Cameroon (%)
Place of birth for the foreign-born population - Congo (%)
Place of birth for the foreign-born population - Democratic Republic of Congo (Zaire) (%)
Place of birth for the foreign-born population - Other Middle Africa (%)
Place of birth for the foreign-born population - Egypt (%)
Place of birth for the foreign-born population - Morocco (%)
Place of birth for the foreign-born population - Sudan (%)
Place of birth for the foreign-born population - Other Northern Africa (%)
Place of birth for the foreign-born population - South Africa (%)
Place of birth for the foreign-born population - Other Southern Africa (%)
Place of birth for the foreign-born population - Cabo Verde (%)
Place of birth for the foreign-born population - Ghana (%)
Place of birth for the foreign-born population - Liberia (%)
Place of birth for the foreign-born population - Nigeria (%)
Place of birth for the foreign-born population - Senegal (%)
Place of birth for the foreign-born population - Sierra Leone (%)
Place of birth for the foreign-born population - Other Western Africa (%)
Place of birth for the foreign-born population - Australia (%)
Place of birth for the foreign-born population - New Zealand (%)
Place of birth for the foreign-born population - Fiji (%)
Place of birth for the foreign-born population - Micronesia (%)
Place of birth for the foreign-born population - Bahamas (%)
Place of birth for the foreign-born population - Barbados (%)
Place of birth for the foreign-born population - Cuba (%)
Place of birth for the foreign-born population - Dominica (%)
Place of birth for the foreign-born population - Dominican Republic (%)
Place of birth for the foreign-born population - Grenada (%)
Place of birth for the foreign-born population - Haiti (%)
Place of birth for the foreign-born population - Jamaica (%)
Place of birth for the foreign-born population - St. Vincent and the Grenadines (%)
Place of birth for the foreign-born population - Trinidad and Tobago (%)
Place of birth for the foreign-born population - West Indies (%)
Place of birth for the foreign-born population - Other Caribbean (%)
Place of birth for the foreign-born population - Belize (%)
Place of birth for the foreign-born population - Costa Rica (%)
Place of birth for the foreign-born population - El Salvador (%)
Place of birth for the foreign-born population - Guatemala (%)
Place of birth for the foreign-born population - Honduras (%)
Place of birth for the foreign-born population - Mexico (%)
Place of birth for the foreign-born population - Nicaragua (%)
Place of birth for the foreign-born population - Panama (%)
Place of birth for the foreign-born population - Other Central America (%)
Place of birth for the foreign-born population - Argentina (%)
Place of birth for the foreign-born population - Bolivia (%)
Place of birth for the foreign-born population - Brazil (%)
Place of birth for the foreign-born population - Chile (%)
Place of birth for the foreign-born population - Colombia (%)
Place of birth for the foreign-born population - Ecuador (%)
Place of birth for the foreign-born population - Guyana (%)
Place of birth for the foreign-born population - Peru (%)
Place of birth for the foreign-born population - Uruguay (%)
Place of birth for the foreign-born population - Venezuela (%)
Place of birth for the foreign-born population - Other South America (%)
Place of birth for the foreign-born population - Canada (%)
Place of birth for the foreign-born population - Other Northern America (%)
Place of birth for the foreign-born population - Other (%)
Latest news about races in Tacoma, WA collected exclusively by city-data.com from local newspapers, TV, and radio stations
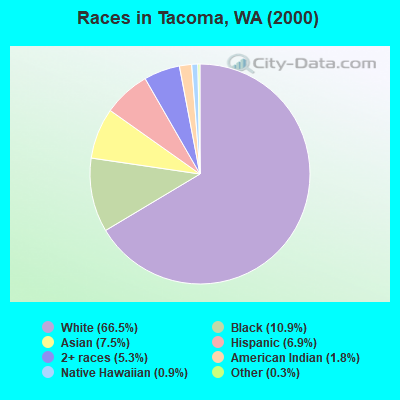
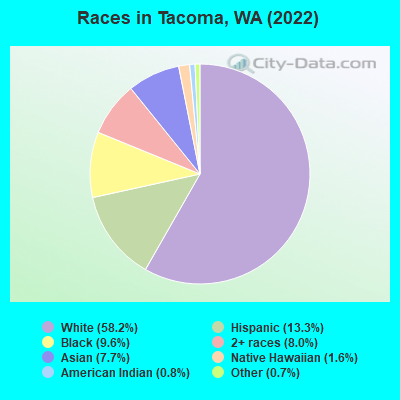
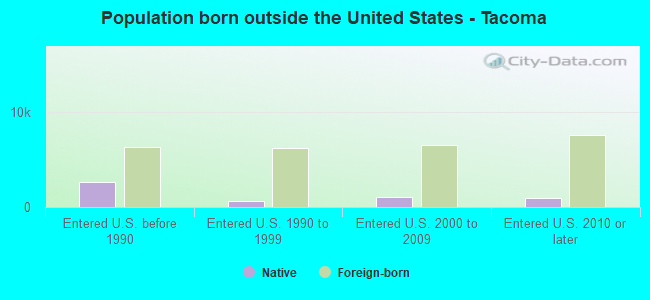
According to 2022 data, the most numerous races in Tacoma, WA are White alone (129,059 residents), Hispanic (29,604 residents), and Asian alone (17,156 residents). 83.4% of Tacoma residents speak English at home. 12.5% of Tacoma, WA residents are foreign-born (5.6% born in Asia, 2.9% born in Latin America, 2.1% born in Europe), which is 19.9% less than the foreign-born rate of 15.0% across the entire state of Washington.
Race distribution in Tacoma
2000 2022
128,696 66.5% White alone 21,187 10.9% Black alone 14,508 7.5% Asian alone 13,262 6.9% Hispanic 10,261 5.3% Two or more races 3,398 1.8% American Indian alone 1,740 0.9% Native Hawaiian and Other 504 0.3% Other race alone
129,059 58.2% White alone 29,604 13.3% Hispanic 21,402 9.6% Black alone 17,778 8.0% Two or more races 17,156 7.7% Asian alone 3,479 1.6% Native Hawaiian and Other 1,778 0.8% American Indian alone 1,534 0.7% Other race alone
2000 2022
4,652,490 78.9% White alone 441,509 7.5% Hispanic 319,401 5.4% Asian alone 184,631 3.1% Black alone 175,926 3.0% Two or more races 85,396 1.4% American Indian alone 22,779 0.4% Native Hawaiian and Other 11,989 0.2% Other race alone
4,941,456 63.5% White alone 1,093,313 14.0% Hispanic 755,832 9.7% Asian alone 523,448 6.7% Two or more races 299,537 3.8% Black alone 69,024 0.9% American Indian alone 52,231 0.7% Native Hawaiian and Other 50,945 0.7% Other race alone
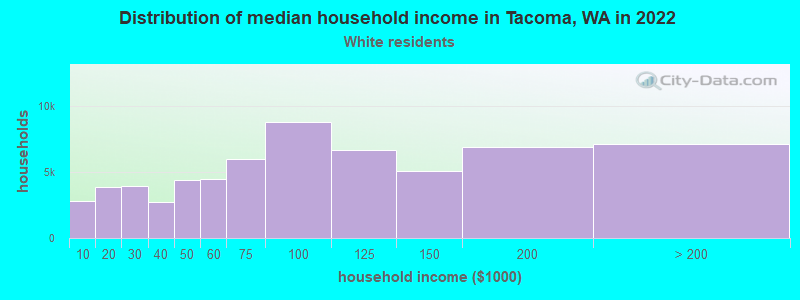
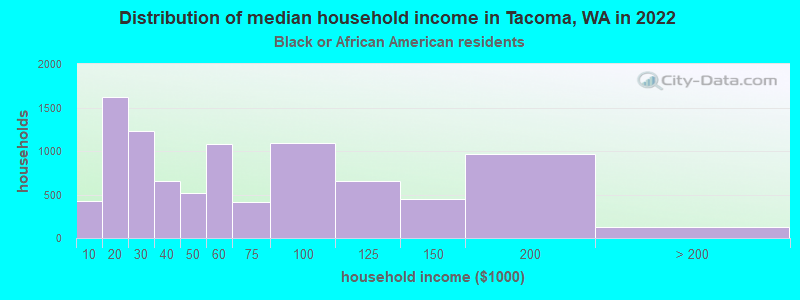
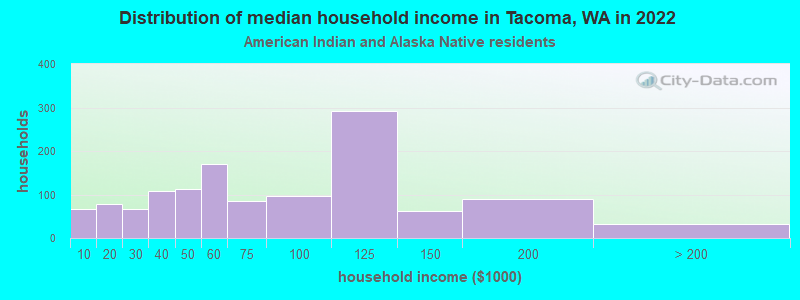
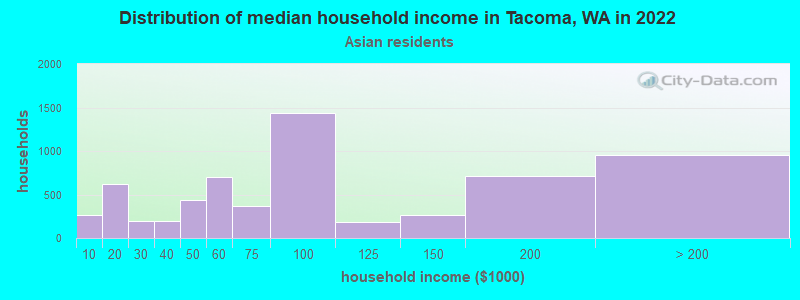
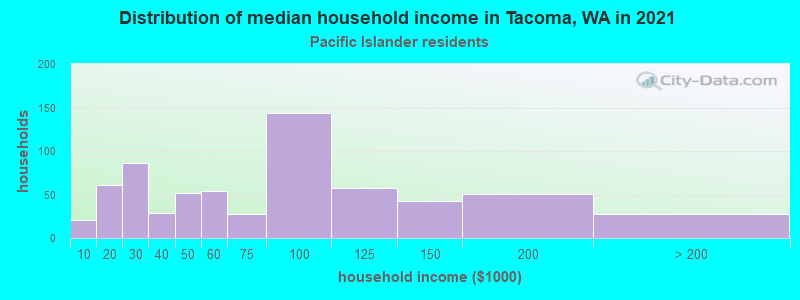
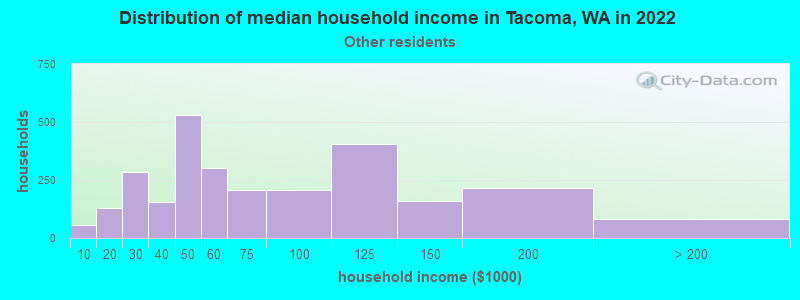
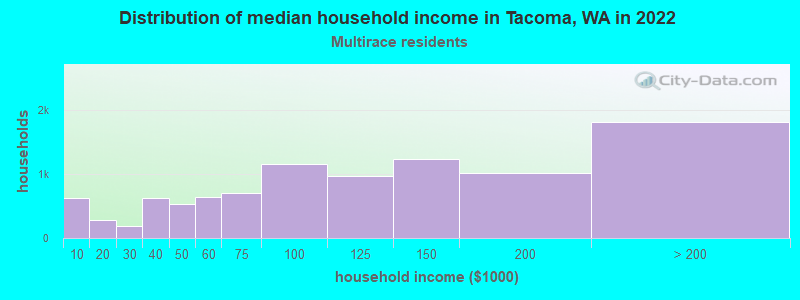
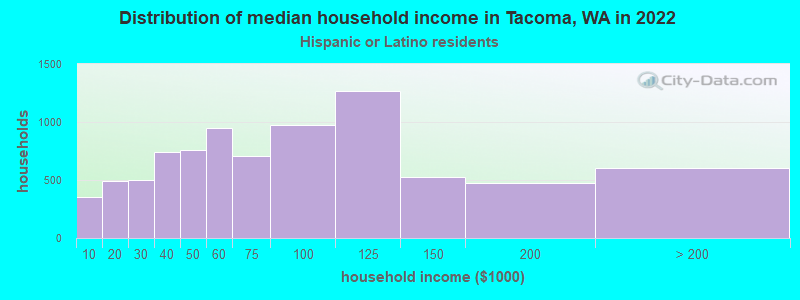
Income and house value in Tacoma Median household income in 2022 $83,872 White non-Hispanic householders$51,226 Black householders$73,931 American Indian and Alaska Native householders$81,079 Asian householders$73,641 Native Hawaiian and other Pacific Islander householders$73,470 Some other race householders$102,813 Two or more races householders$84,095 Hispanic or Latino race householdersMedian 2022 house value $500,787 White Non-Hispanic householders$448,871 Black or African American householders$432,497 American Indian or Alaska Native householders $498,790 Asian householders$521,153 Native Hawaiian and other Pacific Islander householders$406,540 Some other race householders$483,614 Two or more races householders$453,264 Hispanic or Latino householders
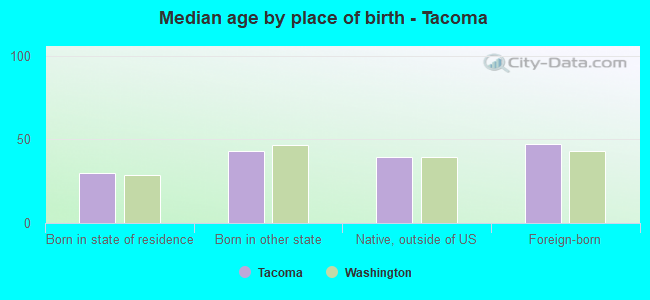
Median age by race in Tacoma
38.9 Median age for White residents37.3 41.3 38.4 Median age for Black or African American residents38.3 38.8 31.0 Median age for American Indian / Alaska Native residents25.3 40.4 43.2 Median age for Asian residents40.0 45.0 40.6 Median age for Native Hawaiian / Pacific Islander residents49.4 39.6 28.1 Median age for Other race residents25.9 28.5 27.8 Median age for Two or more races residents25.6 28.9 40.3 Median age for White alone residents38.5 42.6 24.5 Median age for Hispanic or Latino residents23.4 24.9
Owner/renter occupied households by race in Tacoma
House owners and renters - White residents 37,309 59.4% Owner occupied25,522 40.6% Renter occupiedHouse owners and renters - Black or African American residents 2,506 27.1% Owner occupied6,732 72.9% Renter occupiedHouse owners and renters - American Indian / Alaska Native residents 290 63.7% Owner occupied165 36.3% Renter occupiedHouse owners and renters - Asian residents 3,975 62.9% Owner occupied2,342 37.1% Renter occupiedHouse owners and renters - Native Hawaiian / Pacific Islander residents 442 43.0% Owner occupied586 57.0% Renter occupiedHouse owners and renters - Other race residents 1,326 57.8% Owner occupied970 42.2% Renter occupiedHouse owners and renters - Two or more races residents 5,840 59.7% Owner occupied3,946 40.3% Renter occupiedHouse owners and renters - White alone residents 36,767 60.1% Owner occupied24,384 39.9% Renter occupiedHouse owners and renters - Hispanic or Latino residents 3,794 47.3% Owner occupied4,235 52.7% Renter occupied
Language usage in Tacoma
English speakers - Total 83.4% of residents of Tacoma speak English at home.
5.5% of residents speak Spanish at home 7,861 68.6% Speak English very well3,603 31.4% Speak English less than very well11.1% of residents speak other language at home 13,098 56.6% Speak English very well10,047 43.4% Speak English less than very well
English speakers - Born in the United States 93.9% of residents of Tacoma speak English at home.
3.5% of residents speak Spanish at home 2,569 91.5% Speak English very well238 8.5% Speak English less than very well2.6% of residents speak other language at home 1,615 77.8% Speak English very well461 22.2% Speak English less than very well
English speakers - Native, born elsewhere 66.4% of residents of Tacoma speak English at home.
7.7% of residents speak Spanish at home 327 80.7% Speak English very well78 19.3% Speak English less than very well25.9% of residents speak other language at home 850 62.7% Speak English very well506 37.3% Speak English less than very well
English speakers - Foreign-born 18.3% of residents of Tacoma speak English at home.
18.5% of residents speak Spanish at home 2,236 45.7% Speak English very well2,661 54.3% Speak English less than very well63.3% of residents speak other language at home 8,677 51.7% Speak English very well8,098 48.3% Speak English less than very well
White (Caucasian) - Speak only English Native:
97.0% (119,592)Foreign-born:
29.2% (2,216)
White (Caucasian) - Speak another language Native:
3.0% (3,697)Foreign-born:
70.8% (5,372)
Black or African American - Speak only English Native:
96.4% (18,705)Foreign-born:
4.2% (67)
Black or African American - Speak another language Native:
3.6% (707)Foreign-born:
95.8% (1,545)
American Indian / Alaska Native - Speak only English Native:
85.7% (2,498)Foreign-born:
12.5% (54)
American Indian / Alaska Native - Speak another language Native:
13.8% (402)Foreign-born:
88.5% (382)
Asian - Speak only English Native:
61.6% (3,578)Foreign-born:
16.1% (1,870)
Asian - Speak another language Native:
38.4% (2,234)Foreign-born:
83.9% (9,727)
Native Hawaiian / Pacific Islander - Speak only English Native:
59.6% (1,315)Foreign-born:
21.8% (110)
Native Hawaiian / Pacific Islander - Speak another language Native:
41.0% (904)Foreign-born:
78.0% (394)
Other race - Speak only English Native:
61.3% (3,236)Foreign-born:
9.3% (115)
Other race - Speak another language Native:
38.7% (2,046)Foreign-born:
90.7% (1,122)
Two or more races - Speak only English Native:
86.1% (19,981)Foreign-born:
15.7% (571)
Two or more races - Speak another language Native:
13.9% (3,228)Foreign-born:
84.3% (3,074)
White alone - Speak only English Native:
97.7% (113,636)Foreign-born:
32.9% (2,216)
White alone - Speak another language Native:
2.3% (2,664)Foreign-born:
67.1% (4,524)
Hispanic or Latino - Speak only English Native:
72.0% (14,507)Foreign-born:
12.1% (689)
Hispanic or Latino - Speak another language Native:
28.0% (5,630)Foreign-born:
87.9% (4,982)
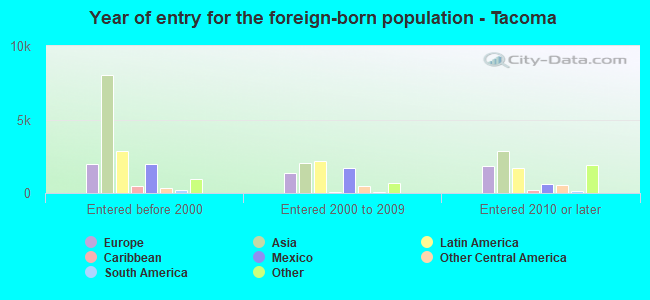
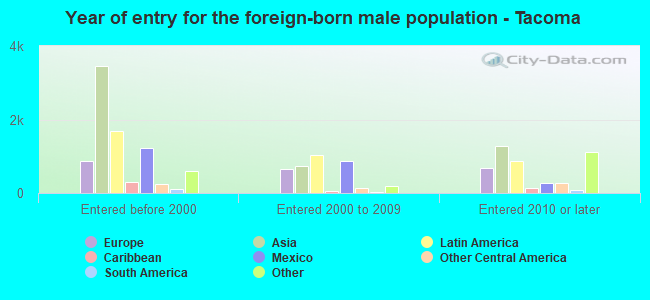
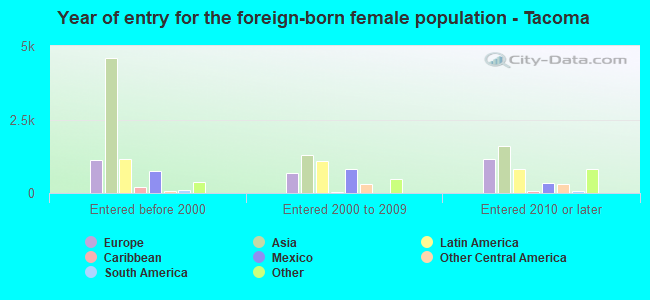
Foreign-born residents in Tacoma 27,667 residents are foreign born (5.6% Asia , 2.9% Latin America , 2.1% Europe ).
This city:
12.5%Washington:
14.9%
Marital status for residents in Tacoma Marital status - White (Caucasian) population 15 years and over
Males 38.0% Never married48.6% Now married1.0% Separated1.4% Widowed11.1% DivorcedFemales 30.6% Never married45.6% Now married1.2% Separated7.7% Widowed15.0% DivorcedWomen who gave birth in the past 12 months Now married:
56.6% (1,176)Unmarried:
43.4% (900)
Women who did not give birth in the past 12 months Now married:
43.6% (13,687)Unmarried:
56.4% (17,671)
Marital status - Black or African American population 15 years and over
Males 56.9% Never married28.8% Now married5.3% Separated0.5% Widowed8.4% DivorcedFemales 49.5% Never married24.7% Now married4.8% Separated7.6% Widowed13.4% DivorcedWomen who gave birth in the past 12 months Now married:
100.0% (219)Unmarried:
0.0% (0)
Women who did not give birth in the past 12 months Now married:
19.3% (1,006)Unmarried:
80.7% (4,199)
Marital status - American Indian / Alaska Native population 15 years and over
Males 50.9% Never married37.8% Now married1.3% Separated0.7% Widowed9.4% DivorcedFemales 44.9% Never married24.5% Now married6.8% Separated6.8% Widowed17.1% DivorcedWomen who gave birth in the past 12 months Now married:
0.0% (0)Unmarried:
100.0% (19)
Women who did not give birth in the past 12 months Now married:
41.3% (346)Unmarried:
58.7% (491)
Marital status - Asian population 15 years and over
Males 39.0% Never married48.3% Now married2.4% Separated0.4% Widowed10.0% DivorcedFemales 30.9% Never married52.0% Now married1.0% Separated8.7% Widowed7.4% DivorcedWomen who gave birth in the past 12 months Now married:
100.0% (249)Unmarried:
0.0% (0)
Women who did not give birth in the past 12 months Now married:
40.1% (2,213)Unmarried:
59.9% (3,311)
Marital status - Native Hawaiian / Pacific Islander population 15 years and over
Males 33.1% Never married53.7% Now married5.4% Separated2.5% Widowed5.3% DivorcedFemales 30.5% Never married53.1% Now married0.0% Separated6.9% Widowed9.5% DivorcedWomen who gave birth in the past 12 months Now married:
50.0% (44)Unmarried:
50.0% (44)
Women who did not give birth in the past 12 months Now married:
55.7% (459)Unmarried:
44.3% (366)
Marital status - Other race population 15 years and over
Males 51.7% Never married38.6% Now married2.4% Separated0.8% Widowed6.5% DivorcedFemales 42.6% Never married41.2% Now married0.6% Separated1.2% Widowed14.4% DivorcedWomen who gave birth in the past 12 months Now married:
86.0% (107)Unmarried:
14.0% (17)
Women who did not give birth in the past 12 months Now married:
38.3% (776)Unmarried:
61.7% (1,250)
Marital status - Two or more races population 15 years and over
Males 54.1% Never married37.7% Now married0.9% Separated0.4% Widowed6.8% DivorcedFemales 46.7% Never married32.1% Now married5.1% Separated1.2% Widowed14.8% DivorcedWomen who gave birth in the past 12 months Now married:
87.1% (829)Unmarried:
12.9% (123)
Women who did not give birth in the past 12 months Now married:
29.3% (2,521)Unmarried:
70.7% (6,077)
Marital status - White alone, not Hispanic / Latino population 15 years and over
Males 36.9% Never married49.2% Now married1.0% Separated1.5% Widowed11.4% DivorcedFemales 29.5% Never married46.4% Now married1.2% Separated7.7% Widowed15.2% DivorcedWomen who gave birth in the past 12 months Now married:
61.3% (1,176)Unmarried:
38.7% (742)
Women who did not give birth in the past 12 months Now married:
45.1% (13,245)Unmarried:
54.9% (16,154)
Marital status - Hispanic or Latino population 15 years and over
Males 47.6% Never married45.1% Now married0.1% Separated0.0% Widowed7.2% DivorcedFemales 40.4% Never married41.8% Now married2.6% Separated3.0% Widowed12.2% DivorcedWomen who gave birth in the past 12 months Now married:
79.1% (598)Unmarried:
20.9% (158)
Women who did not give birth in the past 12 months Now married:
38.2% (2,997)Unmarried:
61.8% (4,842)
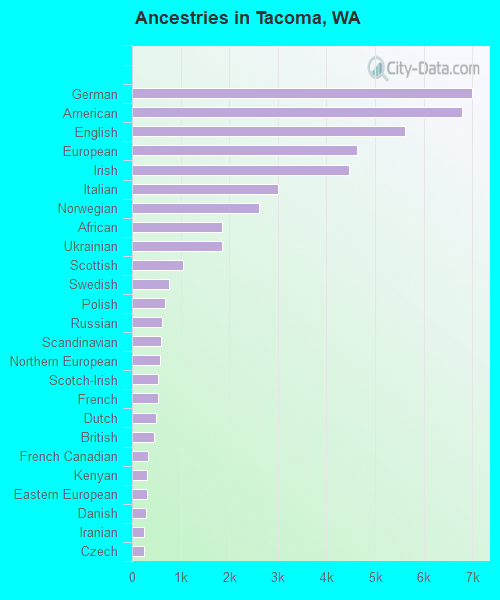
Ancestries in Tacoma
6,993 7.0% German6,797 6.8% American5,621 5.7% English4,623 4.6% European4,473 4.5% Irish3,009 3.0% Italian2,605 2.6% Norwegian1,851 1.9% African1,851 1.9% Ukrainian1,050 1.1% Scottish770 0.8% Swedish669 0.7% Polish618 0.6% Russian595 0.6% Scandinavian567 0.6% Northern European544 0.5% Scotch-Irish525 0.5% French498 0.5% Dutch462 0.5% British331 0.3% French Canadian307 0.3% Kenyan300 0.3% Eastern European287 0.3% Danish255 0.3% Iranian238 0.2% Czech230 0.2% Canadian218 0.2% Nigerian215 0.2% Jamaican212 0.2% Romanian161 0.2% Finnish160 0.2% Ethiopian158 0.2% Icelander158 0.2% Croatian131 0.1% Welsh107 0.1% Trinidadian and Tobagonian96 0.10% Ugandan95 0.10% Belizean87 0.09% Greek82 0.08% Brazilian80 0.08% British West Indian64 0.06% Bulgarian62 0.06% Swiss51 0.05% South African47 0.05% Somali46 0.05% Liberian40 0.04% Hungarian37 0.04% West Indian36 0.04% Slovak34 0.03% Afghan34 0.03% Lithuanian32 0.03% Austrian28 0.03% Australian28 0.03% Celtic27 0.03% Turkish27 0.03% Yugoslavian26 0.03% Albanian25 0.03% Portuguese20 0.02% Lebanese20 0.02% German Russian20 0.02% Belgian17 0.02% Slovene15 0.02% Basque14 0.01% Carpatho Rusyn14 0.01% Barbadian13 0.01% Estonian12 0.01% Armenian12 0.01% Palestinian12 0.01% Slavic10 0.01% Latvian9 0.01% Czechoslovakian7 0.01% Assyrian5 0.01% Arab
Geographical mobility in Tacoma Same house 1 year ago 114,342 83.7% White (Caucasian)17,342 78.5% Black or African American3,077 89.0% American Indian / Alaska Native13,735 78.5% Asian2,355 91.1% Native Hawaiian / Pacific Islander6,740 83.0% Other race24,724 82.6% Two or more races107,324 83.9% White alone, not Hispanic / Latino23,282 81.1% Hispanic or LatinoMoved within same county 9,139 6.7% White / Caucasian1,622 7.3% Black or African American213 6.2% American Indian / Alaska Native2,403 13.7% Asian108 4.2% Native Hawaiian / Pacific Islander671 8.3% Other race3,499 11.7% Two or more races8,117 6.3% White alone, not Hispanic / Latino3,565 12.4% Hispanic or LatinoMoved within same state 6,761 4.9% White / Caucasian1,427 6.5% Black or African American286 8.3% American Indian / Alaska Native677 3.9% Asian124 4.8% Native Hawaiian / Pacific Islander453 5.6% Other race829 2.8% Two or more races6,539 5.1% White alone, not Hispanic / Latino755 2.6% Hispanic or LatinoMoved from different state 5,267 3.9% White / Caucasian1,707 7.7% Black or African American57 1.7% American Indian / Alaska Native475 2.7% Asian45 1.8% Native Hawaiian / Pacific Islander426 5.2% Other race884 3.0% Two or more races5,051 3.9% White alone, not Hispanic / Latino906 3.2% Hispanic or LatinoMoved from abroad 1,100 0.8% White197 1.1% Asian8 0.3% Native Hawaiian / Pacific Islander103 1.3% Other race962 0.8% White alone, not Hispanic / Latino200 0.7% Hispanic or Latino
Children Nativity (place of birth) in Tacoma
Children under 6 years - Living with two parents Both parents native 6,970 100.0% NativeBoth parents foreign-born 1,177 92.5% Native95 7.5% Foreign-bornOne native, one foreign-born parent 1,339 100.0% NativeChildren under 6 years - Living with one parent Native parent 4,394 100.0% NativeForeign-born parent 218 82.9% Native45 17.1% Foreign-bornChildren 6 to 17 years - Living with two parents Both parents native 10,991 99.7% Native31 0.3% Foreign-bornBoth parents foreign-born 2,275 69.8% Native984 30.2% Foreign-bornOne native, one foreign-born parent 1,632 87.0% Native244 13.0% Foreign-bornChildren 6 to 17 years - Living with one parent Native parent 9,174 100.0% NativeForeign-born parent 688 53.8% Native591 46.2% Foreign-born
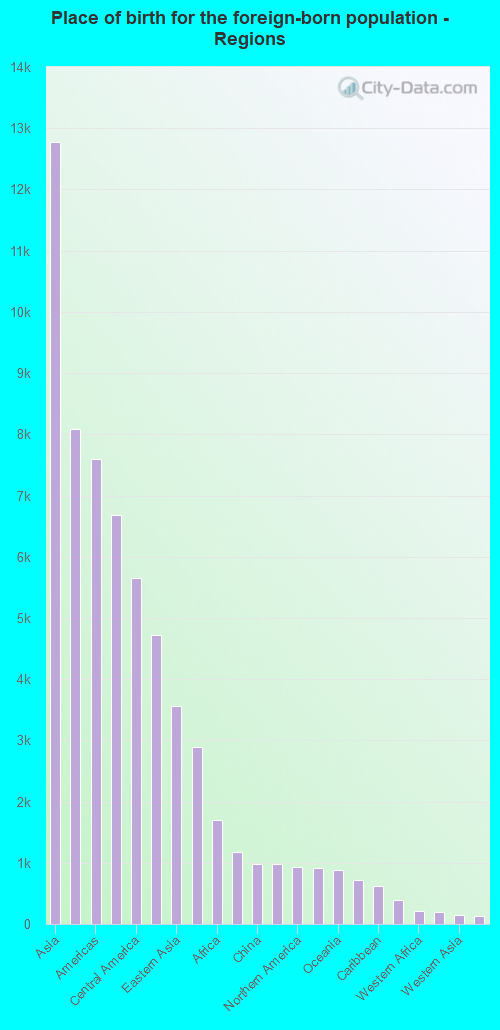
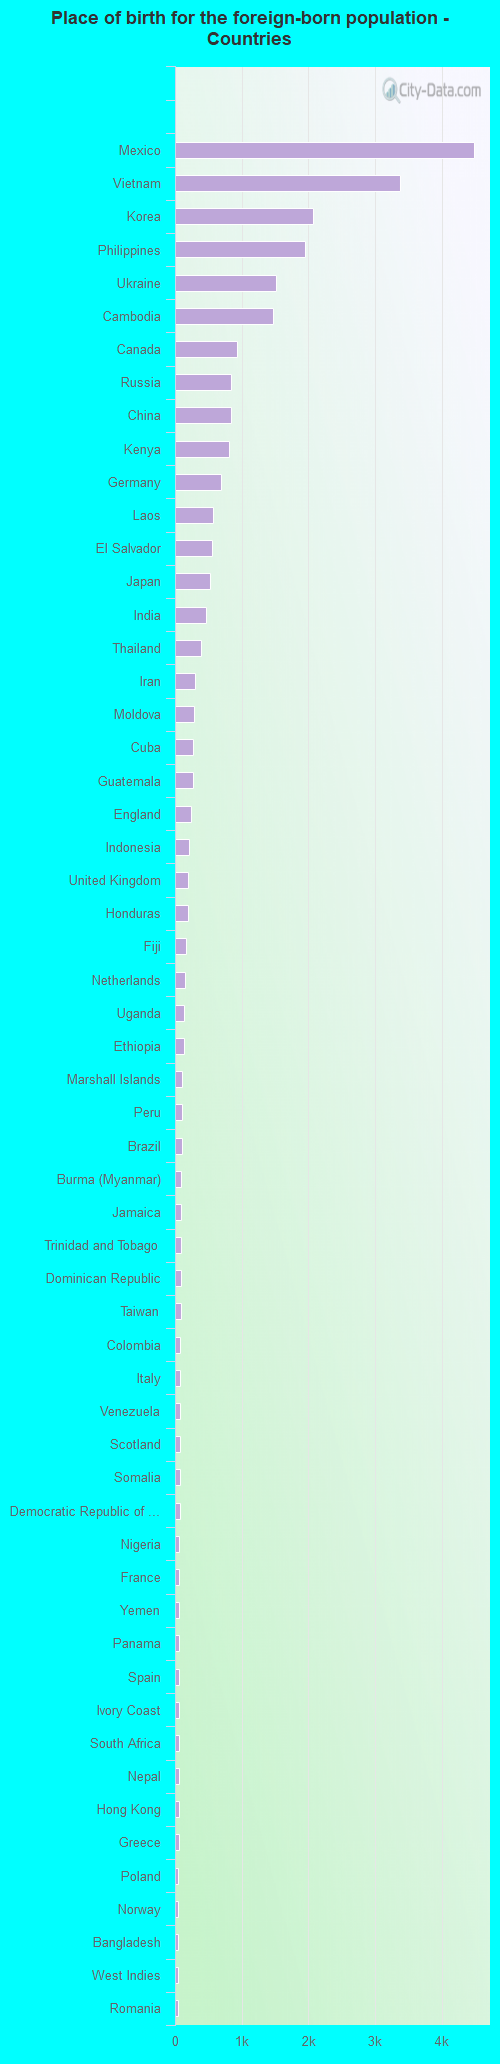
Place of birth for residents in Tacoma 12,773 Asia8,081 South Eastern Asia7,598 Americas6,674 Latin America5,660 Central America4,722 Europe3,564 Eastern Asia2,896 Eastern Europe1,696 Africa1,178 Eastern Africa979 China973 South Central Asia923 Northern America914 Western Europe877 Oceania722 Northern Europe618 Caribbean395 South America213 Western Africa189 Southern Europe152 Western Asia133 Middle Africa62 Northern Africa62 Australia and New Zealand Subregion57 Southern Africa4,487 Mexico3,373 Vietnam2,065 Korea1,957 Philippines1,514 Ukraine1,465 Cambodia923 Canada842 Russia840 China811 Kenya684 Germany576 Laos558 El Salvador520 Japan459 India385 Thailand296 Iran289 Moldova268 Cuba263 Guatemala234 England206 Indonesia199 United Kingdom192 Honduras172 Fiji146 Netherlands135 Uganda134 Ethiopia110 Marshall Islands101 Peru98 Brazil97 Burma (Myanmar)96 Jamaica87 Trinidad and Tobago86 Dominican Republic83 Taiwan81 Colombia76 Italy72 Venezuela71 Scotland71 Somalia70 Democratic Republic of Congo (Zaire)67 Nigeria67 France66 Yemen63 Panama57 Spain57 Ivory Coast57 South Africa57 Nepal55 Hong Kong55 Greece49 Poland47 Norway47 Bangladesh47 West Indies44 Romania40 Belize39 Israel39 Congo38 Liberia37 Kazakhstan37 Czechoslovakia35 Egypt35 Ghana34 Australia29 Turkey28 New Zealand28 Nicaragua25 Afghanistan25 Costa Rica23 Chile23 Latvia22 Bulgaria22 Barbados22 Cameroon21 Belarus20 Pakistan19 Denmark18 Micronesia15 Uzbekistan15 North Macedonia (Macedonia)13 Hungary13 Argentina10 Singapore8 Malaysia8 Switzerland7 Belgium5 Morocco5 Zimbabwe5 Georgia5 Bosnia and Herzegovina4 Lebanon4 Iraq4 Saudi Arabia4 Ecuador3 Ireland
Grandparents responsible for own grandchildren in Tacoma
Grandparents (30 to 59 years) White / Caucasian 295 33.8% Responsible for grandchildren578 66.2% Not responsible for grandchildrenBlack or African American 349 75.6% Responsible for grandchildren113 24.4% Not responsible for grandchildrenAmerican Indian / Alaska Native 2 3.0% Responsible for grandchildren79 97.0% Not responsible for grandchildrenAsian 15 14.8% Responsible for grandchildren83 85.2% Not responsible for grandchildrenNative Hawaiian / Pacific Islander 40 68.5% Responsible for grandchildren18 31.5% Not responsible for grandchildrenOther race 9 14.6% Responsible for grandchildren55 85.4% Not responsible for grandchildrenTwo or more races 31 11.0% Responsible for grandchildren252 89.0% Not responsible for grandchildrenWhite alone, not Hispanic / Latino 256 24.9% Responsible for grandchildren773 75.1% Not responsible for grandchildrenHispanic or Latino 98 23.2% Responsible for grandchildren326 76.8% Not responsible for grandchildrenGrandparents (60 years and over) White / Caucasian 302 41.0% Responsible for grandchildren435 59.0% Not responsible for grandchildrenBlack or African American 21 5.1% Responsible for grandchildren393 94.9% Not responsible for grandchildrenAmerican Indian / Alaska Native 50 42.0% Responsible for grandchildren68 58.0% Not responsible for grandchildrenAsian 92 17.4% Responsible for grandchildren434 82.6% Not responsible for grandchildrenNative Hawaiian / Pacific Islander 38 100.0% Not responsible for grandchildrenOther race 11 13.2% Responsible for grandchildren73 86.8% Not responsible for grandchildrenTwo or more races 40 28.5% Responsible for grandchildren101 71.5% Not responsible for grandchildrenWhite alone, not Hispanic / Latino 208 22.0% Responsible for grandchildren737 78.0% Not responsible for grandchildrenHispanic or Latino 39 15.4% Responsible for grandchildren214 84.6% Not responsible for grandchildren