Races in Tahlequah, Oklahoma (OK) Detailed Stats
Data:
Races - White alone (%)
Races - White alone (% change since 2000)
Races - Black alone (%)
Races - Black alone (% change since 2000)
Races - American Indian alone (%)
Races - American Indian alone (% change since 2000)
Races - Asian alone (%)
Races - Asian alone (% change since 2000)
Races - Hispanic (%)
Races - Hispanic (% change since 2000)
Races - Native Hawaiian and Other Pacific Islander alone (%)
Races - Native Hawaiian and Other Pacific Islander alone (% change since 2000)
Races - Two or more races(%)
Races - Two or more races(% change since 2000)
Races - Other race alone (%)
Races - Other race alone (% change since 2000)
Racial diversity
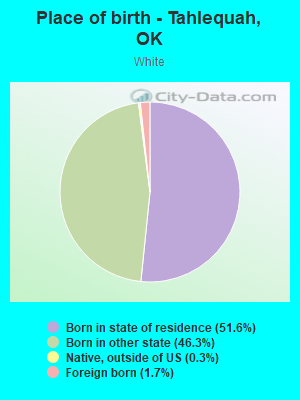
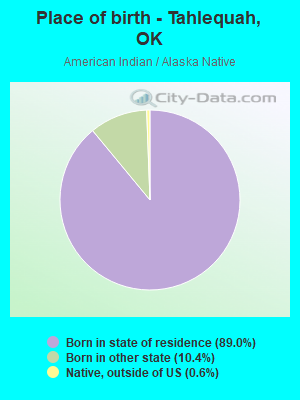
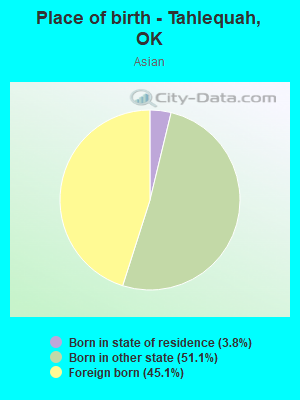
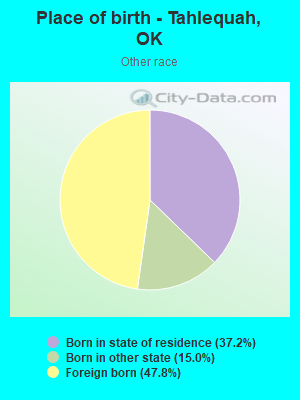
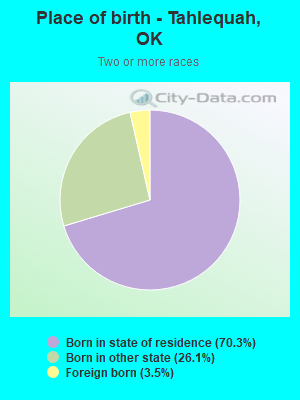
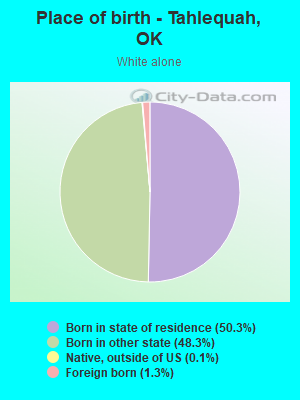
Place of birth - Born in state of residence (%)
Place of birth - Born in state of residence (%) - White
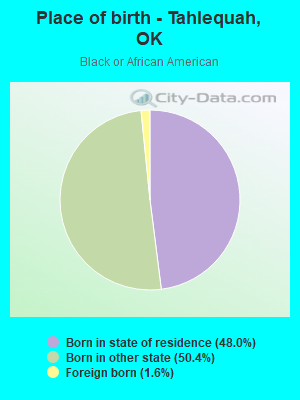
Place of birth - Born in state of residence (%) - Black or African American
Place of birth - Born in state of residence (%) - Asian
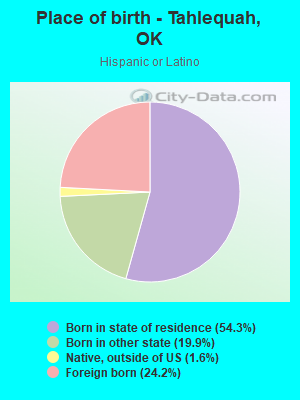
Place of birth - Born in state of residence (%) - Hispanic or Latino
Place of birth - Born in state of residence (%) - American Indian and Alaska Native
Place of birth - Born in state of residence (%) - Multirace
Place of birth - Born in state of residence (%) - Other Race
Place of birth - Born in other state (%)
Place of birth - Born in other state (%) - White
Place of birth - Born in other state (%) - Black or African American
Place of birth - Born in other state (%) - Asian
Place of birth - Born in other state (%) - Hispanic or Latino
Place of birth - Born in other state (%) - American Indian and Alaska Native
Place of birth - Born in other state (%) - Multirace
Place of birth - Born in other state (%) - Other Race
Place of birth - Native, outside of US (%)
Place of birth - Native, outside of US (%) - White
Place of birth - Native, outside of US (%) - Black or African American
Place of birth - Native, outside of US (%) - Asian
Place of birth - Native, outside of US (%) - Hispanic or Latino
Place of birth - Native, outside of US (%) - American Indian and Alaska Native
Place of birth - Native, outside of US (%) - Multirace
Place of birth - Native, outside of US (%) - Other Race
Place of birth - Foreign born (%)
Place of birth - Foreign born (%) - White
Place of birth - Foreign born (%) - Black or African American
Place of birth - Foreign born (%) - Asian
Place of birth - Foreign born (%) - Hispanic or Latino
Place of birth - Foreign born (%) - American Indian and Alaska Native
Place of birth - Foreign born (%) - Multirace
Place of birth - Foreign born (%) - Other Race
Residents speaking English at home (%)
Residents speaking English at home - Born in the United States (%)
Residents speaking English at home - Native, born elsewhere (%)
Residents speaking English at home - Foreign born (%)
Residents speaking Spanish at home (%)
Residents speaking Spanish at home - Born in the United States (%)
Residents speaking Spanish at home - Native, born elsewhere (%)
Residents speaking Spanish at home - Foreign born (%)
Residents speaking other language at home (%)
Residents speaking other language at home - Born in the United States (%)
Residents speaking other language at home - Native, born elsewhere (%)
Residents speaking other language at home - Foreign born (%)
Marital status - Never married (%)
Marital status - Now married (%)
Marital status - Separated (%)
Marital status - Widowed (%)
Marital status - Divorced (%)
Ancestries Reported - Arab (%)
Ancestries Reported - Czech (%)
Ancestries Reported - Danish (%)
Ancestries Reported - Dutch (%)
Ancestries Reported - English (%)
Ancestries Reported - French (%)
Ancestries Reported - French Canadian (%)
Ancestries Reported - German (%)
Ancestries Reported - Greek (%)
Ancestries Reported - Hungarian (%)
Ancestries Reported - Irish (%)
Ancestries Reported - Italian (%)
Ancestries Reported - Lithuanian (%)
Ancestries Reported - Norwegian (%)
Ancestries Reported - Polish (%)
Ancestries Reported - Portuguese (%)
Ancestries Reported - Russian (%)
Ancestries Reported - Scotch-Irish (%)
Ancestries Reported - Scottish (%)
Ancestries Reported - Slovak (%)
Ancestries Reported - Subsaharan African (%)
Ancestries Reported - Swedish (%)
Ancestries Reported - Swiss (%)
Ancestries Reported - Ukrainian (%)
Ancestries Reported - United States (%)
Ancestries Reported - Welsh (%)
Ancestries Reported - West Indian (%)
Ancestries Reported - Other (%)
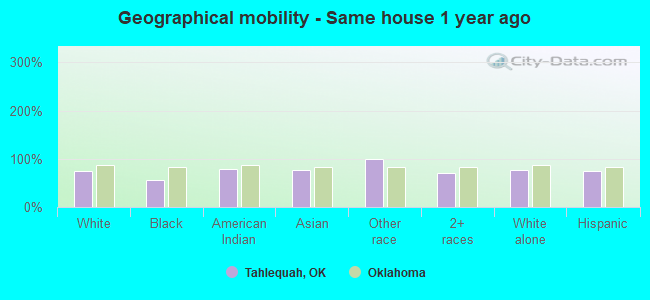
Geographical mobility - Same house 1 year ago (%)
Geographical mobility - Same house 1 year ago (%) - White
Geographical mobility - Same house 1 year ago (%) - Black or African American
Geographical mobility - Same house 1 year ago (%) - Asian
Geographical mobility - Same house 1 year ago (%) - Hispanic or Latino
Geographical mobility - Same house 1 year ago (%) - American Indian and Alaska Native
Geographical mobility - Same house 1 year ago (%) - Multirace
Geographical mobility - Same house 1 year ago (%) - Other Race
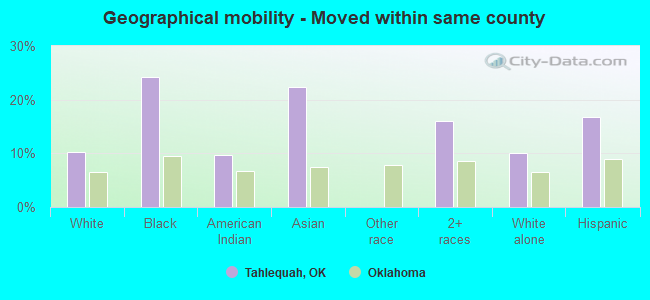
Geographical mobility - Moved within same county (%)
Geographical mobility - Moved within same county (%) - White
Geographical mobility - Moved within same county (%) - Black or African American
Geographical mobility - Moved within same county (%) - Asian
Geographical mobility - Moved within same county (%) - Hispanic or Latino
Geographical mobility - Moved within same county (%) - American Indian and Alaska Native
Geographical mobility - Moved within same county (%) - Multirace
Geographical mobility - Moved within same county (%) - Other Race
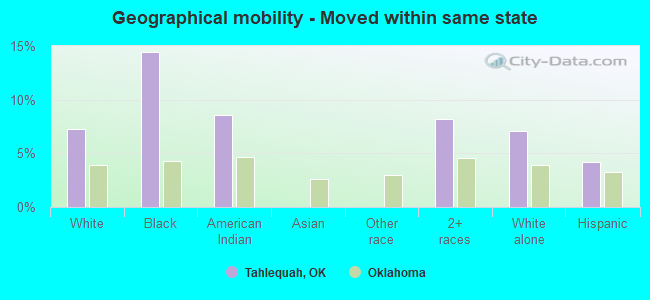
Geographical mobility - Moved from different county within same state (%)
Geographical mobility - Moved from different county within same state (%) - White
Geographical mobility - Moved from different county within same state (%) - Black or African American
Geographical mobility - Moved from different county within same state (%) - Asian
Geographical mobility - Moved from different county within same state (%) - Hispanic or Latino
Geographical mobility - Moved from different county within same state (%) - American Indian and Alaska Native
Geographical mobility - Moved from different county within same state (%) - Multirace
Geographical mobility - Moved from different county within same state (%) - Other Race
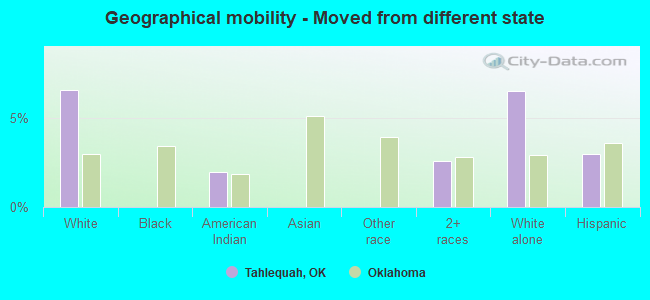
Geographical mobility - Moved from different state (%)
Geographical mobility - Moved from different state (%) - White
Geographical mobility - Moved from different state (%) - Black or African American
Geographical mobility - Moved from different state (%) - Asian
Geographical mobility - Moved from different state (%) - Hispanic or Latino
Geographical mobility - Moved from different state (%) - American Indian and Alaska Native
Geographical mobility - Moved from different state (%) - Multirace
Geographical mobility - Moved from different state (%) - Other Race
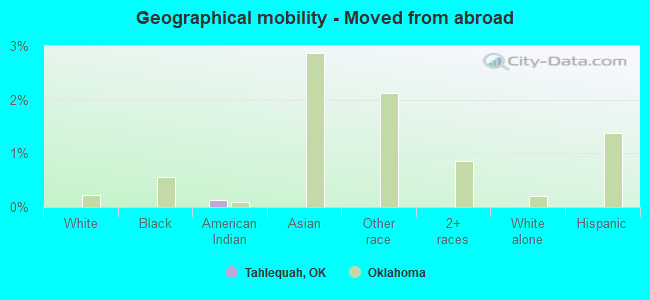
Geographical mobility - Moved from abroad (%)
Geographical mobility - Moved from abroad (%) - White
Geographical mobility - Moved from abroad (%) - Black or African American
Geographical mobility - Moved from abroad (%) - Asian
Geographical mobility - Moved from abroad (%) - Hispanic or Latino
Geographical mobility - Moved from abroad (%) - American Indian and Alaska Native
Geographical mobility - Moved from abroad (%) - Multirace
Geographical mobility - Moved from abroad (%) - Other Race
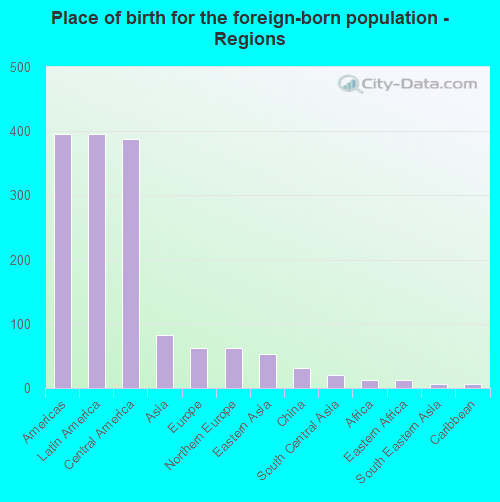
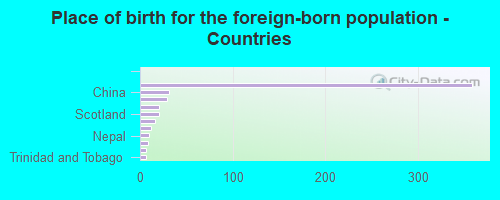
Place of birth for the foreign-born population - Ireland (%)
Place of birth for the foreign-born population - Denmark (%)
Place of birth for the foreign-born population - Norway (%)
Place of birth for the foreign-born population - Sweden (%)
Place of birth for the foreign-born population - United Kingdom (%)
Place of birth for the foreign-born population - England (%)
Place of birth for the foreign-born population - Scotland (%)
Place of birth for the foreign-born population - Other Northern Europe (%)
Place of birth for the foreign-born population - Austria (%)
Place of birth for the foreign-born population - Belgium (%)
Place of birth for the foreign-born population - France (%)
Place of birth for the foreign-born population - Germany (%)
Place of birth for the foreign-born population - Netherlands (%)
Place of birth for the foreign-born population - Switzerland (%)
Place of birth for the foreign-born population - Other Western Europe (%)
Place of birth for the foreign-born population - Greece (%)
Place of birth for the foreign-born population - Italy (%)
Place of birth for the foreign-born population - Portugal (%)
Place of birth for the foreign-born population - Spain (%)
Place of birth for the foreign-born population - Other Southern Europe (%)
Place of birth for the foreign-born population - Albania (%)
Place of birth for the foreign-born population - Belarus (%)
Place of birth for the foreign-born population - Bosnia and Herzegovina (%)
Place of birth for the foreign-born population - Bulgaria (%)
Place of birth for the foreign-born population - Croatia (%)
Place of birth for the foreign-born population - Czechoslovakia (%)
Place of birth for the foreign-born population - Hungary (%)
Place of birth for the foreign-born population - Latvia (%)
Place of birth for the foreign-born population - Lithuania (%)
Place of birth for the foreign-born population - North Macedonia (Macedonia) (%)
Place of birth for the foreign-born population - Moldova (%)
Place of birth for the foreign-born population - Poland (%)
Place of birth for the foreign-born population - Romania (%)
Place of birth for the foreign-born population - Russia (%)
Place of birth for the foreign-born population - Serbia (%)
Place of birth for the foreign-born population - Ukraine (%)
Place of birth for the foreign-born population - Other Eastern Europe (%)
Place of birth for the foreign-born population - China (%)
Place of birth for the foreign-born population - Hong Kong (%)
Place of birth for the foreign-born population - Taiwan (%)
Place of birth for the foreign-born population - Japan (%)
Place of birth for the foreign-born population - Korea (%)
Place of birth for the foreign-born population - Other Eastern Asia (%)
Place of birth for the foreign-born population - Afghanistan (%)
Place of birth for the foreign-born population - Bangladesh (%)
Place of birth for the foreign-born population - India (%)
Place of birth for the foreign-born population - Iran (%)
Place of birth for the foreign-born population - Kazakhstan (%)
Place of birth for the foreign-born population - Nepal (%)
Place of birth for the foreign-born population - Pakistan (%)
Place of birth for the foreign-born population - Sri Lanka (%)
Place of birth for the foreign-born population - Uzbekistan (%)
Place of birth for the foreign-born population - Other South Central Asia (%)
Place of birth for the foreign-born population - Burma (%)
Place of birth for the foreign-born population - Cambodia (%)
Place of birth for the foreign-born population - Indonesia (%)
Place of birth for the foreign-born population - Laos (%)
Place of birth for the foreign-born population - Malaysia (%)
Place of birth for the foreign-born population - Philippines (%)
Place of birth for the foreign-born population - Singapore (%)
Place of birth for the foreign-born population - Thailand (%)
Place of birth for the foreign-born population - Vietnam (%)
Place of birth for the foreign-born population - Other South Eastern Asia (%)
Place of birth for the foreign-born population - Armenia (%)
Place of birth for the foreign-born population - Iraq (%)
Place of birth for the foreign-born population - Israel (%)
Place of birth for the foreign-born population - Jordan (%)
Place of birth for the foreign-born population - Kuwait (%)
Place of birth for the foreign-born population - Lebanon (%)
Place of birth for the foreign-born population - Saudi Arabia (%)
Place of birth for the foreign-born population - Syria (%)
Place of birth for the foreign-born population - Turkey (%)
Place of birth for the foreign-born population - Yemen (%)
Place of birth for the foreign-born population - Other Western Asia (%)
Place of birth for the foreign-born population - Eritrea (%)
Place of birth for the foreign-born population - Ethiopia (%)
Place of birth for the foreign-born population - Kenya (%)
Place of birth for the foreign-born population - Somalia (%)
Place of birth for the foreign-born population - Uganda (%)
Place of birth for the foreign-born population - Zimbabwe (%)
Place of birth for the foreign-born population - Other Eastern Africa (%)
Place of birth for the foreign-born population - Cameroon (%)
Place of birth for the foreign-born population - Congo (%)
Place of birth for the foreign-born population - Democratic Republic of Congo (Zaire) (%)
Place of birth for the foreign-born population - Other Middle Africa (%)
Place of birth for the foreign-born population - Egypt (%)
Place of birth for the foreign-born population - Morocco (%)
Place of birth for the foreign-born population - Sudan (%)
Place of birth for the foreign-born population - Other Northern Africa (%)
Place of birth for the foreign-born population - South Africa (%)
Place of birth for the foreign-born population - Other Southern Africa (%)
Place of birth for the foreign-born population - Cabo Verde (%)
Place of birth for the foreign-born population - Ghana (%)
Place of birth for the foreign-born population - Liberia (%)
Place of birth for the foreign-born population - Nigeria (%)
Place of birth for the foreign-born population - Senegal (%)
Place of birth for the foreign-born population - Sierra Leone (%)
Place of birth for the foreign-born population - Other Western Africa (%)
Place of birth for the foreign-born population - Australia (%)
Place of birth for the foreign-born population - New Zealand (%)
Place of birth for the foreign-born population - Fiji (%)
Place of birth for the foreign-born population - Micronesia (%)
Place of birth for the foreign-born population - Bahamas (%)
Place of birth for the foreign-born population - Barbados (%)
Place of birth for the foreign-born population - Cuba (%)
Place of birth for the foreign-born population - Dominica (%)
Place of birth for the foreign-born population - Dominican Republic (%)
Place of birth for the foreign-born population - Grenada (%)
Place of birth for the foreign-born population - Haiti (%)
Place of birth for the foreign-born population - Jamaica (%)
Place of birth for the foreign-born population - St. Vincent and the Grenadines (%)
Place of birth for the foreign-born population - Trinidad and Tobago (%)
Place of birth for the foreign-born population - West Indies (%)
Place of birth for the foreign-born population - Other Caribbean (%)
Place of birth for the foreign-born population - Belize (%)
Place of birth for the foreign-born population - Costa Rica (%)
Place of birth for the foreign-born population - El Salvador (%)
Place of birth for the foreign-born population - Guatemala (%)
Place of birth for the foreign-born population - Honduras (%)
Place of birth for the foreign-born population - Mexico (%)
Place of birth for the foreign-born population - Nicaragua (%)
Place of birth for the foreign-born population - Panama (%)
Place of birth for the foreign-born population - Other Central America (%)
Place of birth for the foreign-born population - Argentina (%)
Place of birth for the foreign-born population - Bolivia (%)
Place of birth for the foreign-born population - Brazil (%)
Place of birth for the foreign-born population - Chile (%)
Place of birth for the foreign-born population - Colombia (%)
Place of birth for the foreign-born population - Ecuador (%)
Place of birth for the foreign-born population - Guyana (%)
Place of birth for the foreign-born population - Peru (%)
Place of birth for the foreign-born population - Uruguay (%)
Place of birth for the foreign-born population - Venezuela (%)
Place of birth for the foreign-born population - Other South America (%)
Place of birth for the foreign-born population - Canada (%)
Place of birth for the foreign-born population - Other Northern America (%)
Place of birth for the foreign-born population - Other (%)
Latest news about races in Tahlequah, OK collected exclusively by city-data.com from local newspapers, TV, and radio stations
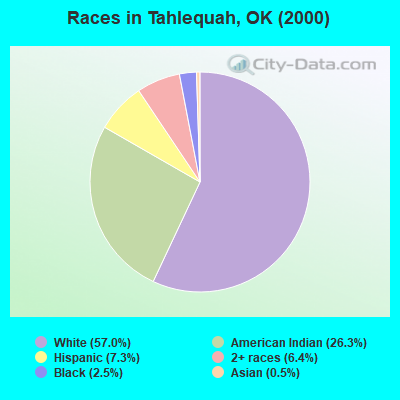
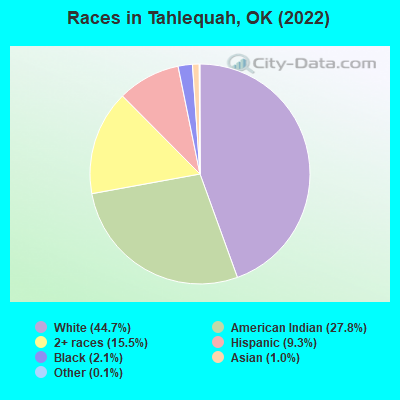
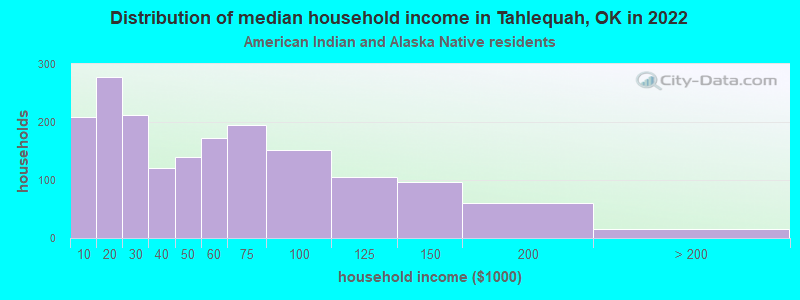
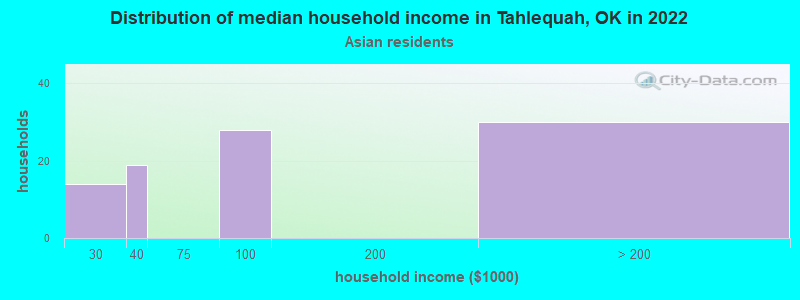
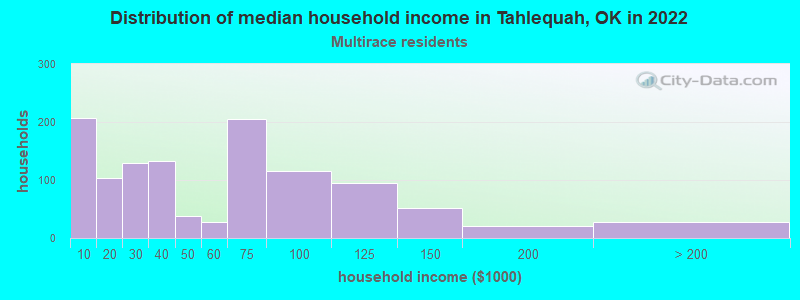
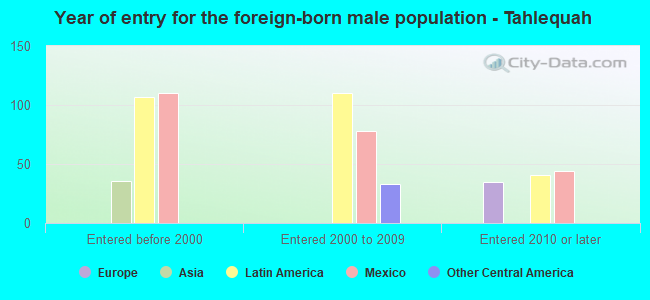
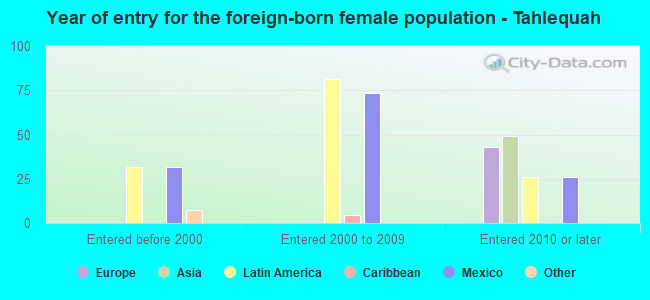
According to 2022 data, the most numerous races in Tahlequah, OK are White alone (7,417 residents), Hispanic (1,550 residents), and Two or more races (2,577 residents). 91.4% of Tahlequah residents speak English at home. 3.3% of Tahlequah, OK residents are foreign-born (2.4% born in Latin America, 0.5% born in Asia, 0.4% born in Europe), which is 79.7% less than the foreign-born rate of 6.0% across the entire state of Oklahoma.
Race distribution in Tahlequah
2000 2022
2,556,368 74.1% White alone 266,158 7.7% American Indian alone 257,981 7.5% Black alone 179,304 5.2% Hispanic 140,249 4.1% Two or more races 46,172 1.3% Asian alone 2,322 0.07% Other race alone 2,100 0.06% Native Hawaiian and Other
2,517,403 62.6% White alone 486,692 12.1% Hispanic 364,453 9.1% Two or more races 273,650 6.8% American Indian alone 268,543 6.7% Black alone 92,672 2.3% Asian alone 10,786 0.3% Other race alone 5,601 0.1% Native Hawaiian and Other
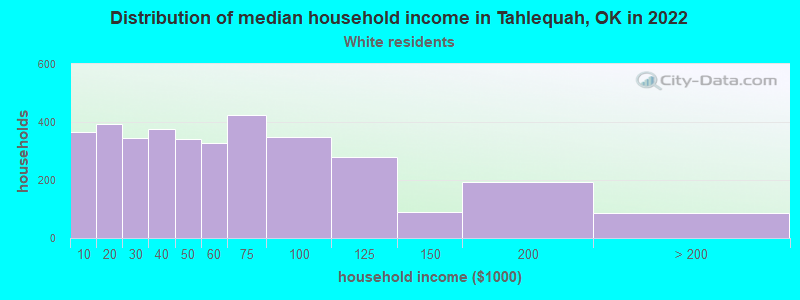
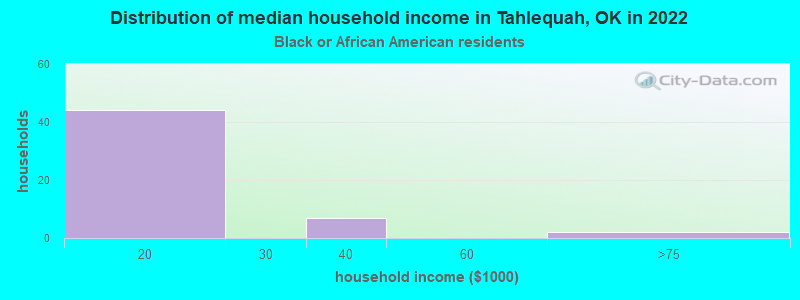
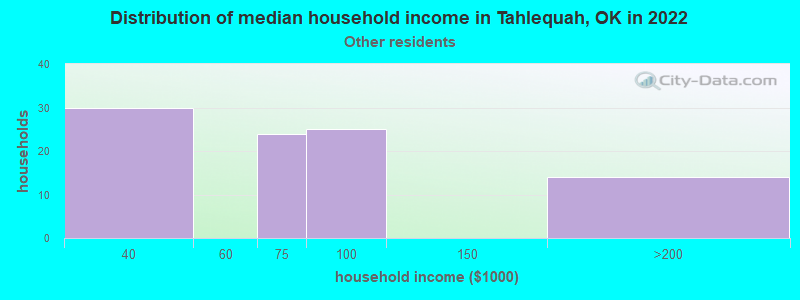
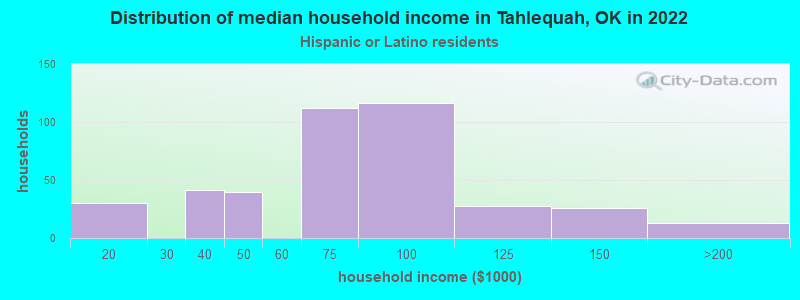
Income and house value in Tahlequah Median household income in 2022 $47,907 White non-Hispanic householders$16,537 Black householders$45,959 American Indian and Alaska Native householders$67,759 Some other race householders$42,378 Two or more races householders$69,630 Hispanic or Latino race householdersMedian 2022 house value $216,457 White Non-Hispanic householders$102,267 Black or African American householders$159,230 American Indian or Alaska Native householders$184,134 Some other race householders$180,425 Two or more races householders$160,554 Hispanic or Latino householders
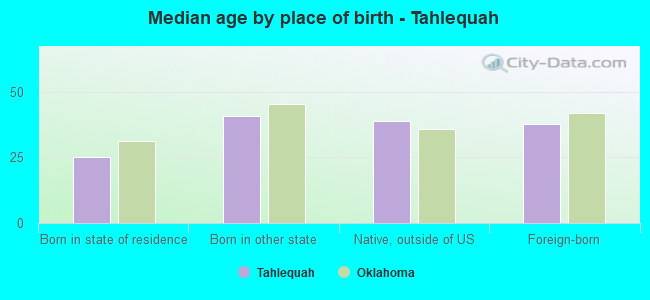
Median age by race in Tahlequah
38.8 Median age for White residents31.9 44.3 22.4 Median age for Black or African American residents20.8 22.9 28.9 Median age for American Indian / Alaska Native residents26.4 32.1 38.6 Median age for Asian residents40.6 23.8 -725,225,224.5 Median age for Native Hawaiian / Pacific Islander residents-675,324,674.6 -767,251,461.2 22.6 Median age for Other race residents32.1 20.1 23.9 Median age for Two or more races residents25.2 24.0 39.1 Median age for White alone residents33.1 45.2 19.8 Median age for Hispanic or Latino residents22.3 18.9
Owner/renter occupied households by race in Tahlequah
House owners and renters - White residents 1,765 50.5% Owner occupied1,732 49.5% Renter occupiedHouse owners and renters - Black or African American residents 15 27.2% Owner occupied40 72.8% Renter occupiedHouse owners and renters - American Indian / Alaska Native residents 622 36.1% Owner occupied1,103 63.9% Renter occupiedHouse owners and renters - Asian residents 27 28.3% Owner occupied69 71.7% Renter occupiedHouse owners and renters - Other race residents 30 32.8% Owner occupied61 67.2% Renter occupiedHouse owners and renters - Two or more races residents 278 23.5% Owner occupied904 76.5% Renter occupiedHouse owners and renters - White alone residents 1,680 49.2% Owner occupied1,735 50.8% Renter occupiedHouse owners and renters - Hispanic or Latino residents 209 50.7% Owner occupied204 49.3% Renter occupied
Language usage in Tahlequah
English speakers - Total 91.4% of residents of Tahlequah speak English at home.
5.4% of residents speak Spanish at home 599 69.6% Speak English very well262 30.4% Speak English less than very well3.1% of residents speak other language at home 462 94.5% Speak English very well27 5.5% Speak English less than very well
English speakers - Born in the United States 94.1% of residents of Tahlequah speak English at home.
4.7% of residents speak Spanish at home 189 78.8% Speak English very well51 21.2% Speak English less than very well1.3% of residents speak other language at home 66 100.0% Speak English very well
English speakers - Native, born elsewhere 61.7% of residents of Tahlequah speak English at home.
36.7% of residents speak Spanish at home 22 100.0% Speak English very well
English speakers - Foreign-born 23.1% of residents of Tahlequah speak English at home.
55.2% of residents speak Spanish at home 134 43.9% Speak English very well171 56.1% Speak English less than very well20.8% of residents speak other language at home 94 81.7% Speak English very well21 18.3% Speak English less than very well
White (Caucasian) - Speak only English Native:
97.3% (7,192)Foreign-born:
35.0% (46)
White (Caucasian) - Speak another language Native:
2.6% (189)Foreign-born:
65.8% (87)
Black or African American - Speak only English Native:
100.0% (366)Foreign-born:
89.3% (5)
Asian - Speak only English Native:
99.7% (92)Foreign-born:
18.8% (17)
Other race - Speak only English Native:
39.4% (50)Foreign-born:
18.9% (34)
Other race - Speak another language Native:
60.7% (76)Foreign-born:
81.2% (144)
Two or more races - Speak only English Native:
87.0% (2,561)Foreign-born:
33.7% (39)
Two or more races - Speak another language Native:
12.2% (360)Foreign-born:
54.6% (64)
White alone - Speak only English Native:
98.0% (7,071)Foreign-born:
51.8% (50)
White alone - Speak another language Native:
2.0% (144)Foreign-born:
48.4% (47)
Hispanic or Latino - Speak only English Native:
55.8% (569)Foreign-born:
19.9% (74)
Hispanic or Latino - Speak another language Native:
44.3% (452)Foreign-born:
81.4% (303)
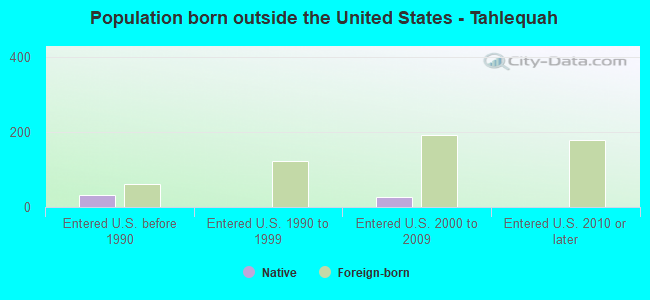
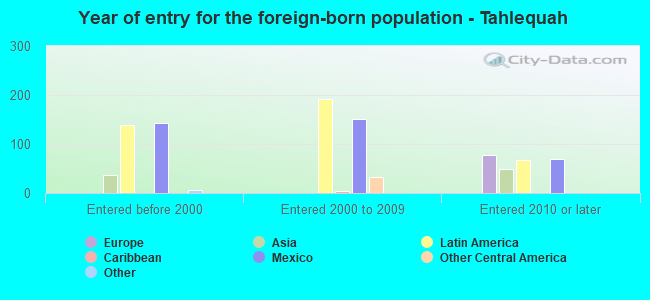
Foreign-born residents in Tahlequah 554 residents are foreign born (2.4% Latin America , 0.5% Asia , 0.4% Europe ).
This city:
3.3%Oklahoma:
6.1%
Marital status for residents in Tahlequah Marital status - White (Caucasian) population 15 years and over
Males 38.4% Never married47.4% Now married1.0% Separated3.4% Widowed9.8% DivorcedFemales 26.5% Never married42.1% Now married1.2% Separated18.8% Widowed11.4% DivorcedWomen who gave birth in the past 12 months Now married:
69.0% (39)Unmarried:
31.0% (17)
Women who did not give birth in the past 12 months Now married:
44.2% (858)Unmarried:
55.8% (1,083)
Marital status - Black or African American population 15 years and over
Males 71.7% Never married4.1% Now married4.1% Separated0.0% Widowed20.0% DivorcedFemales 68.8% Never married23.3% Now married0.0% Separated4.2% Widowed3.7% DivorcedWomen who did not give birth in the past 12 months Now married:
26.7% (51)Unmarried:
73.3% (139)
Marital status - American Indian / Alaska Native population 15 years and over
Males 53.6% Never married30.0% Now married1.5% Separated4.1% Widowed10.7% DivorcedFemales 48.6% Never married28.9% Now married2.0% Separated9.4% Widowed11.1% DivorcedWomen who gave birth in the past 12 months Now married:
43.1% (48)Unmarried:
56.9% (63)
Women who did not give birth in the past 12 months Now married:
25.1% (325)Unmarried:
74.9% (969)
Marital status - Asian population 15 years and over
Males 0.0% Never married27.4% Now married0.0% Separated0.0% Widowed72.6% DivorcedFemales 76.8% Never married23.2% Now married0.0% Separated0.0% Widowed0.0% DivorcedWomen who did not give birth in the past 12 months Now married:
23.2% (13)Unmarried:
76.8% (43)
Marital status - Other race population 15 years and over
Males 44.3% Never married43.6% Now married0.0% Separated0.0% Widowed12.1% DivorcedFemales 45.9% Never married41.2% Now married0.0% Separated0.0% Widowed12.9% DivorcedWomen who did not give birth in the past 12 months Now married:
41.2% (41)Unmarried:
58.8% (58)
Marital status - Two or more races population 15 years and over
Males 54.7% Never married29.9% Now married3.8% Separated1.7% Widowed9.9% DivorcedFemales 67.4% Never married25.7% Now married0.0% Separated2.8% Widowed4.0% DivorcedWomen who gave birth in the past 12 months Now married:
0.0% (0)Unmarried:
100.0% (32)
Women who did not give birth in the past 12 months Now married:
25.8% (288)Unmarried:
74.2% (830)
Marital status - White alone, not Hispanic / Latino population 15 years and over
Males 39.7% Never married46.0% Now married1.0% Separated3.6% Widowed9.7% DivorcedFemales 26.7% Never married41.2% Now married0.9% Separated19.3% Widowed11.8% DivorcedWomen who gave birth in the past 12 months Now married:
69.0% (40)Unmarried:
31.0% (18)
Women who did not give birth in the past 12 months Now married:
43.3% (838)Unmarried:
56.7% (1,099)
Marital status - Hispanic or Latino population 15 years and over
Males 31.8% Never married50.7% Now married0.0% Separated0.0% Widowed17.5% DivorcedFemales 49.6% Never married45.2% Now married2.4% Separated0.0% Widowed2.7% DivorcedWomen who did not give birth in the past 12 months Now married:
39.9% (156)Unmarried:
60.1% (235)
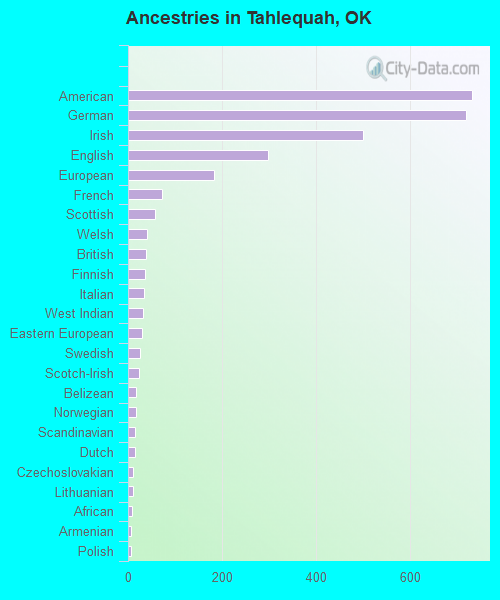
Ancestries in Tahlequah
731 7.8% American718 7.7% German500 5.3% Irish297 3.2% English182 1.9% European73 0.8% French57 0.6% Scottish40 0.4% Welsh39 0.4% British37 0.4% Finnish35 0.4% Italian31 0.3% West Indian29 0.3% Eastern European25 0.3% Swedish23 0.2% Scotch-Irish18 0.2% Belizean17 0.2% Norwegian15 0.2% Scandinavian14 0.1% Dutch11 0.1% Czechoslovakian11 0.1% Lithuanian8 0.09% African7 0.07% Armenian7 0.07% Polish
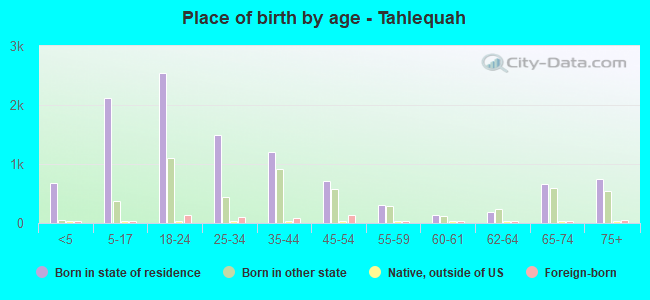
Children Nativity (place of birth) in Tahlequah
Children under 6 years - Living with two parents Both parents native 408 100.0% NativeBoth parents foreign-born 14 100.0% NativeOne native, one foreign-born parent 45 100.0% NativeChildren under 6 years - Living with one parent Native parent 350 100.0% NativeForeign-born parent 30 100.0% NativeChildren 6 to 17 years - Living with two parents Both parents native 1,389 100.0% Native0 0.0% Foreign-bornBoth parents foreign-born 14 74.4% Native5 25.6% Foreign-bornOne native, one foreign-born parent 131 100.0% NativeChildren 6 to 17 years - Living with one parent Native parent 544 100.0% NativeForeign-born parent 13 49.9% Native13 50.1% Foreign-born
Grandparents responsible for own grandchildren in Tahlequah
Grandparents (30 to 59 years) White / Caucasian 35 100.0% Responsible for grandchildrenAmerican Indian / Alaska Native 23 100.0% Responsible for grandchildrenOther race 24 100.0% Responsible for grandchildrenTwo or more races 17 38.2% Responsible for grandchildren28 61.8% Not responsible for grandchildrenWhite alone, not Hispanic / Latino 37 100.0% Responsible for grandchildrenHispanic or Latino 25 100.0% Responsible for grandchildrenGrandparents (60 years and over) White / Caucasian 73 36.7% Responsible for grandchildren125 63.3% Not responsible for grandchildrenAmerican Indian / Alaska Native 40 67.8% Responsible for grandchildren19 32.2% Not responsible for grandchildrenOther race 28 100.0% Responsible for grandchildrenWhite alone, not Hispanic / Latino 72 46.2% Responsible for grandchildren84 53.8% Not responsible for grandchildrenHispanic or Latino 32 39.0% Responsible for grandchildren51 61.0% Not responsible for grandchildren