Races in Tanglewilde-Thompson Place, Washington (WA) Detailed Stats
Ancestries, Foreign-born residents, place of birth

Discuss Tanglewilde-Thompson Place, Washington races on our local forum with over 2,400,000 registered users
9.7% of Tanglewilde-Thompson Place, WA residents are foreign-born (5.0% born in Asia, 2.1% born in Latin America, 1.9% born in Europe), which is 54.6% less than the foreign-born rate of 15.0% across the entire state of Washington.
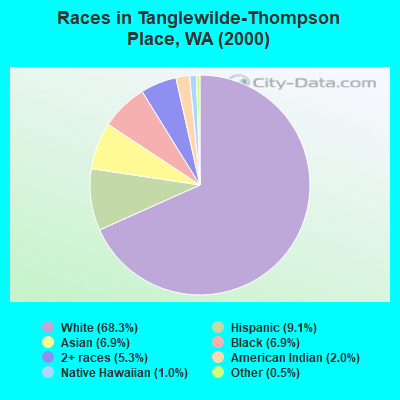
Race distribution in Tanglewilde-Thompson Place

- 3,87168.3%White alone
- 5169.1%Hispanic
- 3926.9%Asian alone
- 3906.9%Black alone
- 3005.3%Two or more races
- 1152.0%American Indian alone
- 561.0%Native Hawaiian and Other
Pacific Islander alone - 300.5%Other race alone
2000
2022
-
- 4,652,49078.9%White alone
- 441,5097.5%Hispanic
- 319,4015.4%Asian alone
- 184,6313.1%Black alone
- 175,9263.0%Two or more races
- 85,3961.4%American Indian alone
- 22,7790.4%Native Hawaiian and Other
Pacific Islander alone - 11,9890.2%Other race alone

-
- 4,941,45663.5%White alone
- 1,093,31314.0%Hispanic
- 755,8329.7%Asian alone
- 523,4486.7%Two or more races
- 299,5373.8%Black alone
- 69,0240.9%American Indian alone
- 52,2310.7%Native Hawaiian and Other
Pacific Islander alone - 50,9450.7%Other race alone

Income and house value in Tanglewilde-Thompson Place
- Median household income in 2022
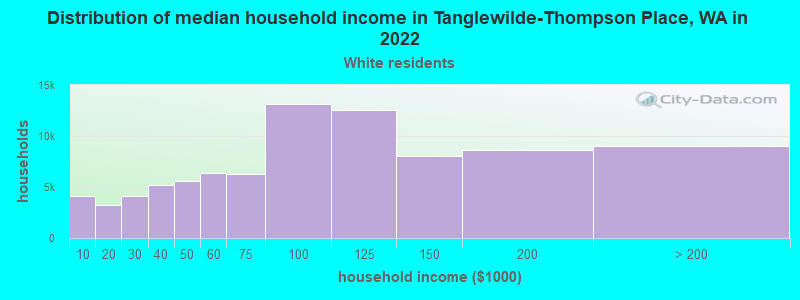
- $82,762White non-Hispanic householders
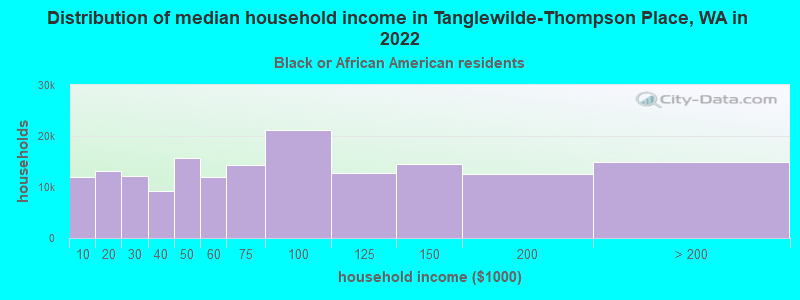
- $81,984Black householders
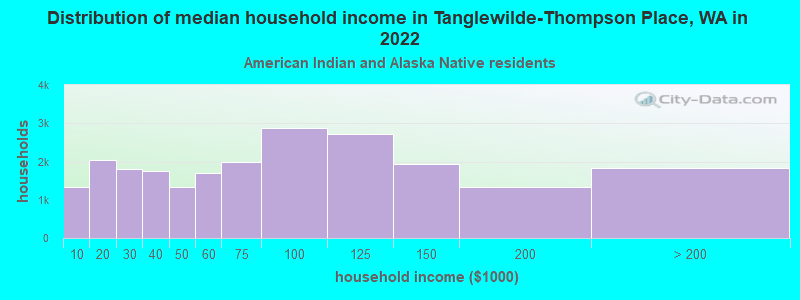
- $93,158American Indian and Alaska Native householders
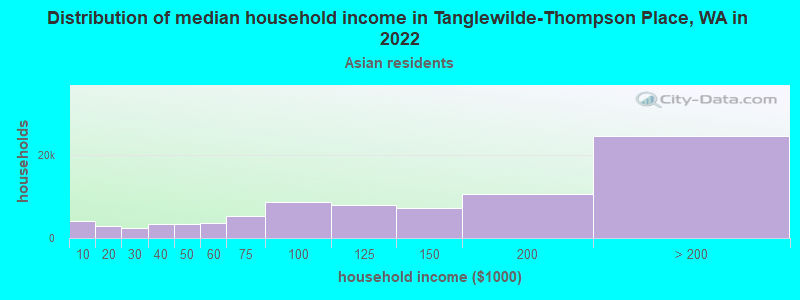
- $60,096Asian householders
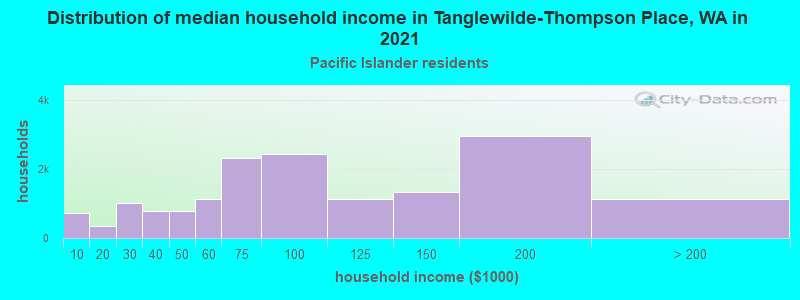
- $92,531Native Hawaiian and other Pacific Islander householders
- $71,294Some other race householders
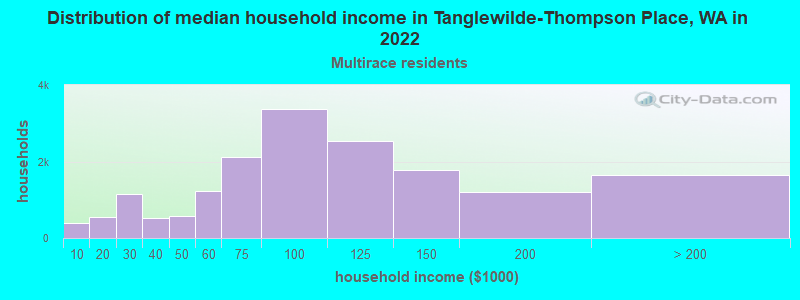
- $140,597Two or more races householders
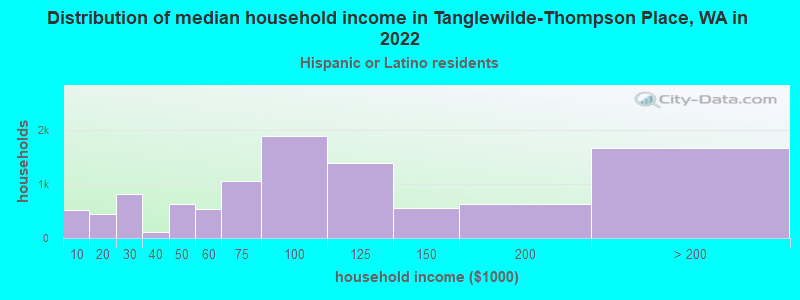
- $90,728Hispanic or Latino race householders
- Median 2022 house value
- $420,230White Non-Hispanic householders
- $517,287Black or African American householders
- $546,826American Indian or Alaska Native householders
- $423,043Asian householders
- $449,417Native Hawaiian and other Pacific Islander householders
- $395,614Some other race householders
- $420,581Two or more races householders
- $395,614Hispanic or Latino householders
Household income for White non-Hispanic householders
Household income for Black householders
Household income for American Indian and Alaska Native householders
Household income for Asian householders
Household income for Native Hawaiian and other Pacific Islander householders
Household income for Two or more races householders
Household income for Hispanic or Latino race householders
Foreign-born residents in Tanglewilde-Thompson Place
550 residents are foreign born (5.0% Asia, 2.1% Latin America, 1.9% Europe).
| This city: | 9.7% |
| Washington: | 10.4% |
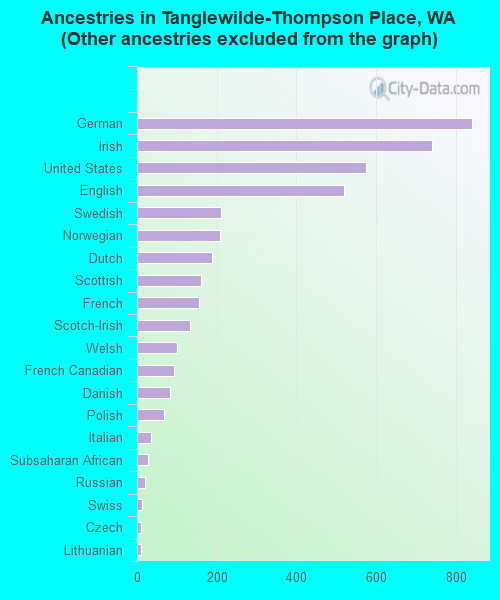
Ancestries in Tanglewilde-Thompson Place

- 2,10633.5%Other
- 84213.4%German
- 74111.8%Irish
- 5749.1%United States
- 5198.2%English
- 2103.3%Swedish
- 2093.3%Norwegian
- 1893.0%Dutch
- 1602.5%Scottish
- 1552.5%French
- 1332.1%Scotch-Irish
- 1001.6%Welsh
- 931.5%French Canadian
- 831.3%Danish
- 691.1%Polish
- 340.5%Italian
- 280.4%Subsaharan African
- 190.3%Russian
- 130.2%Swiss
- 90.1%Czech
- 90.1%Lithuanian
Zip codes: 98503.