Races in Tanglewilde, Washington (WA) Detailed Stats
Data:
Races - White alone (%)
Races - White alone (% change since 2000)
Races - Black alone (%)
Races - Black alone (% change since 2000)
Races - American Indian alone (%)
Races - American Indian alone (% change since 2000)
Races - Asian alone (%)
Races - Asian alone (% change since 2000)
Races - Hispanic (%)
Races - Hispanic (% change since 2000)
Races - Native Hawaiian and Other Pacific Islander alone (%)
Races - Native Hawaiian and Other Pacific Islander alone (% change since 2000)
Races - Two or more races(%)
Races - Two or more races(% change since 2000)
Races - Other race alone (%)
Races - Other race alone (% change since 2000)
Racial diversity
Place of birth - Born in state of residence (%)
Place of birth - Born in state of residence (%) - White
Place of birth - Born in state of residence (%) - Black or African American
Place of birth - Born in state of residence (%) - Asian
Place of birth - Born in state of residence (%) - Hispanic or Latino
Place of birth - Born in state of residence (%) - American Indian and Alaska Native
Place of birth - Born in state of residence (%) - Multirace
Place of birth - Born in state of residence (%) - Other Race
Place of birth - Born in other state (%)
Place of birth - Born in other state (%) - White
Place of birth - Born in other state (%) - Black or African American
Place of birth - Born in other state (%) - Asian
Place of birth - Born in other state (%) - Hispanic or Latino
Place of birth - Born in other state (%) - American Indian and Alaska Native
Place of birth - Born in other state (%) - Multirace
Place of birth - Born in other state (%) - Other Race
Place of birth - Native, outside of US (%)
Place of birth - Native, outside of US (%) - White
Place of birth - Native, outside of US (%) - Black or African American
Place of birth - Native, outside of US (%) - Asian
Place of birth - Native, outside of US (%) - Hispanic or Latino
Place of birth - Native, outside of US (%) - American Indian and Alaska Native
Place of birth - Native, outside of US (%) - Multirace
Place of birth - Native, outside of US (%) - Other Race
Place of birth - Foreign born (%)
Place of birth - Foreign born (%) - White
Place of birth - Foreign born (%) - Black or African American
Place of birth - Foreign born (%) - Asian
Place of birth - Foreign born (%) - Hispanic or Latino
Place of birth - Foreign born (%) - American Indian and Alaska Native
Place of birth - Foreign born (%) - Multirace
Place of birth - Foreign born (%) - Other Race
Residents speaking English at home (%)
Residents speaking English at home - Born in the United States (%)
Residents speaking English at home - Native, born elsewhere (%)
Residents speaking English at home - Foreign born (%)
Residents speaking Spanish at home (%)
Residents speaking Spanish at home - Born in the United States (%)
Residents speaking Spanish at home - Native, born elsewhere (%)
Residents speaking Spanish at home - Foreign born (%)
Residents speaking other language at home (%)
Residents speaking other language at home - Born in the United States (%)
Residents speaking other language at home - Native, born elsewhere (%)
Residents speaking other language at home - Foreign born (%)
Marital status - Never married (%)
Marital status - Now married (%)
Marital status - Separated (%)
Marital status - Widowed (%)
Marital status - Divorced (%)
Ancestries Reported - Arab (%)
Ancestries Reported - Czech (%)
Ancestries Reported - Danish (%)
Ancestries Reported - Dutch (%)
Ancestries Reported - English (%)
Ancestries Reported - French (%)
Ancestries Reported - French Canadian (%)
Ancestries Reported - German (%)
Ancestries Reported - Greek (%)
Ancestries Reported - Hungarian (%)
Ancestries Reported - Irish (%)
Ancestries Reported - Italian (%)
Ancestries Reported - Lithuanian (%)
Ancestries Reported - Norwegian (%)
Ancestries Reported - Polish (%)
Ancestries Reported - Portuguese (%)
Ancestries Reported - Russian (%)
Ancestries Reported - Scotch-Irish (%)
Ancestries Reported - Scottish (%)
Ancestries Reported - Slovak (%)
Ancestries Reported - Subsaharan African (%)
Ancestries Reported - Swedish (%)
Ancestries Reported - Swiss (%)
Ancestries Reported - Ukrainian (%)
Ancestries Reported - United States (%)
Ancestries Reported - Welsh (%)
Ancestries Reported - West Indian (%)
Ancestries Reported - Other (%)
Geographical mobility - Same house 1 year ago (%)
Geographical mobility - Same house 1 year ago (%) - White
Geographical mobility - Same house 1 year ago (%) - Black or African American
Geographical mobility - Same house 1 year ago (%) - Asian
Geographical mobility - Same house 1 year ago (%) - Hispanic or Latino
Geographical mobility - Same house 1 year ago (%) - American Indian and Alaska Native
Geographical mobility - Same house 1 year ago (%) - Multirace
Geographical mobility - Same house 1 year ago (%) - Other Race
Geographical mobility - Moved within same county (%)
Geographical mobility - Moved within same county (%) - White
Geographical mobility - Moved within same county (%) - Black or African American
Geographical mobility - Moved within same county (%) - Asian
Geographical mobility - Moved within same county (%) - Hispanic or Latino
Geographical mobility - Moved within same county (%) - American Indian and Alaska Native
Geographical mobility - Moved within same county (%) - Multirace
Geographical mobility - Moved within same county (%) - Other Race
Geographical mobility - Moved from different county within same state (%)
Geographical mobility - Moved from different county within same state (%) - White
Geographical mobility - Moved from different county within same state (%) - Black or African American
Geographical mobility - Moved from different county within same state (%) - Asian
Geographical mobility - Moved from different county within same state (%) - Hispanic or Latino
Geographical mobility - Moved from different county within same state (%) - American Indian and Alaska Native
Geographical mobility - Moved from different county within same state (%) - Multirace
Geographical mobility - Moved from different county within same state (%) - Other Race
Geographical mobility - Moved from different state (%)
Geographical mobility - Moved from different state (%) - White
Geographical mobility - Moved from different state (%) - Black or African American
Geographical mobility - Moved from different state (%) - Asian
Geographical mobility - Moved from different state (%) - Hispanic or Latino
Geographical mobility - Moved from different state (%) - American Indian and Alaska Native
Geographical mobility - Moved from different state (%) - Multirace
Geographical mobility - Moved from different state (%) - Other Race
Geographical mobility - Moved from abroad (%)
Geographical mobility - Moved from abroad (%) - White
Geographical mobility - Moved from abroad (%) - Black or African American
Geographical mobility - Moved from abroad (%) - Asian
Geographical mobility - Moved from abroad (%) - Hispanic or Latino
Geographical mobility - Moved from abroad (%) - American Indian and Alaska Native
Geographical mobility - Moved from abroad (%) - Multirace
Geographical mobility - Moved from abroad (%) - Other Race
Place of birth for the foreign-born population - Ireland (%)
Place of birth for the foreign-born population - Denmark (%)
Place of birth for the foreign-born population - Norway (%)
Place of birth for the foreign-born population - Sweden (%)
Place of birth for the foreign-born population - United Kingdom (%)
Place of birth for the foreign-born population - England (%)
Place of birth for the foreign-born population - Scotland (%)
Place of birth for the foreign-born population - Other Northern Europe (%)
Place of birth for the foreign-born population - Austria (%)
Place of birth for the foreign-born population - Belgium (%)
Place of birth for the foreign-born population - France (%)
Place of birth for the foreign-born population - Germany (%)
Place of birth for the foreign-born population - Netherlands (%)
Place of birth for the foreign-born population - Switzerland (%)
Place of birth for the foreign-born population - Other Western Europe (%)
Place of birth for the foreign-born population - Greece (%)
Place of birth for the foreign-born population - Italy (%)
Place of birth for the foreign-born population - Portugal (%)
Place of birth for the foreign-born population - Spain (%)
Place of birth for the foreign-born population - Other Southern Europe (%)
Place of birth for the foreign-born population - Albania (%)
Place of birth for the foreign-born population - Belarus (%)
Place of birth for the foreign-born population - Bosnia and Herzegovina (%)
Place of birth for the foreign-born population - Bulgaria (%)
Place of birth for the foreign-born population - Croatia (%)
Place of birth for the foreign-born population - Czechoslovakia (%)
Place of birth for the foreign-born population - Hungary (%)
Place of birth for the foreign-born population - Latvia (%)
Place of birth for the foreign-born population - Lithuania (%)
Place of birth for the foreign-born population - North Macedonia (Macedonia) (%)
Place of birth for the foreign-born population - Moldova (%)
Place of birth for the foreign-born population - Poland (%)
Place of birth for the foreign-born population - Romania (%)
Place of birth for the foreign-born population - Russia (%)
Place of birth for the foreign-born population - Serbia (%)
Place of birth for the foreign-born population - Ukraine (%)
Place of birth for the foreign-born population - Other Eastern Europe (%)
Place of birth for the foreign-born population - China (%)
Place of birth for the foreign-born population - Hong Kong (%)
Place of birth for the foreign-born population - Taiwan (%)
Place of birth for the foreign-born population - Japan (%)
Place of birth for the foreign-born population - Korea (%)
Place of birth for the foreign-born population - Other Eastern Asia (%)
Place of birth for the foreign-born population - Afghanistan (%)
Place of birth for the foreign-born population - Bangladesh (%)
Place of birth for the foreign-born population - India (%)
Place of birth for the foreign-born population - Iran (%)
Place of birth for the foreign-born population - Kazakhstan (%)
Place of birth for the foreign-born population - Nepal (%)
Place of birth for the foreign-born population - Pakistan (%)
Place of birth for the foreign-born population - Sri Lanka (%)
Place of birth for the foreign-born population - Uzbekistan (%)
Place of birth for the foreign-born population - Other South Central Asia (%)
Place of birth for the foreign-born population - Burma (%)
Place of birth for the foreign-born population - Cambodia (%)
Place of birth for the foreign-born population - Indonesia (%)
Place of birth for the foreign-born population - Laos (%)
Place of birth for the foreign-born population - Malaysia (%)
Place of birth for the foreign-born population - Philippines (%)
Place of birth for the foreign-born population - Singapore (%)
Place of birth for the foreign-born population - Thailand (%)
Place of birth for the foreign-born population - Vietnam (%)
Place of birth for the foreign-born population - Other South Eastern Asia (%)
Place of birth for the foreign-born population - Armenia (%)
Place of birth for the foreign-born population - Iraq (%)
Place of birth for the foreign-born population - Israel (%)
Place of birth for the foreign-born population - Jordan (%)
Place of birth for the foreign-born population - Kuwait (%)
Place of birth for the foreign-born population - Lebanon (%)
Place of birth for the foreign-born population - Saudi Arabia (%)
Place of birth for the foreign-born population - Syria (%)
Place of birth for the foreign-born population - Turkey (%)
Place of birth for the foreign-born population - Yemen (%)
Place of birth for the foreign-born population - Other Western Asia (%)
Place of birth for the foreign-born population - Eritrea (%)
Place of birth for the foreign-born population - Ethiopia (%)
Place of birth for the foreign-born population - Kenya (%)
Place of birth for the foreign-born population - Somalia (%)
Place of birth for the foreign-born population - Uganda (%)
Place of birth for the foreign-born population - Zimbabwe (%)
Place of birth for the foreign-born population - Other Eastern Africa (%)
Place of birth for the foreign-born population - Cameroon (%)
Place of birth for the foreign-born population - Congo (%)
Place of birth for the foreign-born population - Democratic Republic of Congo (Zaire) (%)
Place of birth for the foreign-born population - Other Middle Africa (%)
Place of birth for the foreign-born population - Egypt (%)
Place of birth for the foreign-born population - Morocco (%)
Place of birth for the foreign-born population - Sudan (%)
Place of birth for the foreign-born population - Other Northern Africa (%)
Place of birth for the foreign-born population - South Africa (%)
Place of birth for the foreign-born population - Other Southern Africa (%)
Place of birth for the foreign-born population - Cabo Verde (%)
Place of birth for the foreign-born population - Ghana (%)
Place of birth for the foreign-born population - Liberia (%)
Place of birth for the foreign-born population - Nigeria (%)
Place of birth for the foreign-born population - Senegal (%)
Place of birth for the foreign-born population - Sierra Leone (%)
Place of birth for the foreign-born population - Other Western Africa (%)
Place of birth for the foreign-born population - Australia (%)
Place of birth for the foreign-born population - New Zealand (%)
Place of birth for the foreign-born population - Fiji (%)
Place of birth for the foreign-born population - Micronesia (%)
Place of birth for the foreign-born population - Bahamas (%)
Place of birth for the foreign-born population - Barbados (%)
Place of birth for the foreign-born population - Cuba (%)
Place of birth for the foreign-born population - Dominica (%)
Place of birth for the foreign-born population - Dominican Republic (%)
Place of birth for the foreign-born population - Grenada (%)
Place of birth for the foreign-born population - Haiti (%)
Place of birth for the foreign-born population - Jamaica (%)
Place of birth for the foreign-born population - St. Vincent and the Grenadines (%)
Place of birth for the foreign-born population - Trinidad and Tobago (%)
Place of birth for the foreign-born population - West Indies (%)
Place of birth for the foreign-born population - Other Caribbean (%)
Place of birth for the foreign-born population - Belize (%)
Place of birth for the foreign-born population - Costa Rica (%)
Place of birth for the foreign-born population - El Salvador (%)
Place of birth for the foreign-born population - Guatemala (%)
Place of birth for the foreign-born population - Honduras (%)
Place of birth for the foreign-born population - Mexico (%)
Place of birth for the foreign-born population - Nicaragua (%)
Place of birth for the foreign-born population - Panama (%)
Place of birth for the foreign-born population - Other Central America (%)
Place of birth for the foreign-born population - Argentina (%)
Place of birth for the foreign-born population - Bolivia (%)
Place of birth for the foreign-born population - Brazil (%)
Place of birth for the foreign-born population - Chile (%)
Place of birth for the foreign-born population - Colombia (%)
Place of birth for the foreign-born population - Ecuador (%)
Place of birth for the foreign-born population - Guyana (%)
Place of birth for the foreign-born population - Peru (%)
Place of birth for the foreign-born population - Uruguay (%)
Place of birth for the foreign-born population - Venezuela (%)
Place of birth for the foreign-born population - Other South America (%)
Place of birth for the foreign-born population - Canada (%)
Place of birth for the foreign-born population - Other Northern America (%)
Place of birth for the foreign-born population - Other (%)
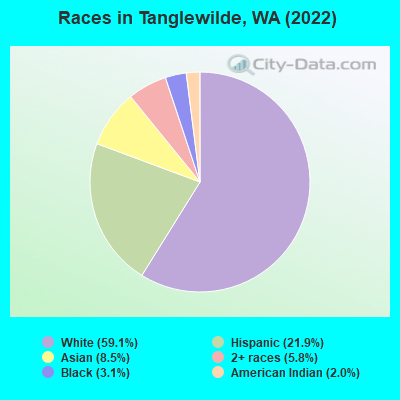
According to 2022 data, the most numerous races in Tanglewilde, WA are White alone (3,847 residents), Hispanic (1,427 residents), and Asian alone (553 residents). 78.7% of Tanglewilde residents speak English at home.
Race distribution in Tanglewilde 3,847 59.1% White alone 1,427 21.9% Hispanic 553 8.5% Asian alone 374 5.8% Two or more races 200 3.1% Black alone 129 2.0% American Indian alone
2000 2022
4,652,490 78.9% White alone 441,509 7.5% Hispanic 319,401 5.4% Asian alone 184,631 3.1% Black alone 175,926 3.0% Two or more races 85,396 1.4% American Indian alone 22,779 0.4% Native Hawaiian and Other 11,989 0.2% Other race alone
4,941,456 63.5% White alone 1,093,313 14.0% Hispanic 755,832 9.7% Asian alone 523,448 6.7% Two or more races 299,537 3.8% Black alone 69,024 0.9% American Indian alone 52,231 0.7% Native Hawaiian and Other 50,945 0.7% Other race alone
Income and house value in Tanglewilde Median household income in 2022 $89,800 White non-Hispanic householders$144,145 Black householders$3,019 American Indian and Alaska Native householders$104,343 Two or more races householders$100,166 Hispanic or Latino race householders
Median age by race in Tanglewilde
41.7 Median age for White residents46.0 39.9 33.6 Median age for Black or African American residents31.7 47.8 57.8 Median age for American Indian / Alaska Native residents59.0 -540,682,414.2 58.2 Median age for Asian residents70.4 55.5 -768,670,308.9 Median age for Native Hawaiian / Pacific Islander residents-810,861,422.4 -642,361,110.5 29.4 Median age for Other race residents20.9 76.6 19.8 Median age for Two or more races residents23.7 4.4 48.5 Median age for White alone residents49.9 45.9 18.8 Median age for Hispanic or Latino residents24.1 6.8
Owner/renter occupied households by race in Tanglewilde
House owners and renters - White residents 1,136 66.0% Owner occupied586 34.0% Renter occupiedHouse owners and renters - Black or African American residents 79 88.1% Owner occupied11 11.9% Renter occupiedHouse owners and renters - American Indian / Alaska Native residents 14 16.9% Owner occupied66 83.1% Renter occupiedHouse owners and renters - Asian residents 110 46.4% Owner occupied127 53.6% Renter occupiedHouse owners and renters - Other race residents 59 100.0% Owner occupiedHouse owners and renters - Two or more races residents 116 39.7% Owner occupied177 60.3% Renter occupiedHouse owners and renters - White alone residents 1,116 68.8% Owner occupied506 31.2% Renter occupiedHouse owners and renters - Hispanic or Latino residents 130 35.7% Owner occupied233 64.3% Renter occupied
Language usage in Tanglewilde
English speakers - Total 78.7% of residents of Tanglewilde speak English at home.
8.3% of residents speak Spanish at home 360 73.2% Speak English very well132 26.8% Speak English less than very well11.9% of residents speak other language at home 403 56.8% Speak English very well306 43.2% Speak English less than very well
English speakers - Born in the United States 83.3% of residents of Tanglewilde speak English at home.
9.8% of residents speak Spanish at home 209 83.9% Speak English very well40 16.1% Speak English less than very well3.0% of residents speak other language at home 77 100.0% Speak English very well
English speakers - Native, born elsewhere 71.0% of residents of Tanglewilde speak English at home.
31.3% of residents speak other language at home 54 65.9% Speak English very well28 34.1% Speak English less than very well
English speakers - Foreign-born 13.2% of residents of Tanglewilde speak English at home.
28.5% of residents speak Spanish at home 124 59.0% Speak English very well86 41.0% Speak English less than very well57.6% of residents speak other language at home 138 32.5% Speak English very well286 67.5% Speak English less than very well
White (Caucasian) - Speak only English Native:
96.1% (3,846)Foreign-born:
32.8% (50)
White (Caucasian) - Speak another language Native:
3.2% (128)Foreign-born:
65.4% (99)
Black or African American - Speak only English Native:
66.6% (109)Foreign-born:
100.0% (17)
Asian - Speak only English Native:
59.6% (120)Foreign-born:
9.0% (30)
Asian - Speak another language Native:
33.0% (66)Foreign-born:
91.1% (302)
Other race - Speak another language Native:
31.0% (59)Foreign-born:
77.6% (112)
Two or more races - Speak another language Native:
65.6% (329)Foreign-born:
100.0% (75)
White alone - Speak only English Native:
96.8% (3,389)Foreign-born:
32.1% (54)
White alone - Speak another language Native:
2.6% (92)Foreign-born:
64.6% (109)
Hispanic or Latino - Speak only English Native:
64.3% (654)Foreign-born:
3.1% (6)
Hispanic or Latino - Speak another language Native:
34.1% (346)Foreign-born:
96.0% (191)
Foreign-born residents in Tanglewilde
Marital status for residents in Tanglewilde Marital status - White (Caucasian) population 15 years and over
Males 27.3% Never married60.2% Now married0.0% Separated1.5% Widowed10.9% DivorcedFemales 17.6% Never married52.7% Now married0.0% Separated18.3% Widowed11.4% DivorcedWomen who gave birth in the past 12 months Now married:
20.5% (16)Unmarried:
79.5% (60)
Women who did not give birth in the past 12 months Now married:
47.7% (440)Unmarried:
52.3% (482)
Marital status - Black or African American population 15 years and over
Males 0.0% Never married100.0% Now married0.0% Separated0.0% Widowed0.0% DivorcedFemales 50.0% Never married0.0% Now married0.0% Separated26.2% Widowed23.8% DivorcedWomen who did not give birth in the past 12 months Now married:
0.0% (0)Unmarried:
100.0% (25)
Marital status - American Indian / Alaska Native population 15 years and over
Males 8.8% Never married91.2% Now married0.0% Separated0.0% Widowed0.0% DivorcedFemales 73.8% Never married26.2% Now married0.0% Separated0.0% Widowed0.0% DivorcedWomen who did not give birth in the past 12 months Now married:
0.0% (0)Unmarried:
100.0% (37)
Marital status - Asian population 15 years and over
Males 13.1% Never married86.9% Now married0.0% Separated0.0% Widowed0.0% DivorcedFemales 48.4% Never married44.4% Now married6.2% Separated0.0% Widowed1.0% DivorcedWomen who did not give birth in the past 12 months Now married:
28.5% (44)Unmarried:
71.5% (111)
Marital status - Other race population 15 years and over
Males 47.4% Never married52.6% Now married0.0% Separated0.0% Widowed0.0% DivorcedFemales 33.8% Never married66.2% Now married0.0% Separated0.0% Widowed0.0% DivorcedWomen who did not give birth in the past 12 months Now married:
0.0% (0)Unmarried:
100.0% (54)
Marital status - Two or more races population 15 years and over
Males 24.0% Never married63.1% Now married0.0% Separated0.0% Widowed12.8% DivorcedFemales 8.5% Never married91.5% Now married0.0% Separated0.0% Widowed0.0% DivorcedWomen who did not give birth in the past 12 months Now married:
91.5% (134)Unmarried:
8.5% (12)
Marital status - White alone, not Hispanic / Latino population 15 years and over
Males 26.4% Never married60.2% Now married0.0% Separated1.6% Widowed11.8% DivorcedFemales 18.3% Never married50.1% Now married0.0% Separated19.5% Widowed12.2% DivorcedWomen who gave birth in the past 12 months Now married:
20.5% (16)Unmarried:
79.5% (61)
Women who did not give birth in the past 12 months Now married:
40.5% (326)Unmarried:
59.5% (480)
Marital status - Hispanic or Latino population 15 years and over
Males 24.1% Never married75.9% Now married0.0% Separated0.0% Widowed0.0% DivorcedFemales 17.6% Never married82.4% Now married0.0% Separated0.0% Widowed0.0% DivorcedWomen who did not give birth in the past 12 months Now married:
76.3% (196)Unmarried:
23.7% (61)
Ancestries in Tanglewilde
659 21.2% German248 8.0% English178 5.7% American126 4.0% Welsh88 2.8% European87 2.8% Swedish46 1.5% Czech43 1.4% Hungarian35 1.1% Irish34 1.1% Dutch34 1.1% French Canadian28 0.9% Eastern European18 0.6% Norwegian18 0.6% Polish15 0.5% Portuguese13 0.4% French11 0.4% Canadian6 0.2% British5 0.2% Scottish1 0.03% Romanian
Children Nativity (place of birth) in Tanglewilde
Children under 6 years - Living with two parents Both parents native 431 100.0% NativeOne native, one foreign-born parent 22 100.0% NativeChildren under 6 years - Living with one parent Native parent 294 100.0% Native
Children 6 to 17 years - Living with two parents Both parents native 364 100.0% NativeOne native, one foreign-born parent 173 100.0% NativeChildren 6 to 17 years - Living with one parent Native parent 178 100.0% Native