Races in Taylorsville, Utah (UT) Detailed Stats
Data:
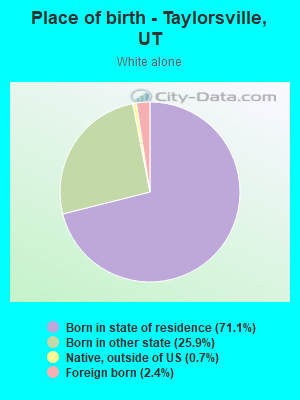
Races - White alone (%)
Races - White alone (% change since 2000)
Races - Black alone (%)
Races - Black alone (% change since 2000)
Races - American Indian alone (%)
Races - American Indian alone (% change since 2000)
Races - Asian alone (%)
Races - Asian alone (% change since 2000)
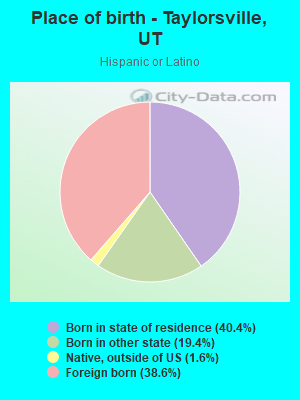
Races - Hispanic (%)
Races - Hispanic (% change since 2000)
Races - Native Hawaiian and Other Pacific Islander alone (%)
Races - Native Hawaiian and Other Pacific Islander alone (% change since 2000)
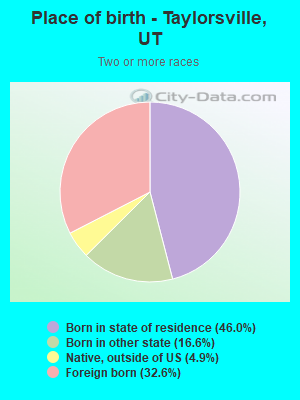
Races - Two or more races(%)
Races - Two or more races(% change since 2000)
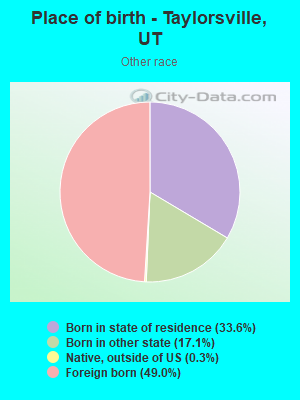
Races - Other race alone (%)
Races - Other race alone (% change since 2000)
Racial diversity
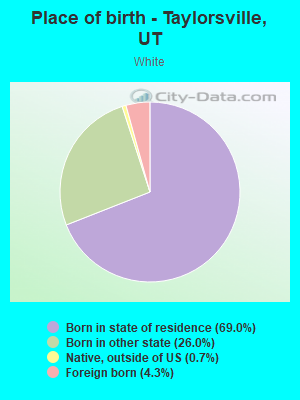
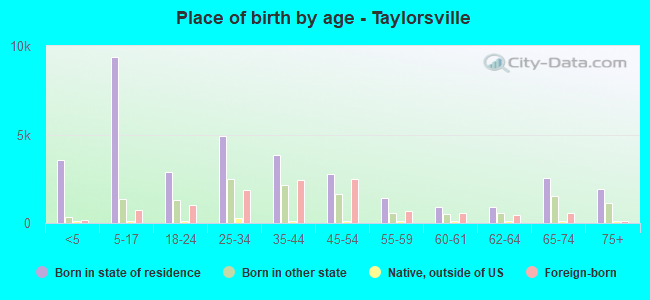
Place of birth - Born in state of residence (%)
Place of birth - Born in state of residence (%) - White
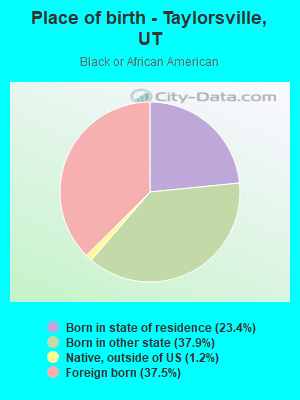
Place of birth - Born in state of residence (%) - Black or African American
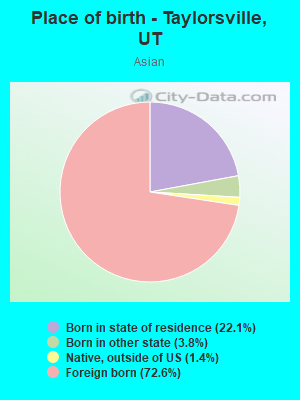
Place of birth - Born in state of residence (%) - Asian
Place of birth - Born in state of residence (%) - Hispanic or Latino
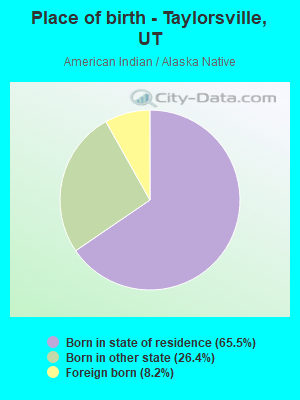
Place of birth - Born in state of residence (%) - American Indian and Alaska Native
Place of birth - Born in state of residence (%) - Multirace
Place of birth - Born in state of residence (%) - Other Race
Place of birth - Born in other state (%)
Place of birth - Born in other state (%) - White
Place of birth - Born in other state (%) - Black or African American
Place of birth - Born in other state (%) - Asian
Place of birth - Born in other state (%) - Hispanic or Latino
Place of birth - Born in other state (%) - American Indian and Alaska Native
Place of birth - Born in other state (%) - Multirace
Place of birth - Born in other state (%) - Other Race
Place of birth - Native, outside of US (%)
Place of birth - Native, outside of US (%) - White
Place of birth - Native, outside of US (%) - Black or African American
Place of birth - Native, outside of US (%) - Asian
Place of birth - Native, outside of US (%) - Hispanic or Latino
Place of birth - Native, outside of US (%) - American Indian and Alaska Native
Place of birth - Native, outside of US (%) - Multirace
Place of birth - Native, outside of US (%) - Other Race
Place of birth - Foreign born (%)
Place of birth - Foreign born (%) - White
Place of birth - Foreign born (%) - Black or African American
Place of birth - Foreign born (%) - Asian
Place of birth - Foreign born (%) - Hispanic or Latino
Place of birth - Foreign born (%) - American Indian and Alaska Native
Place of birth - Foreign born (%) - Multirace
Place of birth - Foreign born (%) - Other Race
Residents speaking English at home (%)
Residents speaking English at home - Born in the United States (%)
Residents speaking English at home - Native, born elsewhere (%)
Residents speaking English at home - Foreign born (%)
Residents speaking Spanish at home (%)
Residents speaking Spanish at home - Born in the United States (%)
Residents speaking Spanish at home - Native, born elsewhere (%)
Residents speaking Spanish at home - Foreign born (%)
Residents speaking other language at home (%)
Residents speaking other language at home - Born in the United States (%)
Residents speaking other language at home - Native, born elsewhere (%)
Residents speaking other language at home - Foreign born (%)
Marital status - Never married (%)
Marital status - Now married (%)
Marital status - Separated (%)
Marital status - Widowed (%)
Marital status - Divorced (%)
Ancestries Reported - Arab (%)
Ancestries Reported - Czech (%)
Ancestries Reported - Danish (%)
Ancestries Reported - Dutch (%)
Ancestries Reported - English (%)
Ancestries Reported - French (%)
Ancestries Reported - French Canadian (%)
Ancestries Reported - German (%)
Ancestries Reported - Greek (%)
Ancestries Reported - Hungarian (%)
Ancestries Reported - Irish (%)
Ancestries Reported - Italian (%)
Ancestries Reported - Lithuanian (%)
Ancestries Reported - Norwegian (%)
Ancestries Reported - Polish (%)
Ancestries Reported - Portuguese (%)
Ancestries Reported - Russian (%)
Ancestries Reported - Scotch-Irish (%)
Ancestries Reported - Scottish (%)
Ancestries Reported - Slovak (%)
Ancestries Reported - Subsaharan African (%)
Ancestries Reported - Swedish (%)
Ancestries Reported - Swiss (%)
Ancestries Reported - Ukrainian (%)
Ancestries Reported - United States (%)
Ancestries Reported - Welsh (%)
Ancestries Reported - West Indian (%)
Ancestries Reported - Other (%)
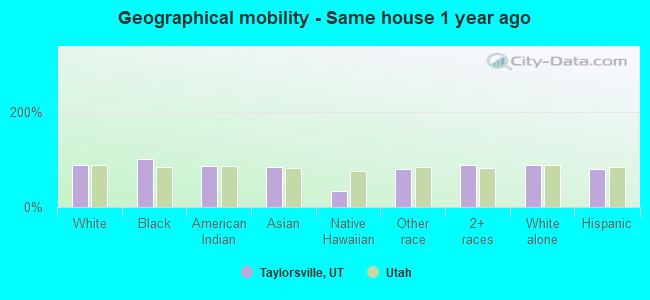
Geographical mobility - Same house 1 year ago (%)
Geographical mobility - Same house 1 year ago (%) - White
Geographical mobility - Same house 1 year ago (%) - Black or African American
Geographical mobility - Same house 1 year ago (%) - Asian
Geographical mobility - Same house 1 year ago (%) - Hispanic or Latino
Geographical mobility - Same house 1 year ago (%) - American Indian and Alaska Native
Geographical mobility - Same house 1 year ago (%) - Multirace
Geographical mobility - Same house 1 year ago (%) - Other Race
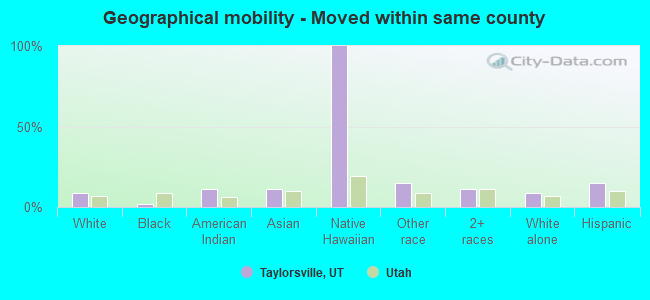
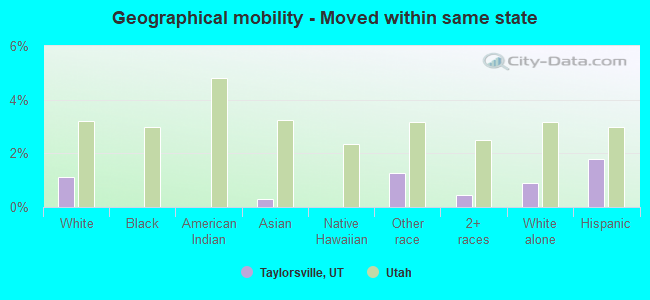
Geographical mobility - Moved within same county (%)
Geographical mobility - Moved within same county (%) - White
Geographical mobility - Moved within same county (%) - Black or African American
Geographical mobility - Moved within same county (%) - Asian
Geographical mobility - Moved within same county (%) - Hispanic or Latino
Geographical mobility - Moved within same county (%) - American Indian and Alaska Native
Geographical mobility - Moved within same county (%) - Multirace
Geographical mobility - Moved within same county (%) - Other Race
Geographical mobility - Moved from different county within same state (%)
Geographical mobility - Moved from different county within same state (%) - White
Geographical mobility - Moved from different county within same state (%) - Black or African American
Geographical mobility - Moved from different county within same state (%) - Asian
Geographical mobility - Moved from different county within same state (%) - Hispanic or Latino
Geographical mobility - Moved from different county within same state (%) - American Indian and Alaska Native
Geographical mobility - Moved from different county within same state (%) - Multirace
Geographical mobility - Moved from different county within same state (%) - Other Race
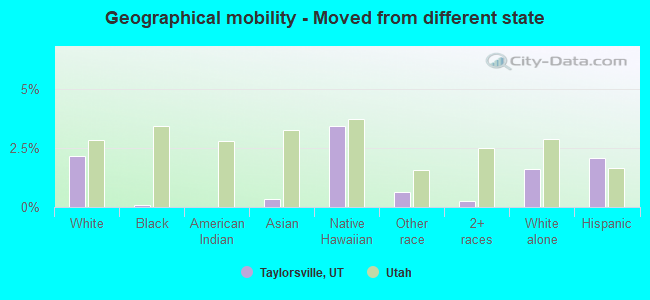
Geographical mobility - Moved from different state (%)
Geographical mobility - Moved from different state (%) - White
Geographical mobility - Moved from different state (%) - Black or African American
Geographical mobility - Moved from different state (%) - Asian
Geographical mobility - Moved from different state (%) - Hispanic or Latino
Geographical mobility - Moved from different state (%) - American Indian and Alaska Native
Geographical mobility - Moved from different state (%) - Multirace
Geographical mobility - Moved from different state (%) - Other Race
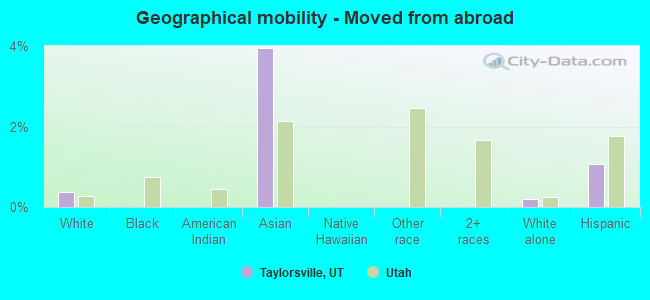
Geographical mobility - Moved from abroad (%)
Geographical mobility - Moved from abroad (%) - White
Geographical mobility - Moved from abroad (%) - Black or African American
Geographical mobility - Moved from abroad (%) - Asian
Geographical mobility - Moved from abroad (%) - Hispanic or Latino
Geographical mobility - Moved from abroad (%) - American Indian and Alaska Native
Geographical mobility - Moved from abroad (%) - Multirace
Geographical mobility - Moved from abroad (%) - Other Race
Place of birth for the foreign-born population - Ireland (%)
Place of birth for the foreign-born population - Denmark (%)
Place of birth for the foreign-born population - Norway (%)
Place of birth for the foreign-born population - Sweden (%)
Place of birth for the foreign-born population - United Kingdom (%)
Place of birth for the foreign-born population - England (%)
Place of birth for the foreign-born population - Scotland (%)
Place of birth for the foreign-born population - Other Northern Europe (%)
Place of birth for the foreign-born population - Austria (%)
Place of birth for the foreign-born population - Belgium (%)
Place of birth for the foreign-born population - France (%)
Place of birth for the foreign-born population - Germany (%)
Place of birth for the foreign-born population - Netherlands (%)
Place of birth for the foreign-born population - Switzerland (%)
Place of birth for the foreign-born population - Other Western Europe (%)
Place of birth for the foreign-born population - Greece (%)
Place of birth for the foreign-born population - Italy (%)
Place of birth for the foreign-born population - Portugal (%)
Place of birth for the foreign-born population - Spain (%)
Place of birth for the foreign-born population - Other Southern Europe (%)
Place of birth for the foreign-born population - Albania (%)
Place of birth for the foreign-born population - Belarus (%)
Place of birth for the foreign-born population - Bosnia and Herzegovina (%)
Place of birth for the foreign-born population - Bulgaria (%)
Place of birth for the foreign-born population - Croatia (%)
Place of birth for the foreign-born population - Czechoslovakia (%)
Place of birth for the foreign-born population - Hungary (%)
Place of birth for the foreign-born population - Latvia (%)
Place of birth for the foreign-born population - Lithuania (%)
Place of birth for the foreign-born population - North Macedonia (Macedonia) (%)
Place of birth for the foreign-born population - Moldova (%)
Place of birth for the foreign-born population - Poland (%)
Place of birth for the foreign-born population - Romania (%)
Place of birth for the foreign-born population - Russia (%)
Place of birth for the foreign-born population - Serbia (%)
Place of birth for the foreign-born population - Ukraine (%)
Place of birth for the foreign-born population - Other Eastern Europe (%)
Place of birth for the foreign-born population - China (%)
Place of birth for the foreign-born population - Hong Kong (%)
Place of birth for the foreign-born population - Taiwan (%)
Place of birth for the foreign-born population - Japan (%)
Place of birth for the foreign-born population - Korea (%)
Place of birth for the foreign-born population - Other Eastern Asia (%)
Place of birth for the foreign-born population - Afghanistan (%)
Place of birth for the foreign-born population - Bangladesh (%)
Place of birth for the foreign-born population - India (%)
Place of birth for the foreign-born population - Iran (%)
Place of birth for the foreign-born population - Kazakhstan (%)
Place of birth for the foreign-born population - Nepal (%)
Place of birth for the foreign-born population - Pakistan (%)
Place of birth for the foreign-born population - Sri Lanka (%)
Place of birth for the foreign-born population - Uzbekistan (%)
Place of birth for the foreign-born population - Other South Central Asia (%)
Place of birth for the foreign-born population - Burma (%)
Place of birth for the foreign-born population - Cambodia (%)
Place of birth for the foreign-born population - Indonesia (%)
Place of birth for the foreign-born population - Laos (%)
Place of birth for the foreign-born population - Malaysia (%)
Place of birth for the foreign-born population - Philippines (%)
Place of birth for the foreign-born population - Singapore (%)
Place of birth for the foreign-born population - Thailand (%)
Place of birth for the foreign-born population - Vietnam (%)
Place of birth for the foreign-born population - Other South Eastern Asia (%)
Place of birth for the foreign-born population - Armenia (%)
Place of birth for the foreign-born population - Iraq (%)
Place of birth for the foreign-born population - Israel (%)
Place of birth for the foreign-born population - Jordan (%)
Place of birth for the foreign-born population - Kuwait (%)
Place of birth for the foreign-born population - Lebanon (%)
Place of birth for the foreign-born population - Saudi Arabia (%)
Place of birth for the foreign-born population - Syria (%)
Place of birth for the foreign-born population - Turkey (%)
Place of birth for the foreign-born population - Yemen (%)
Place of birth for the foreign-born population - Other Western Asia (%)
Place of birth for the foreign-born population - Eritrea (%)
Place of birth for the foreign-born population - Ethiopia (%)
Place of birth for the foreign-born population - Kenya (%)
Place of birth for the foreign-born population - Somalia (%)
Place of birth for the foreign-born population - Uganda (%)
Place of birth for the foreign-born population - Zimbabwe (%)
Place of birth for the foreign-born population - Other Eastern Africa (%)
Place of birth for the foreign-born population - Cameroon (%)
Place of birth for the foreign-born population - Congo (%)
Place of birth for the foreign-born population - Democratic Republic of Congo (Zaire) (%)
Place of birth for the foreign-born population - Other Middle Africa (%)
Place of birth for the foreign-born population - Egypt (%)
Place of birth for the foreign-born population - Morocco (%)
Place of birth for the foreign-born population - Sudan (%)
Place of birth for the foreign-born population - Other Northern Africa (%)
Place of birth for the foreign-born population - South Africa (%)
Place of birth for the foreign-born population - Other Southern Africa (%)
Place of birth for the foreign-born population - Cabo Verde (%)
Place of birth for the foreign-born population - Ghana (%)
Place of birth for the foreign-born population - Liberia (%)
Place of birth for the foreign-born population - Nigeria (%)
Place of birth for the foreign-born population - Senegal (%)
Place of birth for the foreign-born population - Sierra Leone (%)
Place of birth for the foreign-born population - Other Western Africa (%)
Place of birth for the foreign-born population - Australia (%)
Place of birth for the foreign-born population - New Zealand (%)
Place of birth for the foreign-born population - Fiji (%)
Place of birth for the foreign-born population - Micronesia (%)
Place of birth for the foreign-born population - Bahamas (%)
Place of birth for the foreign-born population - Barbados (%)
Place of birth for the foreign-born population - Cuba (%)
Place of birth for the foreign-born population - Dominica (%)
Place of birth for the foreign-born population - Dominican Republic (%)
Place of birth for the foreign-born population - Grenada (%)
Place of birth for the foreign-born population - Haiti (%)
Place of birth for the foreign-born population - Jamaica (%)
Place of birth for the foreign-born population - St. Vincent and the Grenadines (%)
Place of birth for the foreign-born population - Trinidad and Tobago (%)
Place of birth for the foreign-born population - West Indies (%)
Place of birth for the foreign-born population - Other Caribbean (%)
Place of birth for the foreign-born population - Belize (%)
Place of birth for the foreign-born population - Costa Rica (%)
Place of birth for the foreign-born population - El Salvador (%)
Place of birth for the foreign-born population - Guatemala (%)
Place of birth for the foreign-born population - Honduras (%)
Place of birth for the foreign-born population - Mexico (%)
Place of birth for the foreign-born population - Nicaragua (%)
Place of birth for the foreign-born population - Panama (%)
Place of birth for the foreign-born population - Other Central America (%)
Place of birth for the foreign-born population - Argentina (%)
Place of birth for the foreign-born population - Bolivia (%)
Place of birth for the foreign-born population - Brazil (%)
Place of birth for the foreign-born population - Chile (%)
Place of birth for the foreign-born population - Colombia (%)
Place of birth for the foreign-born population - Ecuador (%)
Place of birth for the foreign-born population - Guyana (%)
Place of birth for the foreign-born population - Peru (%)
Place of birth for the foreign-born population - Uruguay (%)
Place of birth for the foreign-born population - Venezuela (%)
Place of birth for the foreign-born population - Other South America (%)
Place of birth for the foreign-born population - Canada (%)
Place of birth for the foreign-born population - Other Northern America (%)
Place of birth for the foreign-born population - Other (%)
Latest news about races in Taylorsville, UT collected exclusively by city-data.com from local newspapers, TV, and radio stations
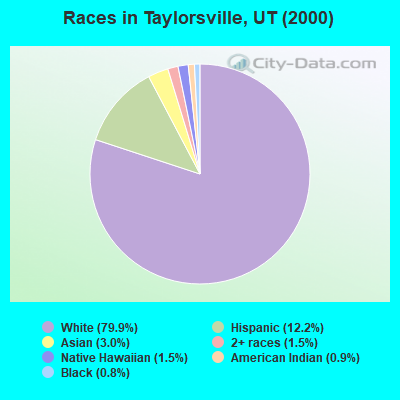
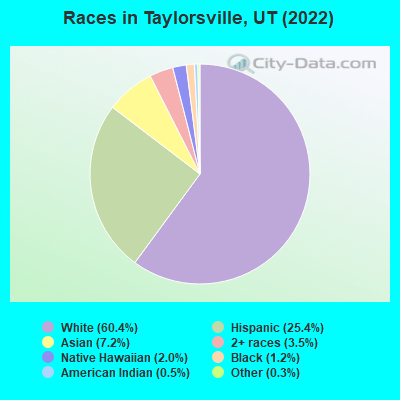
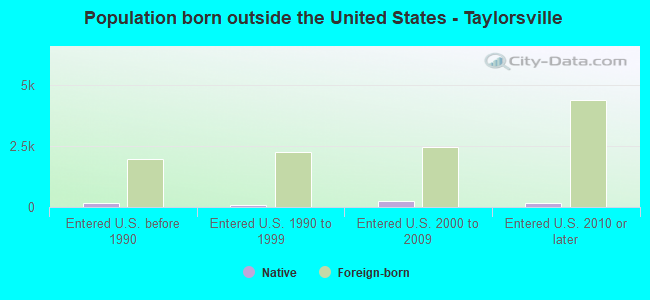
According to 2022 data, the most numerous races in Taylorsville, UT are White alone (36,222 residents), Hispanic (15,221 residents), and Two or more races (2,092 residents). 71.8% of Taylorsville residents speak English at home. 18.5% of Taylorsville, UT residents are foreign-born (9.6% born in Latin America, 5.9% born in Asia), which is 56.6% greater than the foreign-born rate of 8.0% across the entire state of Utah.
Race distribution in Taylorsville
2000 2022
1,904,265 85.3% White alone 201,559 9.0% Hispanic 36,483 1.6% Asian alone 31,308 1.4% Two or more races 26,663 1.2% American Indian alone 14,806 0.7% Native Hawaiian and Other 16,137 0.7% Black alone 1,948 0.09% Other race alone
2,557,466 75.6% White alone 512,086 15.1% Hispanic 119,308 3.5% Two or more races 82,388 2.4% Asian alone 36,978 1.1% Native Hawaiian and Other 34,873 1.0% Black alone 22,803 0.7% American Indian alone 14,898 0.4% Other race alone
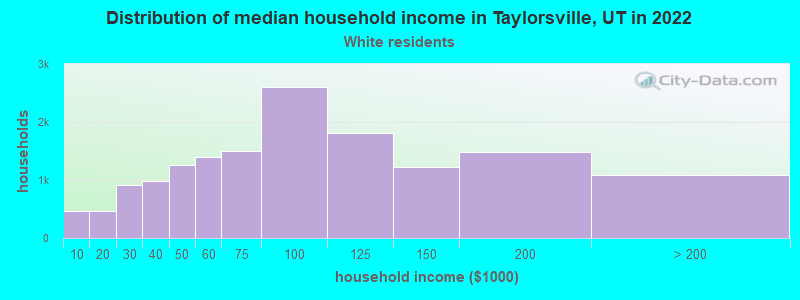
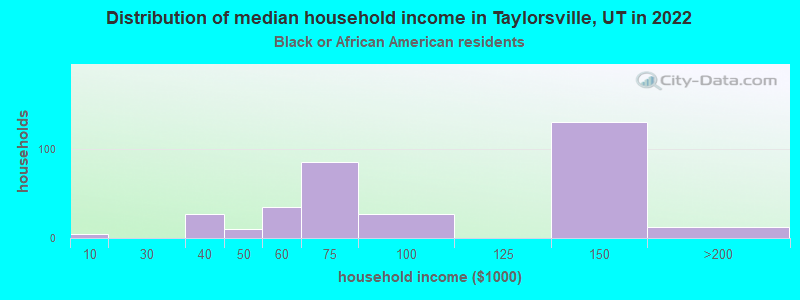
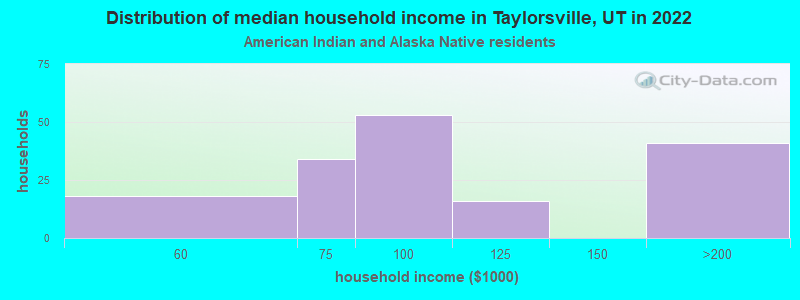
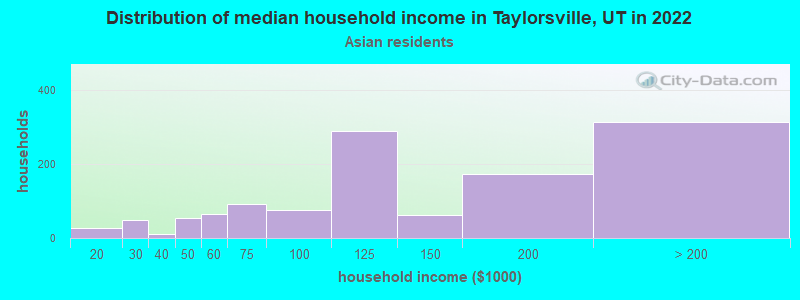
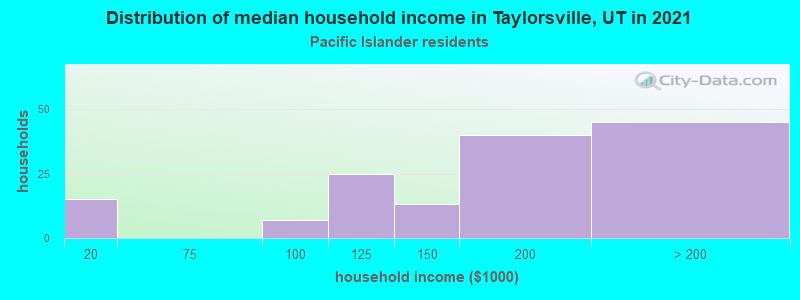
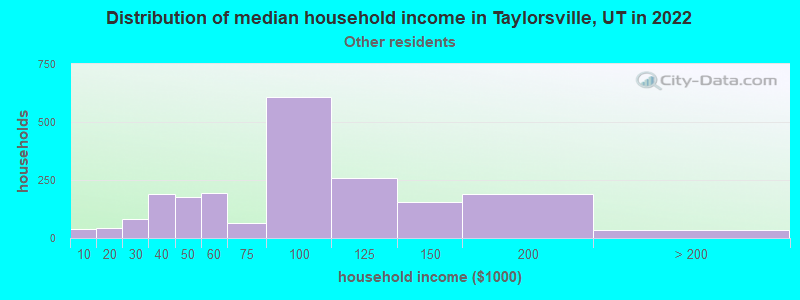
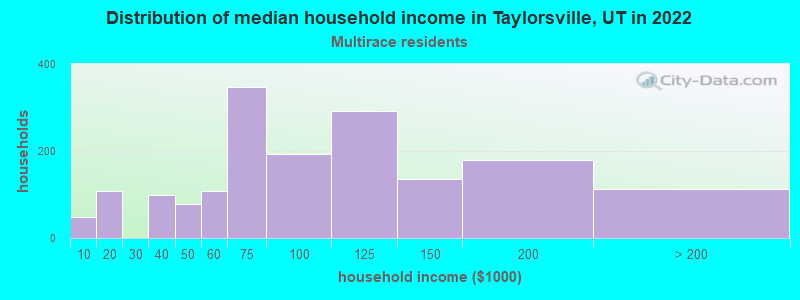
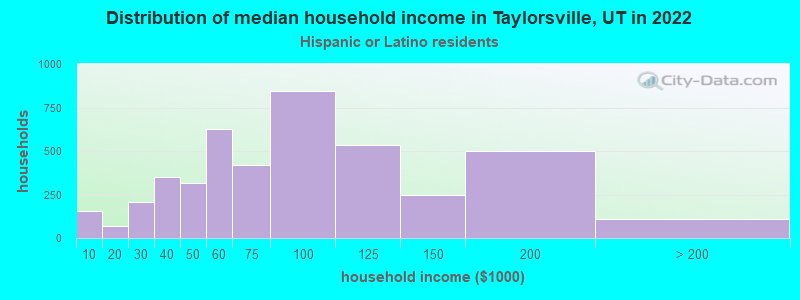
Income and house value in Taylorsville Median household income in 2022 $82,118 White non-Hispanic householders$103,701 Black householders$84,509 American Indian and Alaska Native householders$120,175 Asian householders$116,329 Native Hawaiian and other Pacific Islander householders$82,988 Some other race householders$82,991 Two or more races householders$73,547 Hispanic or Latino race householdersMedian 2022 house value $448,332 White Non-Hispanic householders$451,903 Black or African American householders$503,521 American Indian or Alaska Native householders $479,822 Asian householders$444,761 Native Hawaiian and other Pacific Islander householders$436,320 Some other race householders$443,787 Two or more races householders$439,567 Hispanic or Latino householders
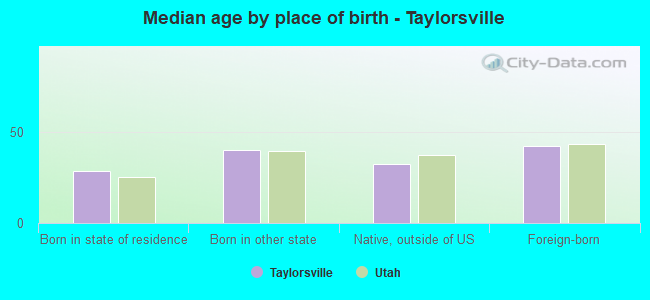
Median age by race in Taylorsville
37.1 Median age for White residents36.9 37.2 27.8 Median age for Black or African American residents28.9 27.7 28.5 Median age for American Indian / Alaska Native residents26.2 28.1 37.3 Median age for Asian residents36.8 37.2 17.5 Median age for Native Hawaiian / Pacific Islander residents20.5 13.0 30.4 Median age for Other race residents27.4 30.9 26.8 Median age for Two or more races residents27.8 26.1 38.2 Median age for White alone residents37.9 38.7 26.7 Median age for Hispanic or Latino residents26.5 27.0
Owner/renter occupied households by race in Taylorsville
House owners and renters - White residents 11,344 74.0% Owner occupied3,985 26.0% Renter occupiedHouse owners and renters - Black or African American residents 156 62.9% Owner occupied92 37.1% Renter occupiedHouse owners and renters - American Indian / Alaska Native residents 79 43.8% Owner occupied101 56.2% Renter occupiedHouse owners and renters - Asian residents 817 66.7% Owner occupied407 33.3% Renter occupiedHouse owners and renters - Native Hawaiian / Pacific Islander residents 136 56.6% Owner occupied104 43.4% Renter occupiedHouse owners and renters - Other race residents 1,199 57.7% Owner occupied879 42.3% Renter occupiedHouse owners and renters - Two or more races residents 1,021 61.8% Owner occupied631 38.2% Renter occupiedHouse owners and renters - White alone residents 10,669 75.3% Owner occupied3,495 24.7% Renter occupiedHouse owners and renters - Hispanic or Latino residents 2,561 58.8% Owner occupied1,795 41.2% Renter occupied
Language usage in Taylorsville
English speakers - Total 71.8% of residents of Taylorsville speak English at home.
17.5% of residents speak Spanish at home 5,391 55.0% Speak English very well4,415 45.0% Speak English less than very well11.2% of residents speak other language at home 3,528 56.2% Speak English very well2,747 43.8% Speak English less than very well
English speakers - Born in the United States 84.8% of residents of Taylorsville speak English at home.
13.2% of residents speak Spanish at home 1,507 86.9% Speak English very well228 13.1% Speak English less than very well2.4% of residents speak other language at home 252 78.3% Speak English very well70 21.7% Speak English less than very well
English speakers - Native, born elsewhere 32.0% of residents of Taylorsville speak English at home.
49.1% of residents speak Spanish at home 210 63.4% Speak English very well121 36.6% Speak English less than very well21.8% of residents speak other language at home 127 86.4% Speak English very well20 13.6% Speak English less than very well
English speakers - Foreign-born 7.5% of residents of Taylorsville speak English at home.
51.6% of residents speak Spanish at home 1,803 32.3% Speak English very well3,771 67.7% Speak English less than very well41.3% of residents speak other language at home 2,067 46.4% Speak English very well2,391 53.6% Speak English less than very well
White (Caucasian) - Speak only English Native:
96.3% (34,307)Foreign-born:
17.2% (294)
White (Caucasian) - Speak another language Native:
3.8% (1,356)Foreign-born:
78.9% (1,346)
Black or African American - Speak only English Native:
74.8% (365)Foreign-born:
22.1% (64)
Black or African American - Speak another language Native:
19.5% (95)Foreign-born:
77.1% (222)
American Indian / Alaska Native - Speak another language Native:
61.1% (298)Foreign-born:
94.0% (36)
Asian - Speak only English Native:
33.6% (356)Foreign-born:
3.7% (119)
Asian - Speak another language Native:
71.1% (754)Foreign-born:
94.8% (3,056)
Native Hawaiian / Pacific Islander - Speak only English Native:
62.7% (496)Foreign-born:
32.3% (89)
Native Hawaiian / Pacific Islander - Speak another language Native:
35.6% (281)Foreign-born:
58.6% (161)
Other race - Speak only English Native:
21.7% (647)Foreign-born:
3.2% (108)
Other race - Speak another language Native:
79.6% (2,375)Foreign-born:
94.3% (3,148)
Two or more races - Speak only English Native:
74.2% (2,863)Foreign-born:
4.2% (87)
Two or more races - Speak another language Native:
25.9% (1,001)Foreign-born:
99.3% (2,055)
White alone - Speak only English Native:
97.3% (32,418)Foreign-born:
31.5% (276)
White alone - Speak another language Native:
2.7% (904)Foreign-born:
69.4% (607)
Hispanic or Latino - Speak only English Native:
52.0% (4,084)Foreign-born:
2.6% (148)
Hispanic or Latino - Speak another language Native:
48.0% (3,771)Foreign-born:
96.2% (5,557)
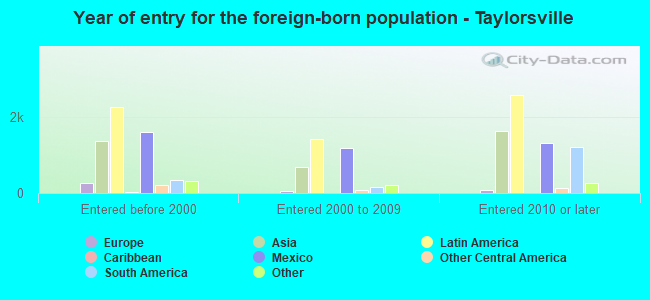
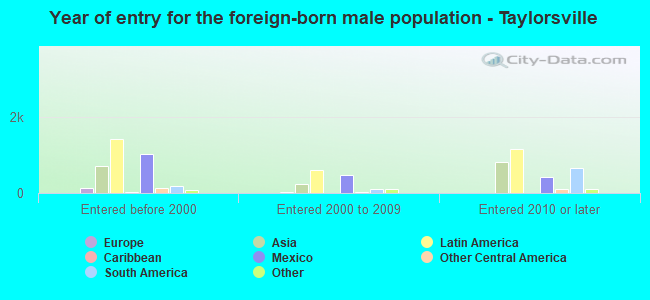
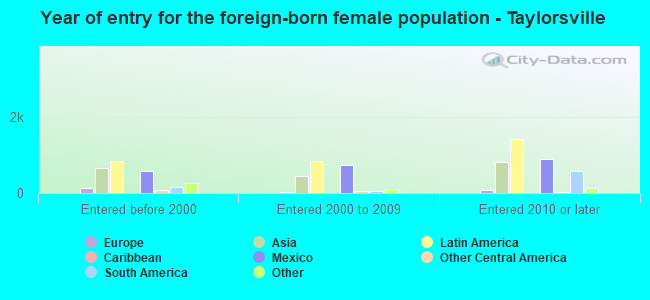
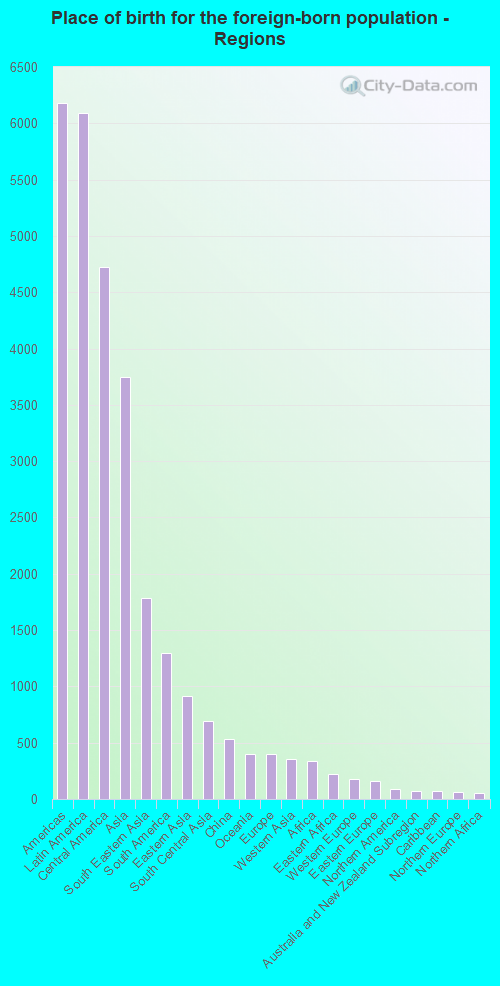
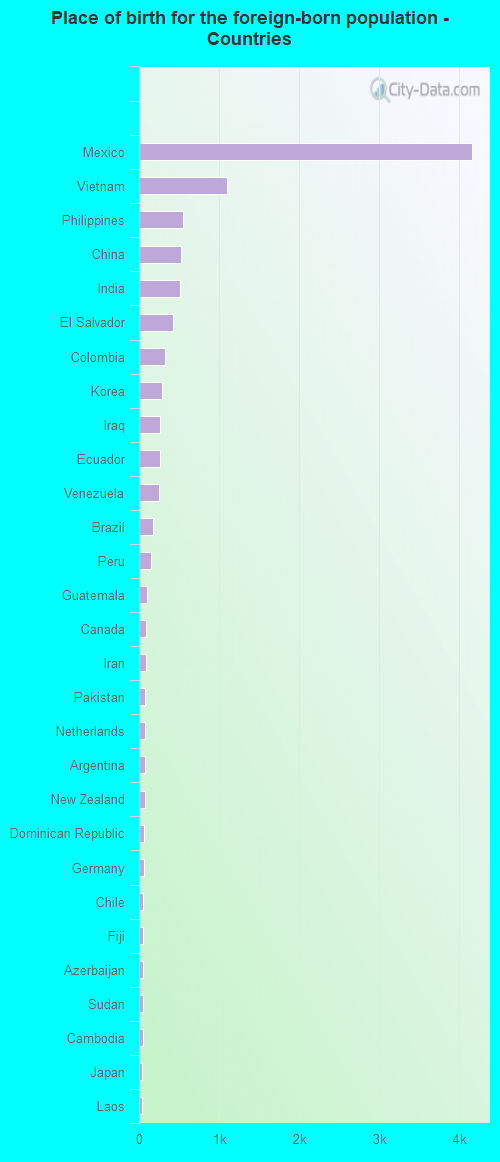
Foreign-born residents in Taylorsville 11,074 residents are foreign born (9.6% Latin America , 5.9% Asia ).
Marital status for residents in Taylorsville Marital status - White (Caucasian) population 15 years and over
Males 32.7% Never married52.9% Now married1.8% Separated1.9% Widowed10.8% DivorcedFemales 25.7% Never married49.2% Now married1.8% Separated8.3% Widowed15.1% DivorcedWomen who gave birth in the past 12 months Now married:
74.1% (416)Unmarried:
25.9% (146)
Women who did not give birth in the past 12 months Now married:
47.6% (4,337)Unmarried:
52.4% (4,777)
Marital status - Black or African American population 15 years and over
Males 22.3% Never married77.4% Now married0.0% Separated0.0% Widowed0.3% DivorcedFemales 47.7% Never married44.9% Now married0.0% Separated0.0% Widowed7.4% DivorcedWomen who did not give birth in the past 12 months Now married:
22.0% (36)Unmarried:
78.0% (128)
Marital status - American Indian / Alaska Native population 15 years and over
Males 80.4% Never married19.6% Now married0.0% Separated0.0% Widowed0.0% DivorcedFemales 81.8% Never married7.0% Now married0.0% Separated0.0% Widowed11.2% DivorcedWomen who did not give birth in the past 12 months Now married:
7.9% (13)Unmarried:
92.1% (157)
Marital status - Asian population 15 years and over
Males 32.6% Never married60.5% Now married1.6% Separated0.1% Widowed5.1% DivorcedFemales 25.2% Never married66.1% Now married5.1% Separated2.3% Widowed1.3% DivorcedWomen who gave birth in the past 12 months Now married:
100.0% (7)Unmarried:
0.0% (0)
Women who did not give birth in the past 12 months Now married:
61.5% (799)Unmarried:
38.5% (500)
Marital status - Native Hawaiian / Pacific Islander population 15 years and over
Males 53.9% Never married46.1% Now married0.0% Separated0.0% Widowed0.0% DivorcedFemales 27.4% Never married38.0% Now married0.7% Separated9.9% Widowed24.0% DivorcedWomen who gave birth in the past 12 months Now married:
0.0% (0)Unmarried:
100.0% (23)
Women who did not give birth in the past 12 months Now married:
35.3% (82)Unmarried:
64.7% (150)
Marital status - Other race population 15 years and over
Males 40.2% Never married47.3% Now married6.3% Separated0.3% Widowed5.9% DivorcedFemales 39.8% Never married45.4% Now married5.3% Separated3.1% Widowed6.4% DivorcedWomen who gave birth in the past 12 months Now married:
100.0% (18)Unmarried:
0.0% (0)
Women who did not give birth in the past 12 months Now married:
47.9% (961)Unmarried:
52.1% (1,047)
Marital status - Two or more races population 15 years and over
Males 47.7% Never married39.3% Now married0.1% Separated0.0% Widowed12.9% DivorcedFemales 48.9% Never married35.7% Now married1.8% Separated4.8% Widowed8.8% DivorcedWomen who gave birth in the past 12 months Now married:
50.0% (81)Unmarried:
50.0% (81)
Women who did not give birth in the past 12 months Now married:
29.9% (490)Unmarried:
70.1% (1,151)
Marital status - White alone, not Hispanic / Latino population 15 years and over
Males 31.5% Never married53.9% Now married1.9% Separated2.1% Widowed10.7% DivorcedFemales 23.4% Never married50.1% Now married1.6% Separated9.1% Widowed15.7% DivorcedWomen who gave birth in the past 12 months Now married:
93.5% (357)Unmarried:
6.5% (25)
Women who did not give birth in the past 12 months Now married:
48.6% (3,867)Unmarried:
51.4% (4,091)
Marital status - Hispanic or Latino population 15 years and over
Males 43.0% Never married45.7% Now married3.4% Separated0.2% Widowed7.7% DivorcedFemales 44.4% Never married40.6% Now married3.9% Separated2.5% Widowed8.6% DivorcedWomen who gave birth in the past 12 months Now married:
44.1% (144)Unmarried:
55.9% (182)
Women who did not give birth in the past 12 months Now married:
40.8% (1,750)Unmarried:
59.2% (2,540)
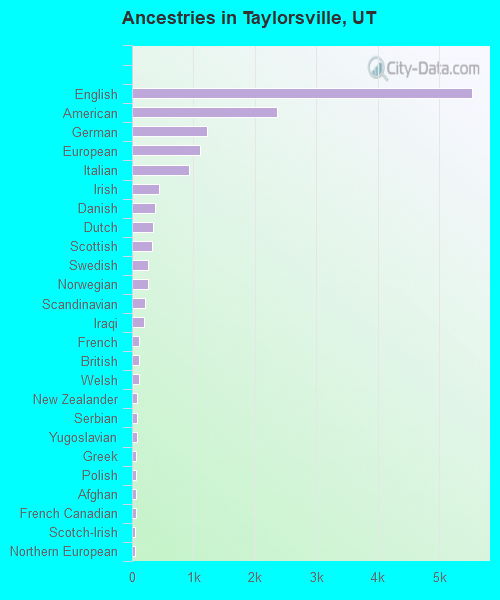
Ancestries in Taylorsville
5,537 17.6% English2,359 7.5% American1,215 3.9% German1,114 3.5% European924 2.9% Italian440 1.4% Irish380 1.2% Danish342 1.1% Dutch324 1.0% Scottish258 0.8% Swedish257 0.8% Norwegian217 0.7% Scandinavian201 0.6% Iraqi120 0.4% French117 0.4% British114 0.4% Welsh79 0.3% New Zealander79 0.3% Serbian77 0.2% Yugoslavian71 0.2% Greek70 0.2% Polish63 0.2% Afghan58 0.2% French Canadian53 0.2% Scotch-Irish51 0.2% Northern European49 0.2% Brazilian42 0.1% Jamaican38 0.1% African37 0.1% Syrian35 0.1% Russian29 0.09% Portuguese28 0.09% Canadian20 0.06% Iranian19 0.06% Czech16 0.05% Hungarian11 0.03% Eastern European11 0.03% Swiss8 0.03% Armenian7 0.02% Arab7 0.02% Lithuanian4 0.01% Croatian2 0.01% Kenyan
Geographical mobility in Taylorsville Same house 1 year ago 34,156 87.2% White (Caucasian)936 100.0% Black or African American399 85.0% American Indian / Alaska Native3,685 83.9% Asian358 32.7% Native Hawaiian / Pacific Islander5,431 79.8% Other race5,768 87.0% Two or more races31,523 88.2% White alone, not Hispanic / Latino11,911 79.7% Hispanic or LatinoMoved within same county 3,532 9.0% White / Caucasian19 2.2% Black or African American53 11.4% American Indian / Alaska Native482 11.0% Asian1,158 100.0% Native Hawaiian / Pacific Islander1,051 15.5% Other race746 11.3% Two or more races3,228 9.0% White alone, not Hispanic / Latino2,200 14.7% Hispanic or LatinoMoved within same state 440 1.1% White / Caucasian14 0.3% Asian86 1.3% Other race31 0.5% Two or more races317 0.9% White alone, not Hispanic / Latino267 1.8% Hispanic or LatinoMoved from different state 844 2.2% White / Caucasian1 0.1% Black or African American14 0.3% Asian37 3.4% Native Hawaiian / Pacific Islander44 0.7% Other race18 0.3% Two or more races581 1.6% White alone, not Hispanic / Latino312 2.1% Hispanic or LatinoMoved from abroad 150 0.4% White174 4.0% Asian69 0.2% White alone, not Hispanic / Latino158 1.1% Hispanic or Latino
Children Nativity (place of birth) in Taylorsville
Children under 6 years - Living with two parents Both parents native 1,748 100.0% NativeBoth parents foreign-born 343 63.8% Native194 36.2% Foreign-bornOne native, one foreign-born parent 312 100.0% NativeChildren under 6 years - Living with one parent Native parent 1,913 100.0% NativeForeign-born parent 470 100.0% NativeChildren 6 to 17 years - Living with two parents Both parents native 4,443 100.0% NativeBoth parents foreign-born 1,597 75.0% Native534 25.0% Foreign-bornOne native, one foreign-born parent 534 89.9% Native60 10.1% Foreign-bornChildren 6 to 17 years - Living with one parent Native parent 2,480 100.0% NativeForeign-born parent 746 52.4% Native679 47.6% Foreign-born
Grandparents responsible for own grandchildren in Taylorsville
Grandparents (30 to 59 years) White / Caucasian 107 30.4% Responsible for grandchildren246 69.6% Not responsible for grandchildrenAmerican Indian / Alaska Native 6 100.0% Not responsible for grandchildrenOther race 171 100.0% Not responsible for grandchildrenTwo or more races 33 57.4% Responsible for grandchildren24 42.6% Not responsible for grandchildrenWhite alone, not Hispanic / Latino 130 34.3% Responsible for grandchildren249 65.7% Not responsible for grandchildrenHispanic or Latino 14 7.6% Responsible for grandchildren170 92.4% Not responsible for grandchildrenGrandparents (60 years and over) White / Caucasian 128 26.4% Responsible for grandchildren358 73.6% Not responsible for grandchildrenOther race 66 100.0% Not responsible for grandchildrenTwo or more races 3 3.8% Responsible for grandchildren75 96.2% Not responsible for grandchildrenWhite alone, not Hispanic / Latino 129 27.3% Responsible for grandchildren342 72.7% Not responsible for grandchildrenHispanic or Latino 133 100.0% Not responsible for grandchildren