Races in Teaneck, New Jersey (NJ) Detailed Stats
Ancestries, Foreign-born residents, place of birth

Recent posts about races in Teaneck, New Jersey on our local forum with over 2,400,000 registered users:
 | Working In Teaneck, Where to Buy a House? (10 replies) |
| Buying a house. Should we consider Lodi for a family of 4? (6 replies) |
| What’s the best neighborhood in NJ to buy with a 1.5-2million budget? (55 replies) |
| Is this an accurate map of New Jersey? (44 replies) |
| House under 350K in Teaneck (12 replies) |
| Work in midtown and JC. Teaneck? (11 replies) |
Latest news about races in Teaneck, NJ collected exclusively by city-data.com from local newspapers, TV, and radio stations
24.0% of Teaneck, NJ residents are foreign-born (10.4% born in Latin America, 7.2% born in Asia, 4.7% born in Europe), which is 4.3% greater than the foreign-born rate of 23.0% across the entire state of New Jersey.
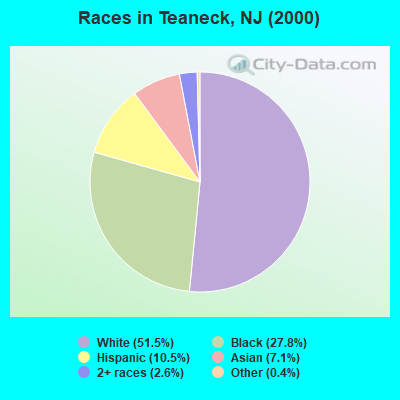
Race distribution in Teaneck

- 20,23751.5%White alone
- 10,90527.8%Black alone
- 4,10310.5%Hispanic
- 2,7917.1%Asian alone
- 1,0242.6%Two or more races
- 1540.4%Other race alone
- 390.10%American Indian alone
- 70.02%Native Hawaiian and Other
Pacific Islander alone
2000
2022
-
- 5,557,20966.0%White alone
- 1,117,19113.3%Hispanic
- 1,096,17113.0%Black alone
- 477,0125.7%Asian alone
- 133,6891.6%Two or more races
- 19,5650.2%Other race alone
- 11,3380.1%American Indian alone
- 2,1750.03%Native Hawaiian and Other
Pacific Islander alone

-
- 4,766,47651.5%White alone
- 2,028,47021.9%Hispanic
- 1,111,63212.0%Black alone
- 923,54610.0%Asian alone
- 332,2373.6%Two or more races
- 89,8471.0%Other race alone
- 8,5570.09%American Indian alone
- 9340.01%Native Hawaiian and Other
Pacific Islander alone

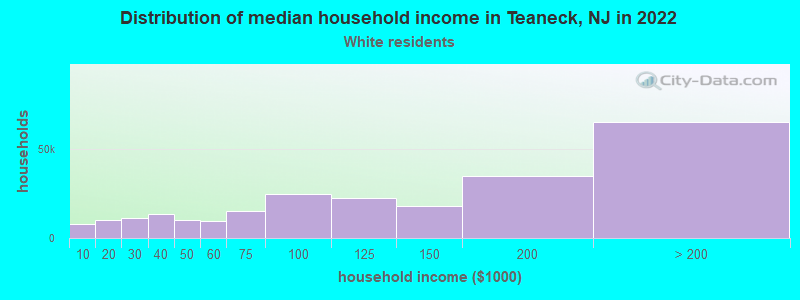
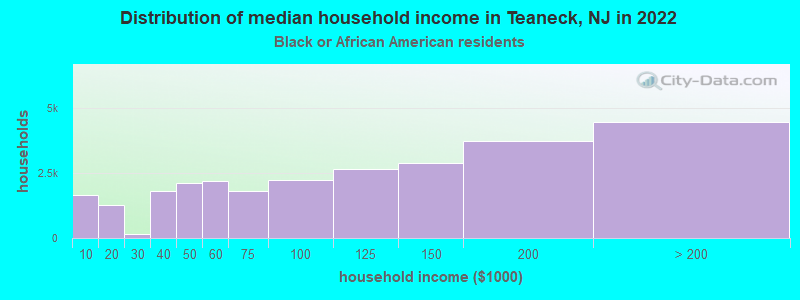
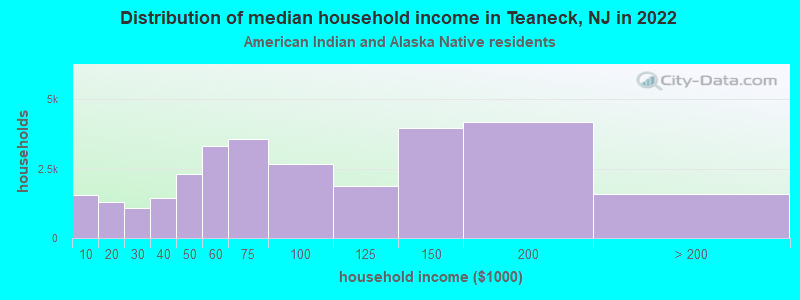
Income and house value in Teaneck
- Median household income in 2022
- $139,205White non-Hispanic householders
- $140,074Black householders
- $120,543American Indian and Alaska Native householders
- $148,297Asian householders
- $116,025Some other race householders
- $142,792Two or more races householders
- $113,689Hispanic or Latino race householders
- Median 2022 house value
- $552,889White Non-Hispanic householders
- $446,684Black or African American householders
- $540,635American Indian or Alaska Native householders
- $500,508Asian householders
- $455,335Some other race householders
- $458,458Two or more races householders
- $455,094Hispanic or Latino householders
Household income for White non-Hispanic householders
Household income for Black householders
Household income for American Indian and Alaska Native householders
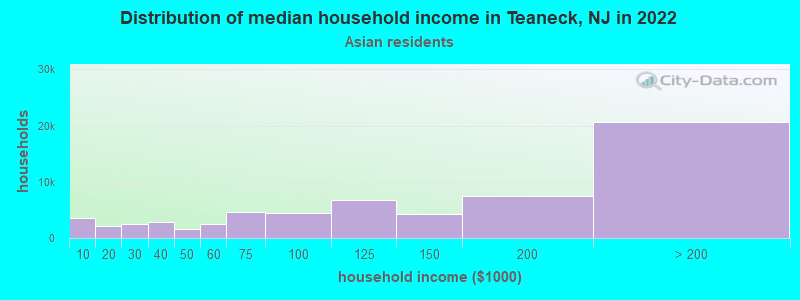
Household income for Asian householders
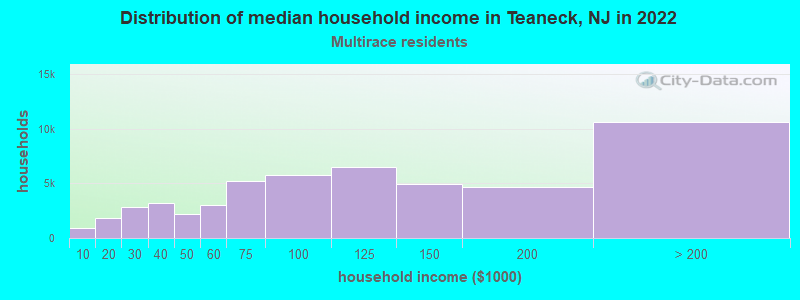
Household income for Two or more races householders
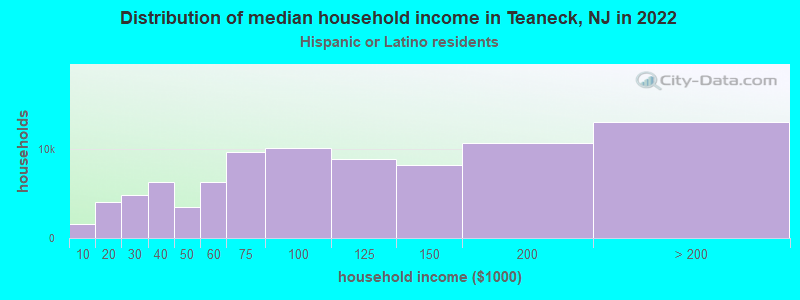
Household income for Hispanic or Latino race householders
Foreign-born residents in Teaneck
9,435 residents are foreign born (10.4% Latin America, 7.2% Asia, 4.7% Europe).
| This city: | 24.0% |
| New Jersey: | 17.5% |
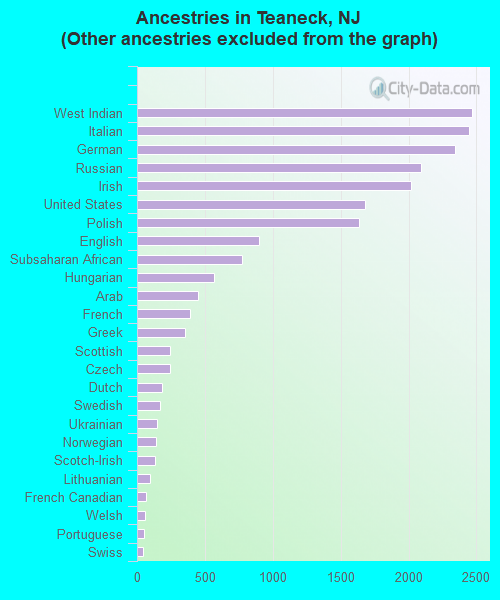
Ancestries in Teaneck

- 20,15350.5%Other
- 2,4696.2%West Indian
- 2,4476.1%Italian
- 2,3425.9%German
- 2,0935.2%Russian
- 2,0175.1%Irish
- 1,6794.2%United States
- 1,6324.1%Polish
- 9022.3%English
- 7751.9%Subsaharan African
- 5691.4%Hungarian
- 4461.1%Arab
- 3871.0%French
- 3510.9%Greek
- 2420.6%Scottish
- 2400.6%Czech
- 1850.5%Dutch
- 1670.4%Swedish
- 1500.4%Ukrainian
- 1390.3%Norwegian
- 1290.3%Scotch-Irish
- 990.2%Lithuanian
- 670.2%French Canadian
- 570.1%Welsh
- 530.1%Portuguese
- 420.1%Swiss
- 290.07%Danish
- 200.05%Slovak
Zip codes: 07666.