Races in Tega Cay, South Carolina (SC) Detailed Stats
Data:
Races - White alone (%)
Races - White alone (% change since 2000)
Races - Black alone (%)
Races - Black alone (% change since 2000)
Races - American Indian alone (%)
Races - American Indian alone (% change since 2000)
Races - Asian alone (%)
Races - Asian alone (% change since 2000)
Races - Hispanic (%)
Races - Hispanic (% change since 2000)
Races - Native Hawaiian and Other Pacific Islander alone (%)
Races - Native Hawaiian and Other Pacific Islander alone (% change since 2000)
Races - Two or more races(%)
Races - Two or more races(% change since 2000)
Races - Other race alone (%)
Races - Other race alone (% change since 2000)
Racial diversity
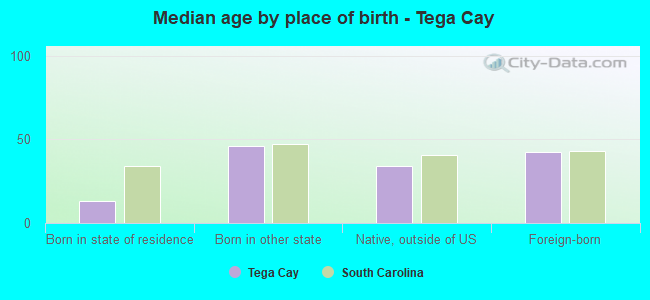
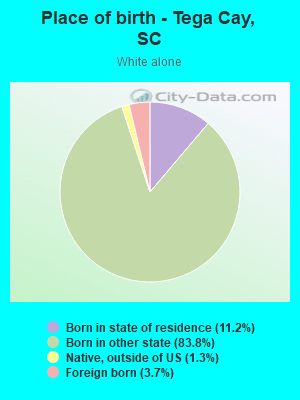
Place of birth - Born in state of residence (%)
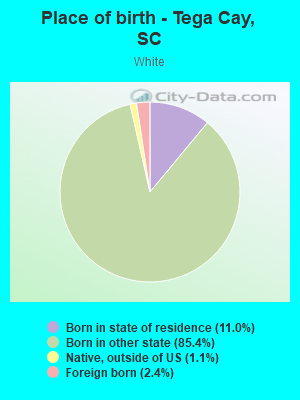
Place of birth - Born in state of residence (%) - White
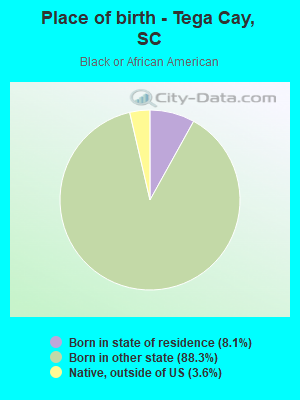
Place of birth - Born in state of residence (%) - Black or African American
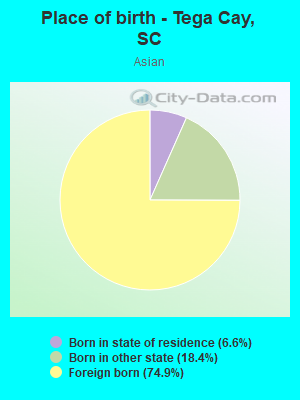
Place of birth - Born in state of residence (%) - Asian
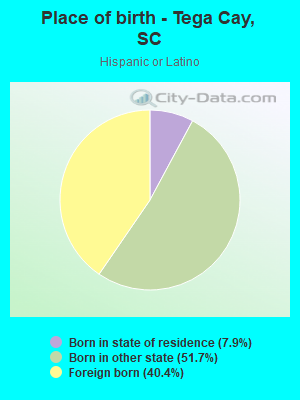
Place of birth - Born in state of residence (%) - Hispanic or Latino
Place of birth - Born in state of residence (%) - American Indian and Alaska Native
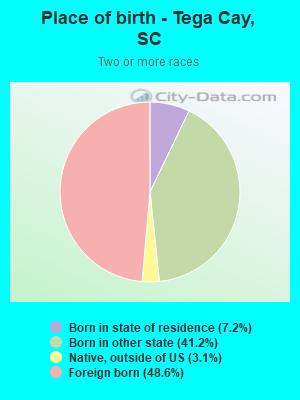
Place of birth - Born in state of residence (%) - Multirace
Place of birth - Born in state of residence (%) - Other Race
Place of birth - Born in other state (%)
Place of birth - Born in other state (%) - White
Place of birth - Born in other state (%) - Black or African American
Place of birth - Born in other state (%) - Asian
Place of birth - Born in other state (%) - Hispanic or Latino
Place of birth - Born in other state (%) - American Indian and Alaska Native
Place of birth - Born in other state (%) - Multirace
Place of birth - Born in other state (%) - Other Race
Place of birth - Native, outside of US (%)
Place of birth - Native, outside of US (%) - White
Place of birth - Native, outside of US (%) - Black or African American
Place of birth - Native, outside of US (%) - Asian
Place of birth - Native, outside of US (%) - Hispanic or Latino
Place of birth - Native, outside of US (%) - American Indian and Alaska Native
Place of birth - Native, outside of US (%) - Multirace
Place of birth - Native, outside of US (%) - Other Race
Place of birth - Foreign born (%)
Place of birth - Foreign born (%) - White
Place of birth - Foreign born (%) - Black or African American
Place of birth - Foreign born (%) - Asian
Place of birth - Foreign born (%) - Hispanic or Latino
Place of birth - Foreign born (%) - American Indian and Alaska Native
Place of birth - Foreign born (%) - Multirace
Place of birth - Foreign born (%) - Other Race
Residents speaking English at home (%)
Residents speaking English at home - Born in the United States (%)
Residents speaking English at home - Native, born elsewhere (%)
Residents speaking English at home - Foreign born (%)
Residents speaking Spanish at home (%)
Residents speaking Spanish at home - Born in the United States (%)
Residents speaking Spanish at home - Native, born elsewhere (%)
Residents speaking Spanish at home - Foreign born (%)
Residents speaking other language at home (%)
Residents speaking other language at home - Born in the United States (%)
Residents speaking other language at home - Native, born elsewhere (%)
Residents speaking other language at home - Foreign born (%)
Marital status - Never married (%)
Marital status - Now married (%)
Marital status - Separated (%)
Marital status - Widowed (%)
Marital status - Divorced (%)
Ancestries Reported - Arab (%)
Ancestries Reported - Czech (%)
Ancestries Reported - Danish (%)
Ancestries Reported - Dutch (%)
Ancestries Reported - English (%)
Ancestries Reported - French (%)
Ancestries Reported - French Canadian (%)
Ancestries Reported - German (%)
Ancestries Reported - Greek (%)
Ancestries Reported - Hungarian (%)
Ancestries Reported - Irish (%)
Ancestries Reported - Italian (%)
Ancestries Reported - Lithuanian (%)
Ancestries Reported - Norwegian (%)
Ancestries Reported - Polish (%)
Ancestries Reported - Portuguese (%)
Ancestries Reported - Russian (%)
Ancestries Reported - Scotch-Irish (%)
Ancestries Reported - Scottish (%)
Ancestries Reported - Slovak (%)
Ancestries Reported - Subsaharan African (%)
Ancestries Reported - Swedish (%)
Ancestries Reported - Swiss (%)
Ancestries Reported - Ukrainian (%)
Ancestries Reported - United States (%)
Ancestries Reported - Welsh (%)
Ancestries Reported - West Indian (%)
Ancestries Reported - Other (%)
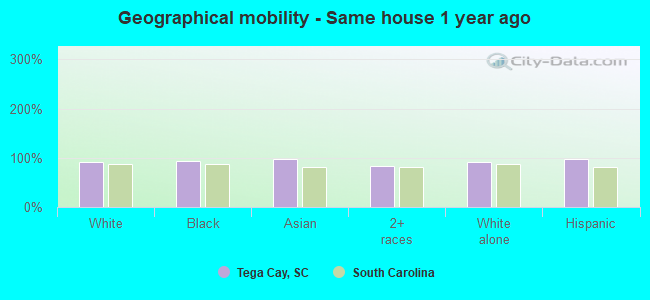
Geographical mobility - Same house 1 year ago (%)
Geographical mobility - Same house 1 year ago (%) - White
Geographical mobility - Same house 1 year ago (%) - Black or African American
Geographical mobility - Same house 1 year ago (%) - Asian
Geographical mobility - Same house 1 year ago (%) - Hispanic or Latino
Geographical mobility - Same house 1 year ago (%) - American Indian and Alaska Native
Geographical mobility - Same house 1 year ago (%) - Multirace
Geographical mobility - Same house 1 year ago (%) - Other Race
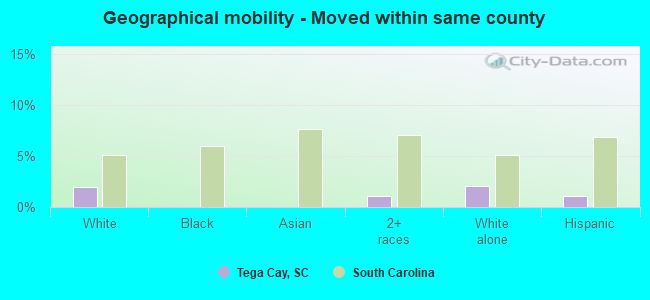
Geographical mobility - Moved within same county (%)
Geographical mobility - Moved within same county (%) - White
Geographical mobility - Moved within same county (%) - Black or African American
Geographical mobility - Moved within same county (%) - Asian
Geographical mobility - Moved within same county (%) - Hispanic or Latino
Geographical mobility - Moved within same county (%) - American Indian and Alaska Native
Geographical mobility - Moved within same county (%) - Multirace
Geographical mobility - Moved within same county (%) - Other Race
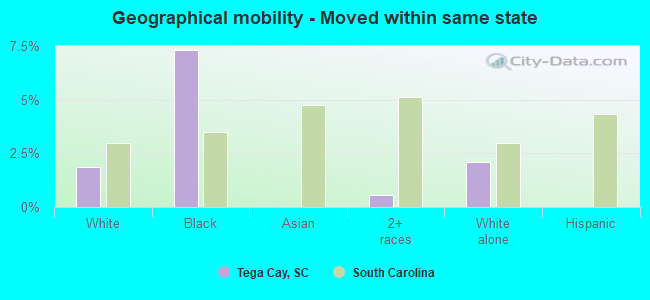
Geographical mobility - Moved from different county within same state (%)
Geographical mobility - Moved from different county within same state (%) - White
Geographical mobility - Moved from different county within same state (%) - Black or African American
Geographical mobility - Moved from different county within same state (%) - Asian
Geographical mobility - Moved from different county within same state (%) - Hispanic or Latino
Geographical mobility - Moved from different county within same state (%) - American Indian and Alaska Native
Geographical mobility - Moved from different county within same state (%) - Multirace
Geographical mobility - Moved from different county within same state (%) - Other Race
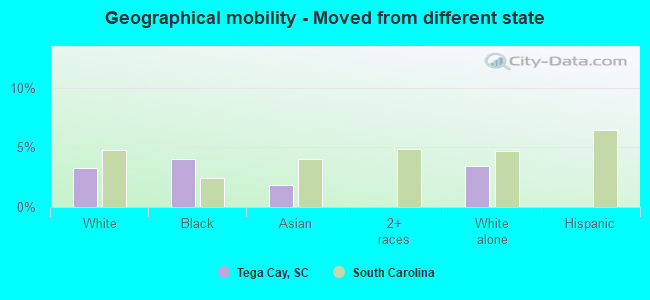
Geographical mobility - Moved from different state (%)
Geographical mobility - Moved from different state (%) - White
Geographical mobility - Moved from different state (%) - Black or African American
Geographical mobility - Moved from different state (%) - Asian
Geographical mobility - Moved from different state (%) - Hispanic or Latino
Geographical mobility - Moved from different state (%) - American Indian and Alaska Native
Geographical mobility - Moved from different state (%) - Multirace
Geographical mobility - Moved from different state (%) - Other Race
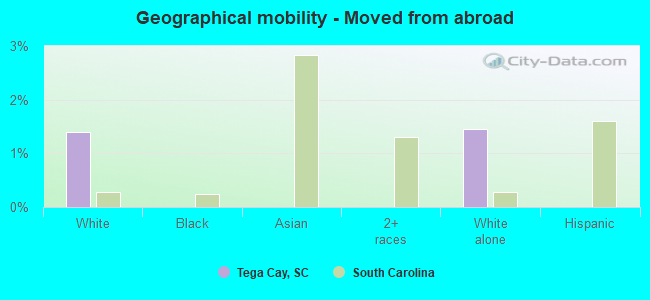
Geographical mobility - Moved from abroad (%)
Geographical mobility - Moved from abroad (%) - White
Geographical mobility - Moved from abroad (%) - Black or African American
Geographical mobility - Moved from abroad (%) - Asian
Geographical mobility - Moved from abroad (%) - Hispanic or Latino
Geographical mobility - Moved from abroad (%) - American Indian and Alaska Native
Geographical mobility - Moved from abroad (%) - Multirace
Geographical mobility - Moved from abroad (%) - Other Race
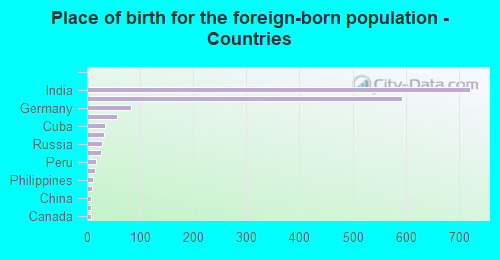
Place of birth for the foreign-born population - Ireland (%)
Place of birth for the foreign-born population - Denmark (%)
Place of birth for the foreign-born population - Norway (%)
Place of birth for the foreign-born population - Sweden (%)
Place of birth for the foreign-born population - United Kingdom (%)
Place of birth for the foreign-born population - England (%)
Place of birth for the foreign-born population - Scotland (%)
Place of birth for the foreign-born population - Other Northern Europe (%)
Place of birth for the foreign-born population - Austria (%)
Place of birth for the foreign-born population - Belgium (%)
Place of birth for the foreign-born population - France (%)
Place of birth for the foreign-born population - Germany (%)
Place of birth for the foreign-born population - Netherlands (%)
Place of birth for the foreign-born population - Switzerland (%)
Place of birth for the foreign-born population - Other Western Europe (%)
Place of birth for the foreign-born population - Greece (%)
Place of birth for the foreign-born population - Italy (%)
Place of birth for the foreign-born population - Portugal (%)
Place of birth for the foreign-born population - Spain (%)
Place of birth for the foreign-born population - Other Southern Europe (%)
Place of birth for the foreign-born population - Albania (%)
Place of birth for the foreign-born population - Belarus (%)
Place of birth for the foreign-born population - Bosnia and Herzegovina (%)
Place of birth for the foreign-born population - Bulgaria (%)
Place of birth for the foreign-born population - Croatia (%)
Place of birth for the foreign-born population - Czechoslovakia (%)
Place of birth for the foreign-born population - Hungary (%)
Place of birth for the foreign-born population - Latvia (%)
Place of birth for the foreign-born population - Lithuania (%)
Place of birth for the foreign-born population - North Macedonia (Macedonia) (%)
Place of birth for the foreign-born population - Moldova (%)
Place of birth for the foreign-born population - Poland (%)
Place of birth for the foreign-born population - Romania (%)
Place of birth for the foreign-born population - Russia (%)
Place of birth for the foreign-born population - Serbia (%)
Place of birth for the foreign-born population - Ukraine (%)
Place of birth for the foreign-born population - Other Eastern Europe (%)
Place of birth for the foreign-born population - China (%)
Place of birth for the foreign-born population - Hong Kong (%)
Place of birth for the foreign-born population - Taiwan (%)
Place of birth for the foreign-born population - Japan (%)
Place of birth for the foreign-born population - Korea (%)
Place of birth for the foreign-born population - Other Eastern Asia (%)
Place of birth for the foreign-born population - Afghanistan (%)
Place of birth for the foreign-born population - Bangladesh (%)
Place of birth for the foreign-born population - India (%)
Place of birth for the foreign-born population - Iran (%)
Place of birth for the foreign-born population - Kazakhstan (%)
Place of birth for the foreign-born population - Nepal (%)
Place of birth for the foreign-born population - Pakistan (%)
Place of birth for the foreign-born population - Sri Lanka (%)
Place of birth for the foreign-born population - Uzbekistan (%)
Place of birth for the foreign-born population - Other South Central Asia (%)
Place of birth for the foreign-born population - Burma (%)
Place of birth for the foreign-born population - Cambodia (%)
Place of birth for the foreign-born population - Indonesia (%)
Place of birth for the foreign-born population - Laos (%)
Place of birth for the foreign-born population - Malaysia (%)
Place of birth for the foreign-born population - Philippines (%)
Place of birth for the foreign-born population - Singapore (%)
Place of birth for the foreign-born population - Thailand (%)
Place of birth for the foreign-born population - Vietnam (%)
Place of birth for the foreign-born population - Other South Eastern Asia (%)
Place of birth for the foreign-born population - Armenia (%)
Place of birth for the foreign-born population - Iraq (%)
Place of birth for the foreign-born population - Israel (%)
Place of birth for the foreign-born population - Jordan (%)
Place of birth for the foreign-born population - Kuwait (%)
Place of birth for the foreign-born population - Lebanon (%)
Place of birth for the foreign-born population - Saudi Arabia (%)
Place of birth for the foreign-born population - Syria (%)
Place of birth for the foreign-born population - Turkey (%)
Place of birth for the foreign-born population - Yemen (%)
Place of birth for the foreign-born population - Other Western Asia (%)
Place of birth for the foreign-born population - Eritrea (%)
Place of birth for the foreign-born population - Ethiopia (%)
Place of birth for the foreign-born population - Kenya (%)
Place of birth for the foreign-born population - Somalia (%)
Place of birth for the foreign-born population - Uganda (%)
Place of birth for the foreign-born population - Zimbabwe (%)
Place of birth for the foreign-born population - Other Eastern Africa (%)
Place of birth for the foreign-born population - Cameroon (%)
Place of birth for the foreign-born population - Congo (%)
Place of birth for the foreign-born population - Democratic Republic of Congo (Zaire) (%)
Place of birth for the foreign-born population - Other Middle Africa (%)
Place of birth for the foreign-born population - Egypt (%)
Place of birth for the foreign-born population - Morocco (%)
Place of birth for the foreign-born population - Sudan (%)
Place of birth for the foreign-born population - Other Northern Africa (%)
Place of birth for the foreign-born population - South Africa (%)
Place of birth for the foreign-born population - Other Southern Africa (%)
Place of birth for the foreign-born population - Cabo Verde (%)
Place of birth for the foreign-born population - Ghana (%)
Place of birth for the foreign-born population - Liberia (%)
Place of birth for the foreign-born population - Nigeria (%)
Place of birth for the foreign-born population - Senegal (%)
Place of birth for the foreign-born population - Sierra Leone (%)
Place of birth for the foreign-born population - Other Western Africa (%)
Place of birth for the foreign-born population - Australia (%)
Place of birth for the foreign-born population - New Zealand (%)
Place of birth for the foreign-born population - Fiji (%)
Place of birth for the foreign-born population - Micronesia (%)
Place of birth for the foreign-born population - Bahamas (%)
Place of birth for the foreign-born population - Barbados (%)
Place of birth for the foreign-born population - Cuba (%)
Place of birth for the foreign-born population - Dominica (%)
Place of birth for the foreign-born population - Dominican Republic (%)
Place of birth for the foreign-born population - Grenada (%)
Place of birth for the foreign-born population - Haiti (%)
Place of birth for the foreign-born population - Jamaica (%)
Place of birth for the foreign-born population - St. Vincent and the Grenadines (%)
Place of birth for the foreign-born population - Trinidad and Tobago (%)
Place of birth for the foreign-born population - West Indies (%)
Place of birth for the foreign-born population - Other Caribbean (%)
Place of birth for the foreign-born population - Belize (%)
Place of birth for the foreign-born population - Costa Rica (%)
Place of birth for the foreign-born population - El Salvador (%)
Place of birth for the foreign-born population - Guatemala (%)
Place of birth for the foreign-born population - Honduras (%)
Place of birth for the foreign-born population - Mexico (%)
Place of birth for the foreign-born population - Nicaragua (%)
Place of birth for the foreign-born population - Panama (%)
Place of birth for the foreign-born population - Other Central America (%)
Place of birth for the foreign-born population - Argentina (%)
Place of birth for the foreign-born population - Bolivia (%)
Place of birth for the foreign-born population - Brazil (%)
Place of birth for the foreign-born population - Chile (%)
Place of birth for the foreign-born population - Colombia (%)
Place of birth for the foreign-born population - Ecuador (%)
Place of birth for the foreign-born population - Guyana (%)
Place of birth for the foreign-born population - Peru (%)
Place of birth for the foreign-born population - Uruguay (%)
Place of birth for the foreign-born population - Venezuela (%)
Place of birth for the foreign-born population - Other South America (%)
Place of birth for the foreign-born population - Canada (%)
Place of birth for the foreign-born population - Other Northern America (%)
Place of birth for the foreign-born population - Other (%)
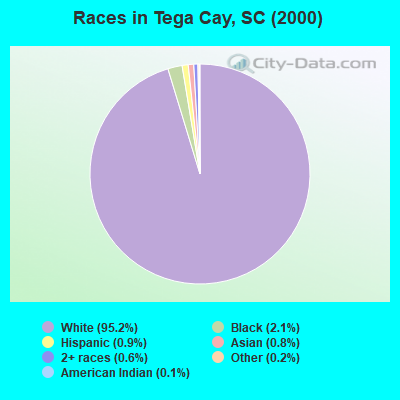
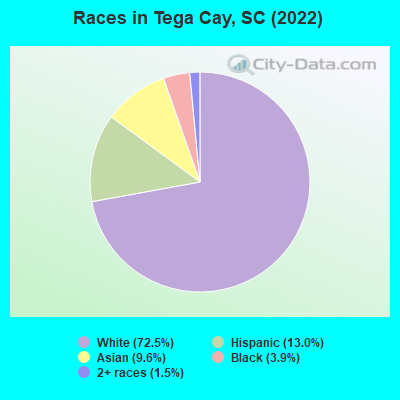
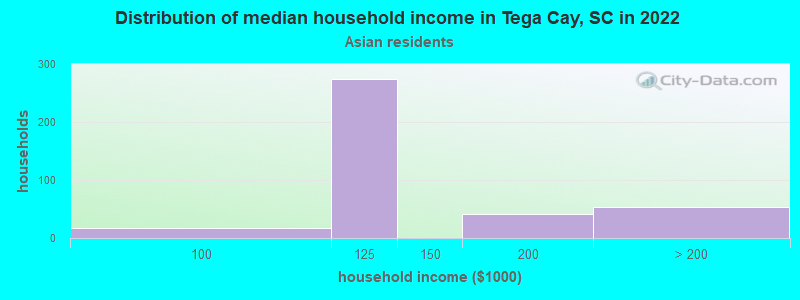
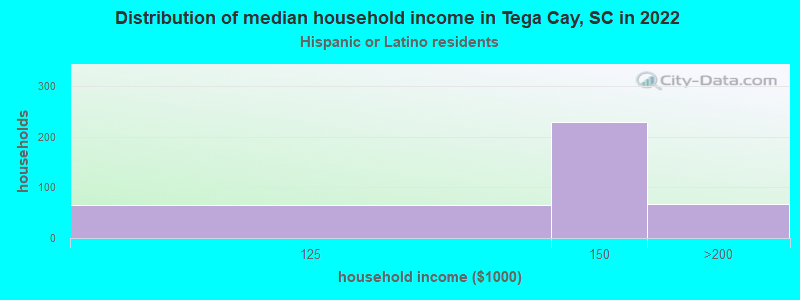
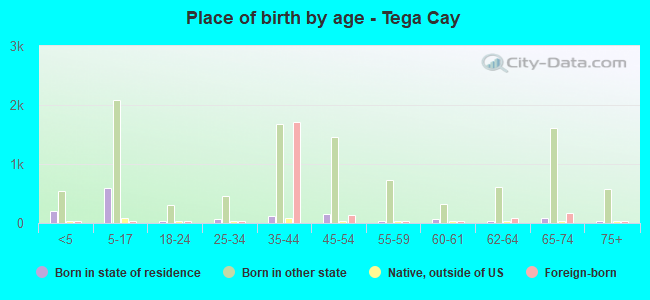
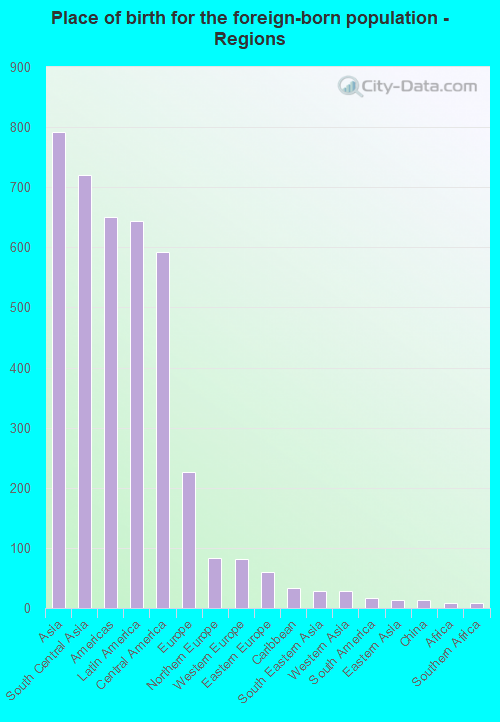
According to 2022 data, the most numerous races in Tega Cay, SC are White alone (9,666 residents), Black alone (523 residents), and Hispanic (1,730 residents). 80.4% of Tega Cay residents speak English at home. 12.6% of Tega Cay, SC residents are foreign-born (6.1% born in Asia, 5.0% born in Latin America, 1.7% born in Europe), which is 60.3% greater than the foreign-born rate of 5.0% across the entire state of South Carolina.
Race distribution in Tega Cay
2000 2022
2,652,291 66.1% White alone 1,178,486 29.4% Black alone 95,076 2.4% Hispanic 35,568 0.9% Asian alone 33,290 0.8% Two or more races 12,765 0.3% American Indian alone 3,266 0.08% Other race alone 1,270 0.03% Native Hawaiian and Other
3,301,739 62.5% White alone 1,313,290 24.9% Black alone 343,783 6.5% Hispanic 190,508 3.6% Two or more races 89,888 1.7% Asian alone 29,390 0.6% Other race alone 12,112 0.2% American Indian alone 1,924 0.04% Native Hawaiian and Other
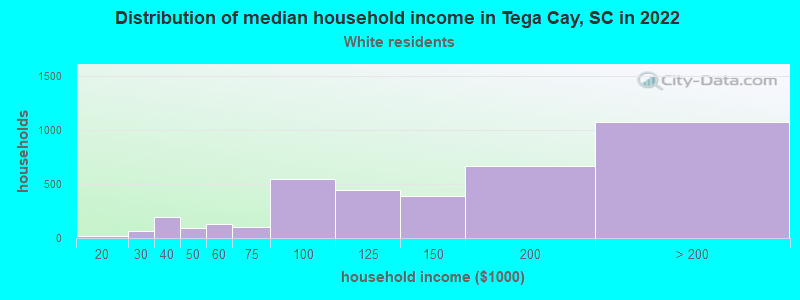
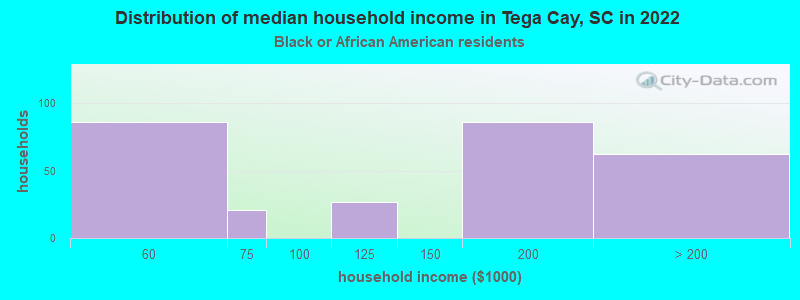
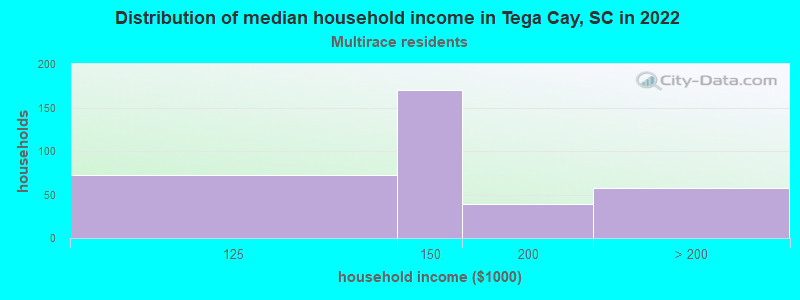
Income and house value in Tega Cay Median household income in 2022 $137,646 White non-Hispanic householders$134,827 Asian householders$137,300 Two or more races householders$163,859 Hispanic or Latino race householdersMedian 2022 house value $597,316 White Non-Hispanic householders$531,938 Black or African American householders $742,931 Asian householders
Median age by race in Tega Cay
47.0 Median age for White residents49.7 45.1 48.5 Median age for Black or African American residents42.5 50.4 -853,977,844.1 Median age for American Indian / Alaska Native residents-833,333,332.5 -844,331,640.4 40.4 Median age for Asian residents44.6 39.8 -698,412,697.7 Median age for Native Hawaiian / Pacific Islander residents-666,666,666.0 -1,016,109,044.8 -857,901,725.6 Median age for Other race residents-734,751,772.3 -960,937,499.0 42.6 Median age for Two or more races residents42.2 45.4 46.4 Median age for White alone residents48.6 44.5 41.8 Median age for Hispanic or Latino residents44.3 42.0
Owner/renter occupied households by race in Tega Cay
House owners and renters - White residents 3,543 94.0% Owner occupied228 6.0% Renter occupiedHouse owners and renters - Black or African American residents 124 44.7% Owner occupied154 55.3% Renter occupiedHouse owners and renters - Asian residents 522 100.0% Owner occupiedHouse owners and renters - Two or more races residents 165 29.3% Owner occupied398 70.7% Renter occupiedHouse owners and renters - White alone residents 3,465 93.7% Owner occupied234 6.3% Renter occupiedHouse owners and renters - Hispanic or Latino residents 206 40.0% Owner occupied309 60.0% Renter occupied
Language usage in Tega Cay
English speakers - Total 80.4% of residents of Tega Cay speak English at home.
8.4% of residents speak Spanish at home 480 45.3% Speak English very well580 54.7% Speak English less than very well12.1% of residents speak other language at home 1,367 89.8% Speak English very well156 10.2% Speak English less than very well
English speakers - Born in the United States 93.8% of residents of Tega Cay speak English at home.
4.5% of residents speak Spanish at home 339 77.2% Speak English very well100 22.8% Speak English less than very well1.8% of residents speak other language at home 139 79.4% Speak English very well36 20.6% Speak English less than very well
English speakers - Native, born elsewhere 75.1% of residents of Tega Cay speak English at home.
7.0% of residents speak other language at home 18 100.0% Speak English very well
English speakers - Foreign-born 4.5% of residents of Tega Cay speak English at home.
30.2% of residents speak Spanish at home 63 10.9% Speak English very well517 89.1% Speak English less than very well65.9% of residents speak other language at home 1,159 91.5% Speak English very well107 8.5% Speak English less than very well
White (Caucasian) - Speak only English Native:
97.4% (8,824)Foreign-born:
37.7% (91)
White (Caucasian) - Speak another language Native:
2.3% (204)Foreign-born:
62.5% (151)
Asian - Speak another language Native:
65.5% (188)Foreign-born:
100.0% (916)
Two or more races - Speak another language Native:
44.0% (339)Foreign-born:
100.0% (956)
White alone - Speak only English Native:
97.5% (8,638)Foreign-born:
25.5% (95)
White alone - Speak another language Native:
2.5% (223)Foreign-born:
79.2% (296)
Hispanic or Latino - Speak another language Native:
39.9% (351)Foreign-born:
94.5% (646)
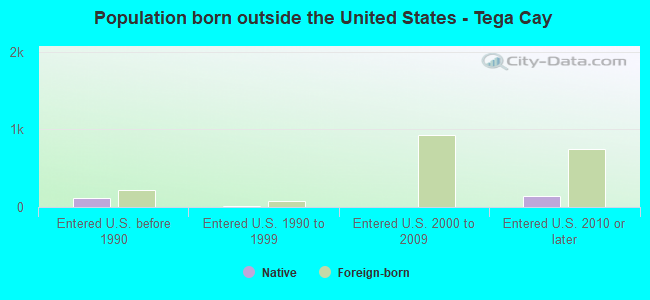
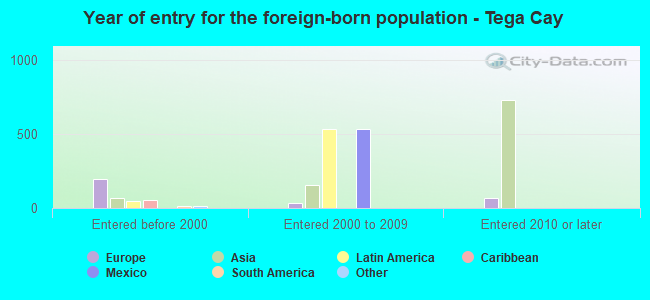
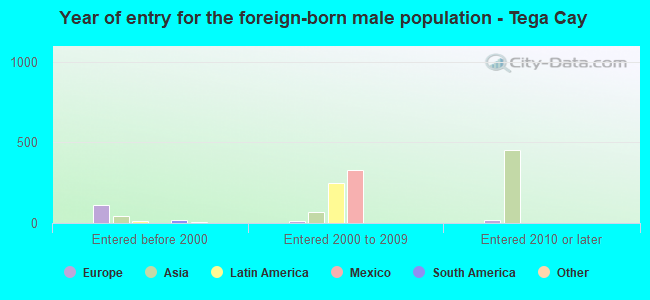
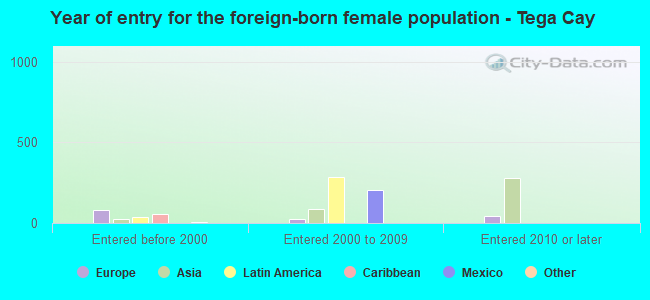
Foreign-born residents in Tega Cay 1,680 residents are foreign born (6.1% Asia , 5.0% Latin America , 1.7% Europe ).
This city:
12.6%South Carolina:
5.3%
Marital status for residents in Tega Cay Marital status - White (Caucasian) population 15 years and over
Males 12.4% Never married83.1% Now married2.2% Separated1.3% Widowed1.0% DivorcedFemales 12.7% Never married76.5% Now married0.4% Separated6.9% Widowed3.4% DivorcedWomen who gave birth in the past 12 months Now married:
100.0% (88)Unmarried:
0.0% (0)
Women who did not give birth in the past 12 months Now married:
73.5% (1,337)Unmarried:
26.5% (481)
Marital status - Black or African American population 15 years and over
Males 18.5% Never married81.5% Now married0.0% Separated0.0% Widowed0.0% DivorcedFemales 0.0% Never married64.9% Now married0.0% Separated0.0% Widowed35.1% DivorcedWomen who did not give birth in the past 12 months Now married:
100.0% (161)Unmarried:
0.0% (0)
Marital status - Asian population 15 years and over
Males 0.0% Never married100.0% Now married0.0% Separated0.0% Widowed0.0% DivorcedFemales 0.0% Never married100.0% Now married0.0% Separated0.0% Widowed0.0% DivorcedWomen who did not give birth in the past 12 months Now married:
100.0% (411)Unmarried:
0.0% (0)
Marital status - Two or more races population 15 years and over
Males 7.0% Never married89.5% Now married3.5% Separated0.0% Widowed0.0% DivorcedFemales 11.4% Never married88.6% Now married0.0% Separated0.0% Widowed0.0% DivorcedWomen who did not give birth in the past 12 months Now married:
84.6% (315)Unmarried:
15.4% (57)
Marital status - White alone, not Hispanic / Latino population 15 years and over
Males 12.1% Never married83.1% Now married2.3% Separated1.3% Widowed1.1% DivorcedFemales 12.7% Never married76.3% Now married0.4% Separated7.1% Widowed3.5% DivorcedWomen who gave birth in the past 12 months Now married:
100.0% (91)Unmarried:
0.0% (0)
Women who did not give birth in the past 12 months Now married:
74.1% (1,371)Unmarried:
25.9% (480)
Marital status - Hispanic or Latino population 15 years and over
Males 5.2% Never married94.8% Now married0.0% Separated0.0% Widowed0.0% DivorcedFemales 12.5% Never married87.5% Now married0.0% Separated0.0% Widowed0.0% DivorcedWomen who did not give birth in the past 12 months Now married:
79.5% (319)Unmarried:
20.5% (82)
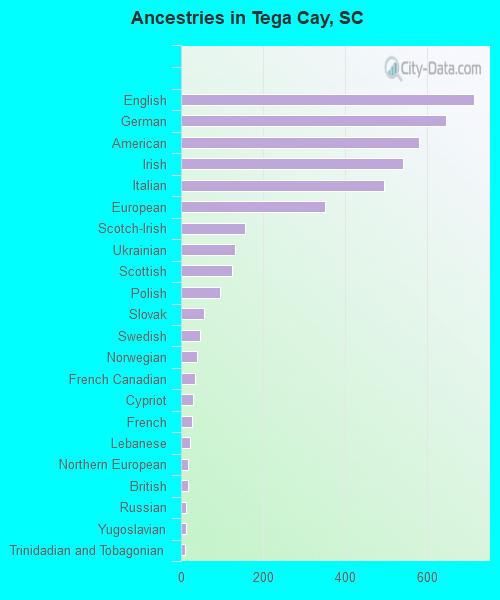
Ancestries in Tega Cay
714 10.7% English644 9.7% German580 8.7% American540 8.1% Irish494 7.4% Italian350 5.3% European155 2.3% Scotch-Irish132 2.0% Ukrainian125 1.9% Scottish95 1.4% Polish55 0.8% Slovak46 0.7% Swedish38 0.6% Norwegian35 0.5% French Canadian28 0.4% Cypriot27 0.4% French21 0.3% Lebanese17 0.3% Northern European16 0.2% British12 0.2% Russian12 0.2% Yugoslavian9 0.1% Trinidadian and Tobagonian6 0.09% Canadian6 0.09% Eastern European5 0.08% Austrian
Geographical mobility in Tega Cay Same house 1 year ago 8,884 92.1% White (Caucasian)490 93.4% Black or African American1,132 97.2% Asian1,531 83.9% Two or more races8,736 91.4% White alone, not Hispanic / Latino1,596 97.2% Hispanic or LatinoMoved within same county 191 2.0% White / Caucasian20 1.1% Two or more races201 2.1% White alone, not Hispanic / Latino18 1.1% Hispanic or LatinoMoved within same state 179 1.9% White / Caucasian38 7.3% Black or African American10 0.5% Two or more races198 2.1% White alone, not Hispanic / LatinoMoved from different state 316 3.3% White / Caucasian21 4.0% Black or African American22 1.9% Asian325 3.4% White alone, not Hispanic / LatinoMoved from abroad 135 1.4% White140 1.5% White alone, not Hispanic / Latino
Children Nativity (place of birth) in Tega Cay
Children under 6 years - Living with two parents Both parents native 667 100.0% NativeBoth parents foreign-born 345 100.0% NativeChildren under 6 years - Living with one parent Native parent 15 100.0% NativeChildren 6 to 17 years - Living with two parents Both parents native 2,209 100.0% NativeBoth parents foreign-born 340 94.0% Native22 6.0% Foreign-bornOne native, one foreign-born parent 19 100.0% NativeChildren 6 to 17 years - Living with one parent Native parent 104 100.0% NativeForeign-born parent 36 43.4% Native47 56.6% Foreign-born