Races in Tenafly, New Jersey (NJ) Detailed Stats
Data:
Races - White alone (%)
Races - White alone (% change since 2000)
Races - Black alone (%)
Races - Black alone (% change since 2000)
Races - American Indian alone (%)
Races - American Indian alone (% change since 2000)
Races - Asian alone (%)
Races - Asian alone (% change since 2000)
Races - Hispanic (%)
Races - Hispanic (% change since 2000)
Races - Native Hawaiian and Other Pacific Islander alone (%)
Races - Native Hawaiian and Other Pacific Islander alone (% change since 2000)
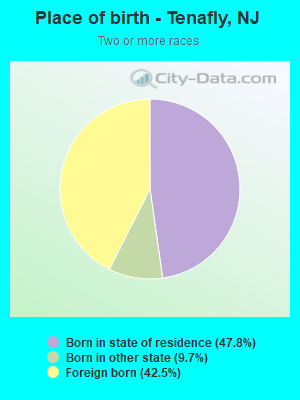
Races - Two or more races(%)
Races - Two or more races(% change since 2000)
Races - Other race alone (%)
Races - Other race alone (% change since 2000)
Racial diversity
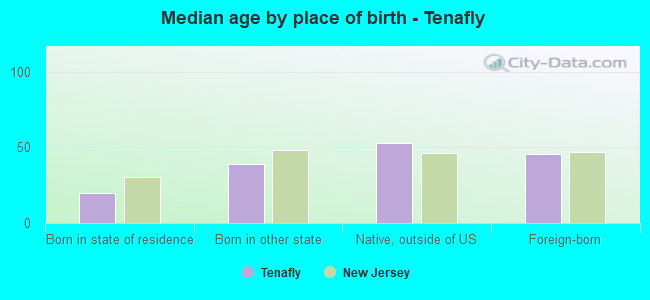
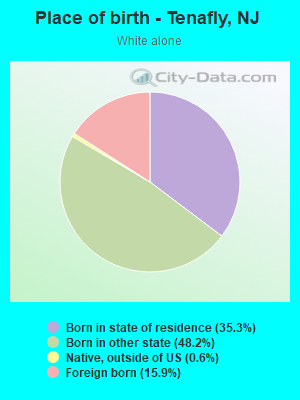
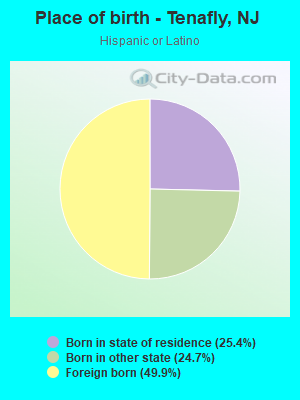
Place of birth - Born in state of residence (%)
Place of birth - Born in state of residence (%) - White
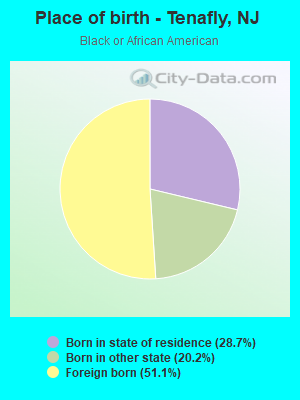
Place of birth - Born in state of residence (%) - Black or African American
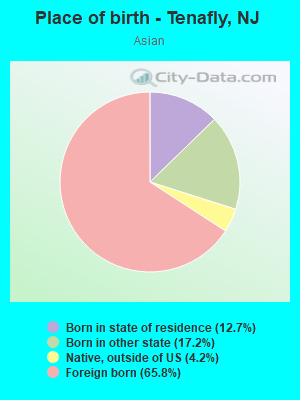
Place of birth - Born in state of residence (%) - Asian
Place of birth - Born in state of residence (%) - Hispanic or Latino
Place of birth - Born in state of residence (%) - American Indian and Alaska Native
Place of birth - Born in state of residence (%) - Multirace
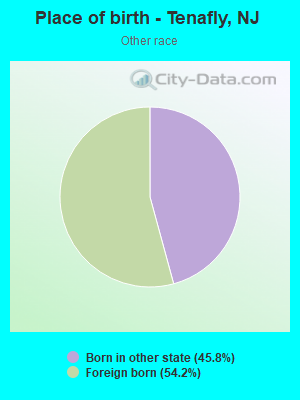
Place of birth - Born in state of residence (%) - Other Race
Place of birth - Born in other state (%)
Place of birth - Born in other state (%) - White
Place of birth - Born in other state (%) - Black or African American
Place of birth - Born in other state (%) - Asian
Place of birth - Born in other state (%) - Hispanic or Latino
Place of birth - Born in other state (%) - American Indian and Alaska Native
Place of birth - Born in other state (%) - Multirace
Place of birth - Born in other state (%) - Other Race
Place of birth - Native, outside of US (%)
Place of birth - Native, outside of US (%) - White
Place of birth - Native, outside of US (%) - Black or African American
Place of birth - Native, outside of US (%) - Asian
Place of birth - Native, outside of US (%) - Hispanic or Latino
Place of birth - Native, outside of US (%) - American Indian and Alaska Native
Place of birth - Native, outside of US (%) - Multirace
Place of birth - Native, outside of US (%) - Other Race
Place of birth - Foreign born (%)
Place of birth - Foreign born (%) - White
Place of birth - Foreign born (%) - Black or African American
Place of birth - Foreign born (%) - Asian
Place of birth - Foreign born (%) - Hispanic or Latino
Place of birth - Foreign born (%) - American Indian and Alaska Native
Place of birth - Foreign born (%) - Multirace
Place of birth - Foreign born (%) - Other Race
Residents speaking English at home (%)
Residents speaking English at home - Born in the United States (%)
Residents speaking English at home - Native, born elsewhere (%)
Residents speaking English at home - Foreign born (%)
Residents speaking Spanish at home (%)
Residents speaking Spanish at home - Born in the United States (%)
Residents speaking Spanish at home - Native, born elsewhere (%)
Residents speaking Spanish at home - Foreign born (%)
Residents speaking other language at home (%)
Residents speaking other language at home - Born in the United States (%)
Residents speaking other language at home - Native, born elsewhere (%)
Residents speaking other language at home - Foreign born (%)
Marital status - Never married (%)
Marital status - Now married (%)
Marital status - Separated (%)
Marital status - Widowed (%)
Marital status - Divorced (%)
Ancestries Reported - Arab (%)
Ancestries Reported - Czech (%)
Ancestries Reported - Danish (%)
Ancestries Reported - Dutch (%)
Ancestries Reported - English (%)
Ancestries Reported - French (%)
Ancestries Reported - French Canadian (%)
Ancestries Reported - German (%)
Ancestries Reported - Greek (%)
Ancestries Reported - Hungarian (%)
Ancestries Reported - Irish (%)
Ancestries Reported - Italian (%)
Ancestries Reported - Lithuanian (%)
Ancestries Reported - Norwegian (%)
Ancestries Reported - Polish (%)
Ancestries Reported - Portuguese (%)
Ancestries Reported - Russian (%)
Ancestries Reported - Scotch-Irish (%)
Ancestries Reported - Scottish (%)
Ancestries Reported - Slovak (%)
Ancestries Reported - Subsaharan African (%)
Ancestries Reported - Swedish (%)
Ancestries Reported - Swiss (%)
Ancestries Reported - Ukrainian (%)
Ancestries Reported - United States (%)
Ancestries Reported - Welsh (%)
Ancestries Reported - West Indian (%)
Ancestries Reported - Other (%)
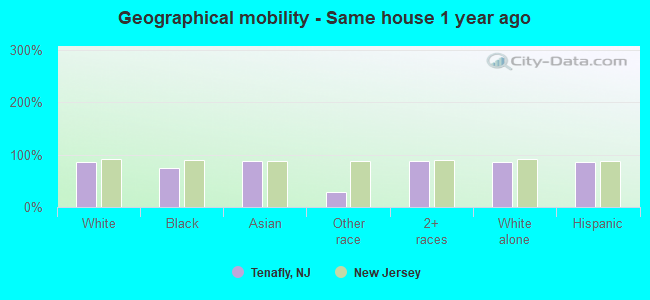
Geographical mobility - Same house 1 year ago (%)
Geographical mobility - Same house 1 year ago (%) - White
Geographical mobility - Same house 1 year ago (%) - Black or African American
Geographical mobility - Same house 1 year ago (%) - Asian
Geographical mobility - Same house 1 year ago (%) - Hispanic or Latino
Geographical mobility - Same house 1 year ago (%) - American Indian and Alaska Native
Geographical mobility - Same house 1 year ago (%) - Multirace
Geographical mobility - Same house 1 year ago (%) - Other Race
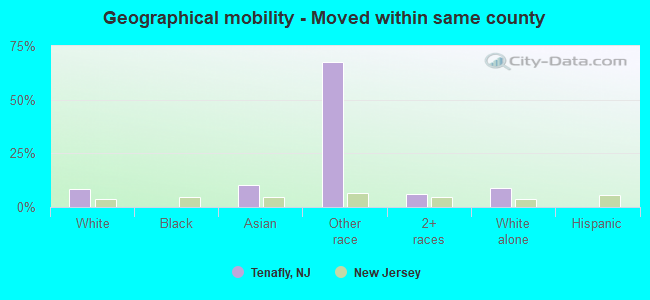
Geographical mobility - Moved within same county (%)
Geographical mobility - Moved within same county (%) - White
Geographical mobility - Moved within same county (%) - Black or African American
Geographical mobility - Moved within same county (%) - Asian
Geographical mobility - Moved within same county (%) - Hispanic or Latino
Geographical mobility - Moved within same county (%) - American Indian and Alaska Native
Geographical mobility - Moved within same county (%) - Multirace
Geographical mobility - Moved within same county (%) - Other Race
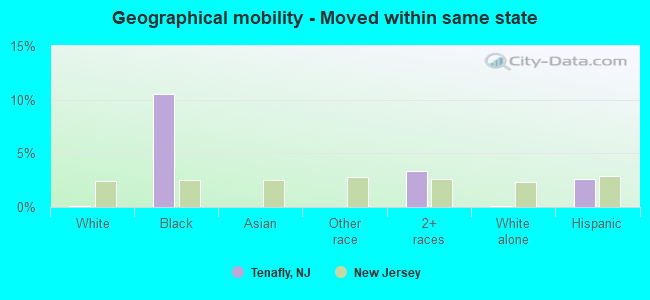
Geographical mobility - Moved from different county within same state (%)
Geographical mobility - Moved from different county within same state (%) - White
Geographical mobility - Moved from different county within same state (%) - Black or African American
Geographical mobility - Moved from different county within same state (%) - Asian
Geographical mobility - Moved from different county within same state (%) - Hispanic or Latino
Geographical mobility - Moved from different county within same state (%) - American Indian and Alaska Native
Geographical mobility - Moved from different county within same state (%) - Multirace
Geographical mobility - Moved from different county within same state (%) - Other Race
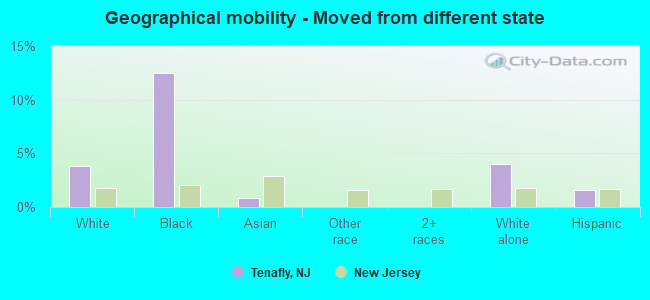
Geographical mobility - Moved from different state (%)
Geographical mobility - Moved from different state (%) - White
Geographical mobility - Moved from different state (%) - Black or African American
Geographical mobility - Moved from different state (%) - Asian
Geographical mobility - Moved from different state (%) - Hispanic or Latino
Geographical mobility - Moved from different state (%) - American Indian and Alaska Native
Geographical mobility - Moved from different state (%) - Multirace
Geographical mobility - Moved from different state (%) - Other Race
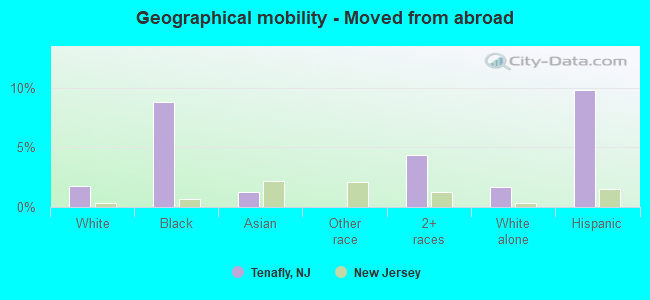
Geographical mobility - Moved from abroad (%)
Geographical mobility - Moved from abroad (%) - White
Geographical mobility - Moved from abroad (%) - Black or African American
Geographical mobility - Moved from abroad (%) - Asian
Geographical mobility - Moved from abroad (%) - Hispanic or Latino
Geographical mobility - Moved from abroad (%) - American Indian and Alaska Native
Geographical mobility - Moved from abroad (%) - Multirace
Geographical mobility - Moved from abroad (%) - Other Race
Place of birth for the foreign-born population - Ireland (%)
Place of birth for the foreign-born population - Denmark (%)
Place of birth for the foreign-born population - Norway (%)
Place of birth for the foreign-born population - Sweden (%)
Place of birth for the foreign-born population - United Kingdom (%)
Place of birth for the foreign-born population - England (%)
Place of birth for the foreign-born population - Scotland (%)
Place of birth for the foreign-born population - Other Northern Europe (%)
Place of birth for the foreign-born population - Austria (%)
Place of birth for the foreign-born population - Belgium (%)
Place of birth for the foreign-born population - France (%)
Place of birth for the foreign-born population - Germany (%)
Place of birth for the foreign-born population - Netherlands (%)
Place of birth for the foreign-born population - Switzerland (%)
Place of birth for the foreign-born population - Other Western Europe (%)
Place of birth for the foreign-born population - Greece (%)
Place of birth for the foreign-born population - Italy (%)
Place of birth for the foreign-born population - Portugal (%)
Place of birth for the foreign-born population - Spain (%)
Place of birth for the foreign-born population - Other Southern Europe (%)
Place of birth for the foreign-born population - Albania (%)
Place of birth for the foreign-born population - Belarus (%)
Place of birth for the foreign-born population - Bosnia and Herzegovina (%)
Place of birth for the foreign-born population - Bulgaria (%)
Place of birth for the foreign-born population - Croatia (%)
Place of birth for the foreign-born population - Czechoslovakia (%)
Place of birth for the foreign-born population - Hungary (%)
Place of birth for the foreign-born population - Latvia (%)
Place of birth for the foreign-born population - Lithuania (%)
Place of birth for the foreign-born population - North Macedonia (Macedonia) (%)
Place of birth for the foreign-born population - Moldova (%)
Place of birth for the foreign-born population - Poland (%)
Place of birth for the foreign-born population - Romania (%)
Place of birth for the foreign-born population - Russia (%)
Place of birth for the foreign-born population - Serbia (%)
Place of birth for the foreign-born population - Ukraine (%)
Place of birth for the foreign-born population - Other Eastern Europe (%)
Place of birth for the foreign-born population - China (%)
Place of birth for the foreign-born population - Hong Kong (%)
Place of birth for the foreign-born population - Taiwan (%)
Place of birth for the foreign-born population - Japan (%)
Place of birth for the foreign-born population - Korea (%)
Place of birth for the foreign-born population - Other Eastern Asia (%)
Place of birth for the foreign-born population - Afghanistan (%)
Place of birth for the foreign-born population - Bangladesh (%)
Place of birth for the foreign-born population - India (%)
Place of birth for the foreign-born population - Iran (%)
Place of birth for the foreign-born population - Kazakhstan (%)
Place of birth for the foreign-born population - Nepal (%)
Place of birth for the foreign-born population - Pakistan (%)
Place of birth for the foreign-born population - Sri Lanka (%)
Place of birth for the foreign-born population - Uzbekistan (%)
Place of birth for the foreign-born population - Other South Central Asia (%)
Place of birth for the foreign-born population - Burma (%)
Place of birth for the foreign-born population - Cambodia (%)
Place of birth for the foreign-born population - Indonesia (%)
Place of birth for the foreign-born population - Laos (%)
Place of birth for the foreign-born population - Malaysia (%)
Place of birth for the foreign-born population - Philippines (%)
Place of birth for the foreign-born population - Singapore (%)
Place of birth for the foreign-born population - Thailand (%)
Place of birth for the foreign-born population - Vietnam (%)
Place of birth for the foreign-born population - Other South Eastern Asia (%)
Place of birth for the foreign-born population - Armenia (%)
Place of birth for the foreign-born population - Iraq (%)
Place of birth for the foreign-born population - Israel (%)
Place of birth for the foreign-born population - Jordan (%)
Place of birth for the foreign-born population - Kuwait (%)
Place of birth for the foreign-born population - Lebanon (%)
Place of birth for the foreign-born population - Saudi Arabia (%)
Place of birth for the foreign-born population - Syria (%)
Place of birth for the foreign-born population - Turkey (%)
Place of birth for the foreign-born population - Yemen (%)
Place of birth for the foreign-born population - Other Western Asia (%)
Place of birth for the foreign-born population - Eritrea (%)
Place of birth for the foreign-born population - Ethiopia (%)
Place of birth for the foreign-born population - Kenya (%)
Place of birth for the foreign-born population - Somalia (%)
Place of birth for the foreign-born population - Uganda (%)
Place of birth for the foreign-born population - Zimbabwe (%)
Place of birth for the foreign-born population - Other Eastern Africa (%)
Place of birth for the foreign-born population - Cameroon (%)
Place of birth for the foreign-born population - Congo (%)
Place of birth for the foreign-born population - Democratic Republic of Congo (Zaire) (%)
Place of birth for the foreign-born population - Other Middle Africa (%)
Place of birth for the foreign-born population - Egypt (%)
Place of birth for the foreign-born population - Morocco (%)
Place of birth for the foreign-born population - Sudan (%)
Place of birth for the foreign-born population - Other Northern Africa (%)
Place of birth for the foreign-born population - South Africa (%)
Place of birth for the foreign-born population - Other Southern Africa (%)
Place of birth for the foreign-born population - Cabo Verde (%)
Place of birth for the foreign-born population - Ghana (%)
Place of birth for the foreign-born population - Liberia (%)
Place of birth for the foreign-born population - Nigeria (%)
Place of birth for the foreign-born population - Senegal (%)
Place of birth for the foreign-born population - Sierra Leone (%)
Place of birth for the foreign-born population - Other Western Africa (%)
Place of birth for the foreign-born population - Australia (%)
Place of birth for the foreign-born population - New Zealand (%)
Place of birth for the foreign-born population - Fiji (%)
Place of birth for the foreign-born population - Micronesia (%)
Place of birth for the foreign-born population - Bahamas (%)
Place of birth for the foreign-born population - Barbados (%)
Place of birth for the foreign-born population - Cuba (%)
Place of birth for the foreign-born population - Dominica (%)
Place of birth for the foreign-born population - Dominican Republic (%)
Place of birth for the foreign-born population - Grenada (%)
Place of birth for the foreign-born population - Haiti (%)
Place of birth for the foreign-born population - Jamaica (%)
Place of birth for the foreign-born population - St. Vincent and the Grenadines (%)
Place of birth for the foreign-born population - Trinidad and Tobago (%)
Place of birth for the foreign-born population - West Indies (%)
Place of birth for the foreign-born population - Other Caribbean (%)
Place of birth for the foreign-born population - Belize (%)
Place of birth for the foreign-born population - Costa Rica (%)
Place of birth for the foreign-born population - El Salvador (%)
Place of birth for the foreign-born population - Guatemala (%)
Place of birth for the foreign-born population - Honduras (%)
Place of birth for the foreign-born population - Mexico (%)
Place of birth for the foreign-born population - Nicaragua (%)
Place of birth for the foreign-born population - Panama (%)
Place of birth for the foreign-born population - Other Central America (%)
Place of birth for the foreign-born population - Argentina (%)
Place of birth for the foreign-born population - Bolivia (%)
Place of birth for the foreign-born population - Brazil (%)
Place of birth for the foreign-born population - Chile (%)
Place of birth for the foreign-born population - Colombia (%)
Place of birth for the foreign-born population - Ecuador (%)
Place of birth for the foreign-born population - Guyana (%)
Place of birth for the foreign-born population - Peru (%)
Place of birth for the foreign-born population - Uruguay (%)
Place of birth for the foreign-born population - Venezuela (%)
Place of birth for the foreign-born population - Other South America (%)
Place of birth for the foreign-born population - Canada (%)
Place of birth for the foreign-born population - Other Northern America (%)
Place of birth for the foreign-born population - Other (%)
Latest news about races in Tenafly, NJ collected exclusively by city-data.com from local newspapers, TV, and radio stations
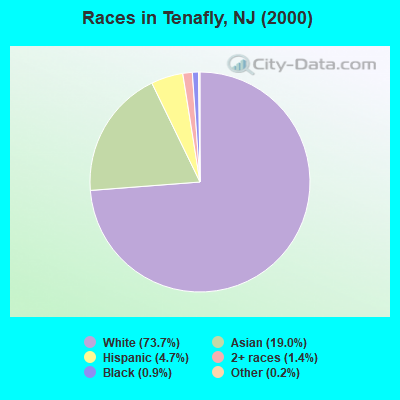
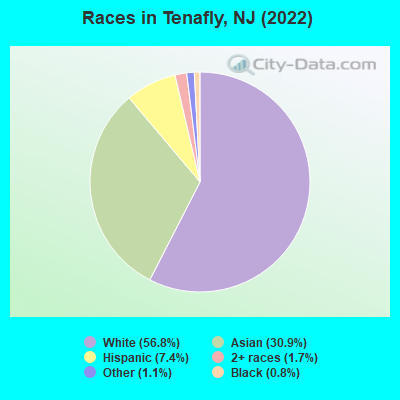
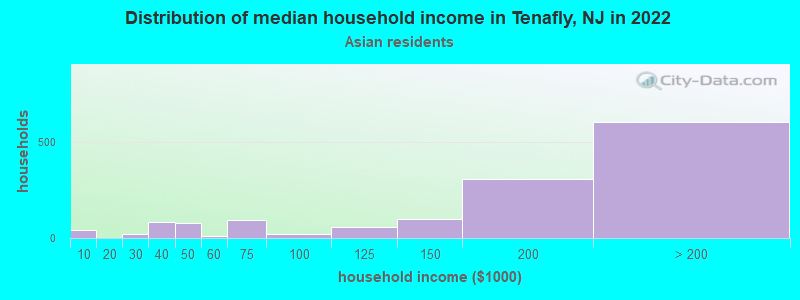
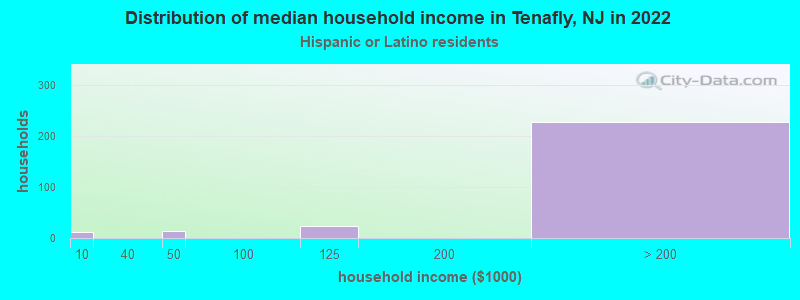
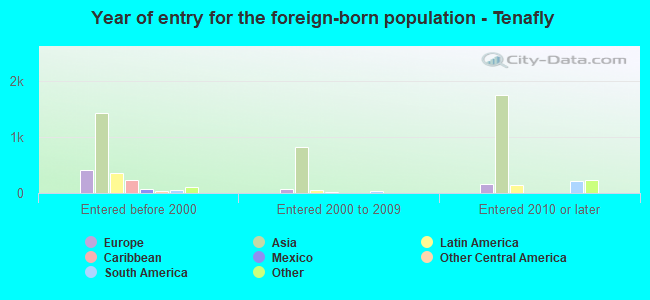
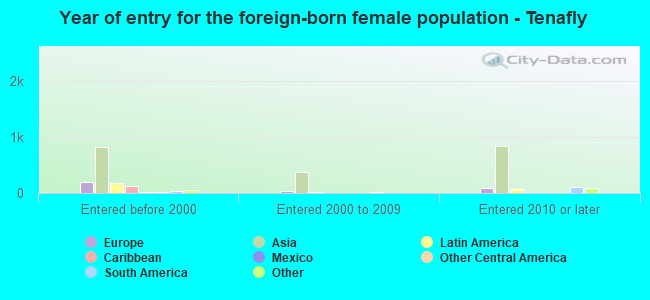
According to 2022 data, the most numerous races in Tenafly, NJ are White alone (8,680 residents), Hispanic (1,132 residents), and Black alone (125 residents). 54.7% of Tenafly residents speak English at home. 34.7% of Tenafly, NJ residents are foreign-born (23.9% born in Asia, 4.6% born in Europe, 3.5% born in Latin America), which is 33.7% greater than the foreign-born rate of 23.0% across the entire state of New Jersey.
Race distribution in Tenafly
2000 2022
5,557,209 66.0% White alone 1,117,191 13.3% Hispanic 1,096,171 13.0% Black alone 477,012 5.7% Asian alone 133,689 1.6% Two or more races 19,565 0.2% Other race alone 11,338 0.1% American Indian alone 2,175 0.03% Native Hawaiian and Other
4,766,476 51.5% White alone 2,028,470 21.9% Hispanic 1,111,632 12.0% Black alone 923,546 10.0% Asian alone 332,237 3.6% Two or more races 89,847 1.0% Other race alone 8,557 0.09% American Indian alone 934 0.01% Native Hawaiian and Other
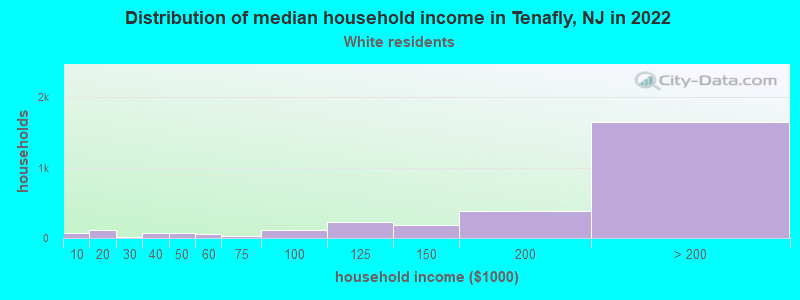
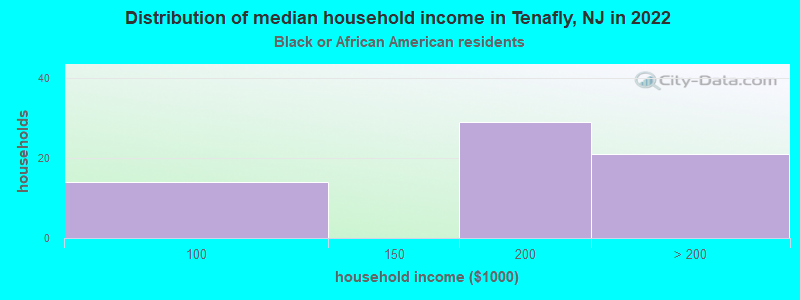
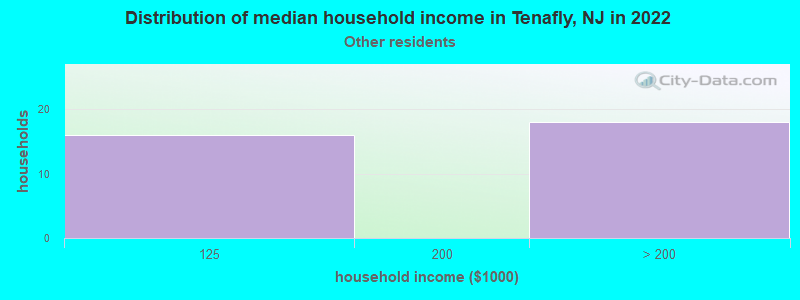
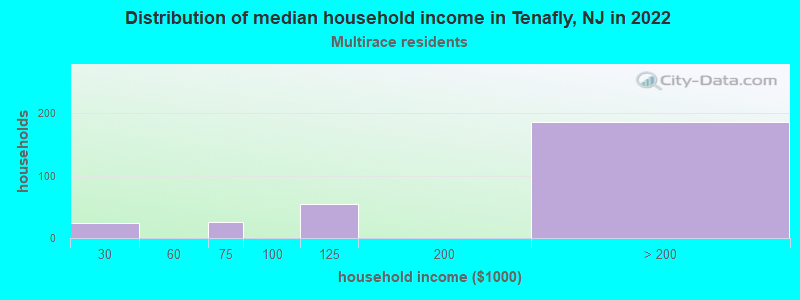
Income and house value in Tenafly Median household income in 2022 over $200,000 White non-Hispanic householders$188,059 Black householders$171,194 Asian householdersover $200,000 Two or more races householdersover $200,000 Hispanic or Latino race householdersMedian 2022 house value over $1,000,000 White Non-Hispanic householdersover $1,000,000 Black or African American householders $806,760 Asian householders$784,350 Some other race householdersover $1,000,000 Two or more races householders$684,750 Hispanic or Latino householders
Median age by race in Tenafly
45.4 Median age for White residents42.8 49.3 27.9 Median age for Black or African American residents29.8 16.8 -766,197,182.3 Median age for American Indian / Alaska Native residents-686,322,685.6 -753,722,794.2 41.0 Median age for Asian residents40.7 41.6 -510,460,250.5 Median age for Native Hawaiian / Pacific Islander residents-514,767,932.0 -713,070,378.3 34.4 Median age for Other race residents46.3 5.4 25.8 Median age for Two or more races residents33.6 17.4 44.5 Median age for White alone residents42.5 48.2 33.8 Median age for Hispanic or Latino residents36.1 18.1
Owner/renter occupied households by race in Tenafly
House owners and renters - White residents 2,594 84.1% Owner occupied491 15.9% Renter occupiedHouse owners and renters - Black or African American residents 47 73.8% Owner occupied17 26.2% Renter occupiedHouse owners and renters - Asian residents 853 56.7% Owner occupied652 43.3% Renter occupiedHouse owners and renters - Other race residents 39 100.0% Owner occupiedHouse owners and renters - Two or more races residents 183 67.9% Owner occupied87 32.1% Renter occupiedHouse owners and renters - White alone residents 2,607 82.7% Owner occupied546 17.3% Renter occupiedHouse owners and renters - Hispanic or Latino residents 267 85.3% Owner occupied46 14.7% Renter occupied
Language usage in Tenafly
English speakers - Total 54.7% of residents of Tenafly speak English at home.
5.9% of residents speak Spanish at home 797 91.3% Speak English very well76 8.7% Speak English less than very well38.5% of residents speak other language at home 3,971 69.5% Speak English very well1,743 30.5% Speak English less than very well
English speakers - Born in the United States 83.6% of residents of Tenafly speak English at home.
1.2% of residents speak Spanish at home 67 100.0% Speak English very well13.3% of residents speak other language at home 665 92.9% Speak English very well51 7.1% Speak English less than very well
English speakers - Native, born elsewhere 26.7% of residents of Tenafly speak English at home.
44.6% of residents speak other language at home 137 100.0% Speak English very well
English speakers - Foreign-born 13.4% of residents of Tenafly speak English at home.
7.6% of residents speak Spanish at home 326 81.3% Speak English very well75 18.7% Speak English less than very well77.5% of residents speak other language at home 2,530 62.1% Speak English very well1,546 37.9% Speak English less than very well
White (Caucasian) - Speak only English Native:
91.5% (6,323)Foreign-born:
14.9% (173)
White (Caucasian) - Speak another language Native:
8.9% (615)Foreign-born:
83.5% (969)
Black or African American - Speak only English Native:
73.0% (72)Foreign-born:
31.9% (31)
Black or African American - Speak another language Native:
27.2% (27)Foreign-born:
60.9% (59)
Asian - Speak only English Native:
39.4% (598)Foreign-born:
14.8% (463)
Asian - Speak another language Native:
60.3% (916)Foreign-born:
85.1% (2,669)
Two or more races - Speak only English Native:
37.3% (228)Foreign-born:
5.5% (27)
Two or more races - Speak another language Native:
65.4% (398)Foreign-born:
95.5% (464)
White alone - Speak only English Native:
89.1% (6,346)Foreign-born:
12.8% (177)
White alone - Speak another language Native:
10.7% (762)Foreign-born:
87.5% (1,206)
Hispanic or Latino - Speak only English Native:
34.0% (161)Foreign-born:
4.1% (22)
Hispanic or Latino - Speak another language Native:
67.0% (318)Foreign-born:
95.2% (508)
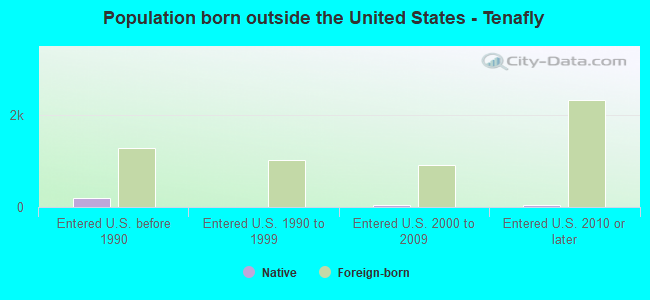
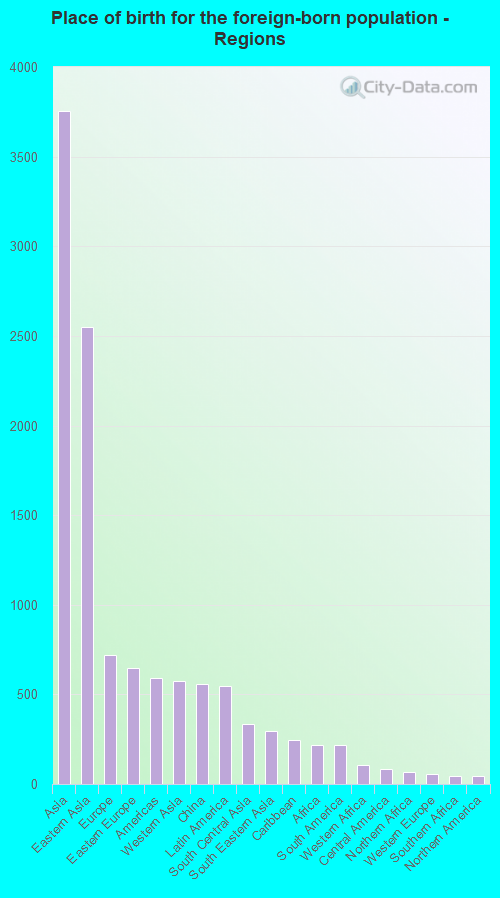
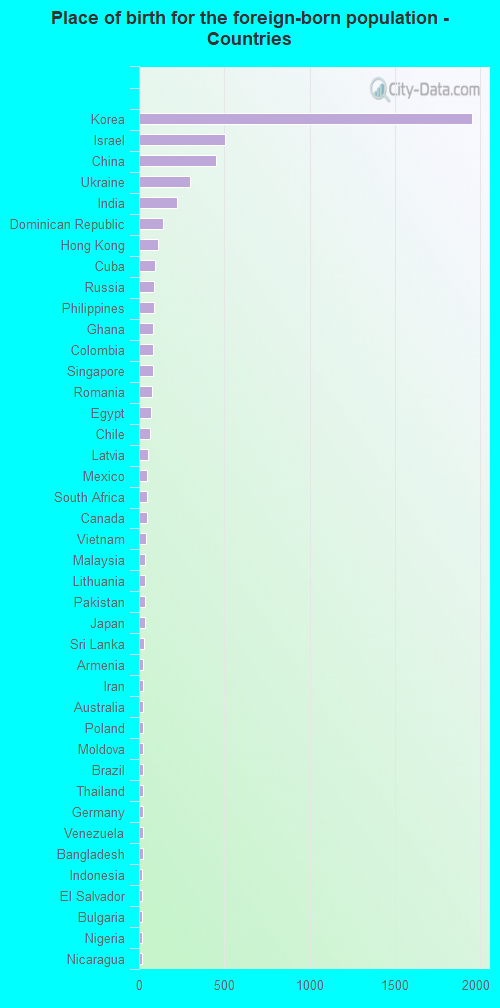
Foreign-born residents in Tenafly 5,309 residents are foreign born (23.9% Asia , 4.6% Europe , 3.5% Latin America ).
This city:
34.7%New Jersey:
23.2%
Marital status for residents in Tenafly Marital status - White (Caucasian) population 15 years and over
Males 29.8% Never married62.2% Now married0.7% Separated2.9% Widowed4.4% DivorcedFemales 16.3% Never married63.9% Now married0.5% Separated10.2% Widowed9.1% DivorcedWomen who gave birth in the past 12 months Now married:
100.0% (24)Unmarried:
0.0% (0)
Women who did not give birth in the past 12 months Now married:
64.3% (805)Unmarried:
35.7% (446)
Marital status - Black or African American population 15 years and over
Males 47.5% Never married27.7% Now married0.0% Separated0.0% Widowed24.8% DivorcedFemales 59.3% Never married40.7% Now married0.0% Separated0.0% Widowed0.0% DivorcedWomen who did not give birth in the past 12 months Now married:
50.0% (23)Unmarried:
50.0% (23)
Marital status - Asian population 15 years and over
Males 18.7% Never married81.3% Now married0.0% Separated0.0% Widowed0.0% DivorcedFemales 11.6% Never married83.7% Now married0.3% Separated3.0% Widowed1.4% DivorcedWomen who gave birth in the past 12 months Now married:
100.0% (36)Unmarried:
0.0% (0)
Women who did not give birth in the past 12 months Now married:
81.2% (893)Unmarried:
18.8% (206)
Marital status - Other race population 15 years and over
Males 0.0% Never married100.0% Now married0.0% Separated0.0% Widowed0.0% DivorcedFemales 0.0% Never married100.0% Now married0.0% Separated0.0% Widowed0.0% DivorcedWomen who did not give birth in the past 12 months Now married:
100.0% (19)Unmarried:
0.0% (0)
Marital status - Two or more races population 15 years and over
Males 23.7% Never married59.4% Now married12.1% Separated4.8% Widowed0.0% DivorcedFemales 24.0% Never married69.2% Now married0.0% Separated0.0% Widowed6.8% DivorcedWomen who did not give birth in the past 12 months Now married:
66.7% (155)Unmarried:
33.3% (77)
Marital status - White alone, not Hispanic / Latino population 15 years and over
Males 30.2% Never married62.2% Now married0.8% Separated2.9% Widowed3.9% DivorcedFemales 16.2% Never married63.9% Now married0.0% Separated10.6% Widowed9.4% DivorcedWomen who gave birth in the past 12 months Now married:
100.0% (28)Unmarried:
0.0% (0)
Women who did not give birth in the past 12 months Now married:
63.6% (867)Unmarried:
36.4% (495)
Marital status - Hispanic or Latino population 15 years and over
Males 11.4% Never married69.1% Now married8.4% Separated3.4% Widowed7.7% DivorcedFemales 14.1% Never married80.5% Now married5.4% Separated0.0% Widowed0.0% DivorcedWomen who did not give birth in the past 12 months Now married:
83.0% (214)Unmarried:
17.0% (44)
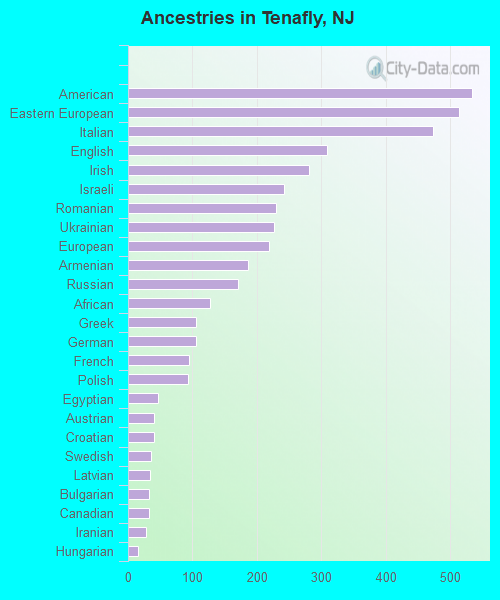
Ancestries in Tenafly
534 5.5% American514 5.3% Eastern European473 4.9% Italian309 3.2% English281 2.9% Irish242 2.5% Israeli230 2.4% Romanian226 2.3% Ukrainian219 2.3% European186 1.9% Armenian171 1.8% Russian128 1.3% African106 1.1% Greek105 1.1% German95 1.0% French93 1.0% Polish46 0.5% Egyptian41 0.4% Austrian41 0.4% Croatian35 0.4% Swedish34 0.4% Latvian33 0.3% Bulgarian33 0.3% Canadian28 0.3% Iranian15 0.2% Hungarian13 0.1% Scotch-Irish12 0.1% Dutch11 0.1% Nigerian11 0.1% Jamaican10 0.1% Guyanese6 0.06% French Canadian3 0.03% Moroccan
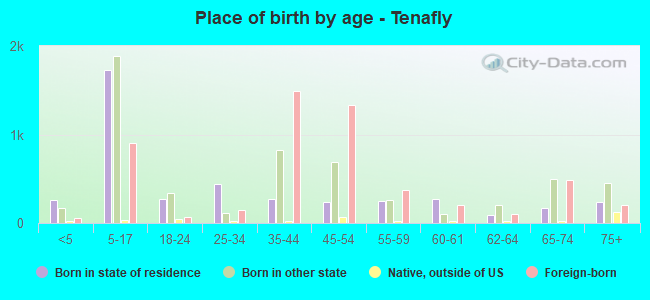
Children Nativity (place of birth) in Tenafly
Children under 6 years - Living with two parents Both parents native 340 100.0% NativeBoth parents foreign-born 276 79.3% Native72 20.7% Foreign-bornOne native, one foreign-born parent 102 100.0% NativeChildren 6 to 17 years - Living with two parents Both parents native 1,432 96.9% Native46 3.1% Foreign-bornBoth parents foreign-born 1,163 66.2% Native594 33.8% Foreign-bornOne native, one foreign-born parent 346 100.0% NativeChildren 6 to 17 years - Living with one parent Native parent 29 15.8% Native157 84.2% Foreign-bornForeign-born parent 248 88.7% Native32 11.3% Foreign-born