Races in Texas City, Texas (TX) Detailed Stats
Data:
Races - White alone (%)
Races - White alone (% change since 2000)
Races - Black alone (%)
Races - Black alone (% change since 2000)
Races - American Indian alone (%)
Races - American Indian alone (% change since 2000)
Races - Asian alone (%)
Races - Asian alone (% change since 2000)
Races - Hispanic (%)
Races - Hispanic (% change since 2000)
Races - Native Hawaiian and Other Pacific Islander alone (%)
Races - Native Hawaiian and Other Pacific Islander alone (% change since 2000)
Races - Two or more races(%)
Races - Two or more races(% change since 2000)
Races - Other race alone (%)
Races - Other race alone (% change since 2000)
Racial diversity
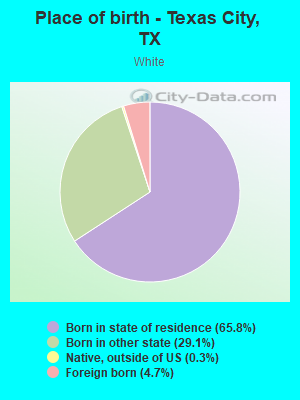
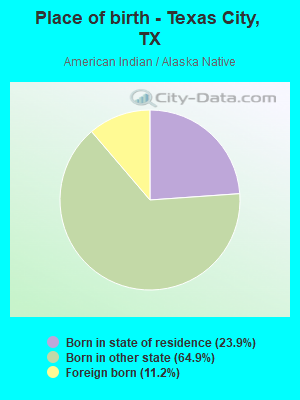
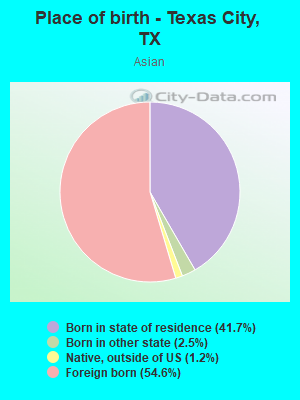
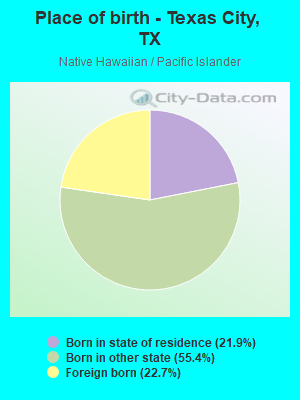
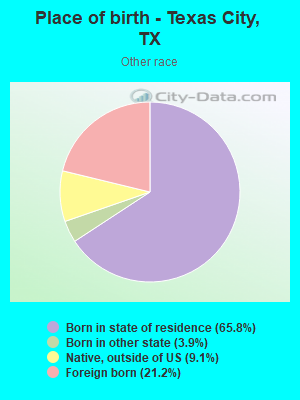
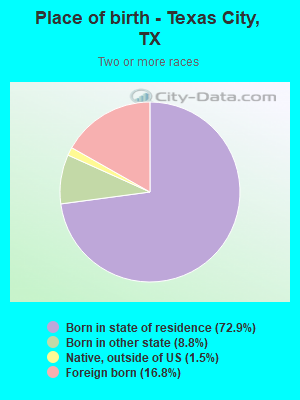
Place of birth - Born in state of residence (%)
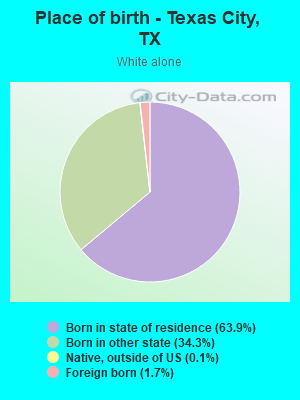
Place of birth - Born in state of residence (%) - White
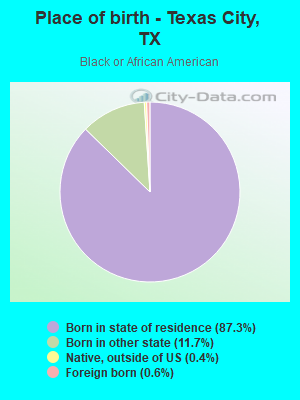
Place of birth - Born in state of residence (%) - Black or African American
Place of birth - Born in state of residence (%) - Asian
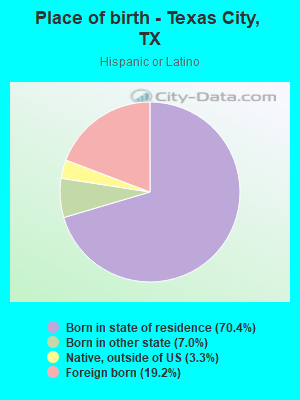
Place of birth - Born in state of residence (%) - Hispanic or Latino
Place of birth - Born in state of residence (%) - American Indian and Alaska Native
Place of birth - Born in state of residence (%) - Multirace
Place of birth - Born in state of residence (%) - Other Race
Place of birth - Born in other state (%)
Place of birth - Born in other state (%) - White
Place of birth - Born in other state (%) - Black or African American
Place of birth - Born in other state (%) - Asian
Place of birth - Born in other state (%) - Hispanic or Latino
Place of birth - Born in other state (%) - American Indian and Alaska Native
Place of birth - Born in other state (%) - Multirace
Place of birth - Born in other state (%) - Other Race
Place of birth - Native, outside of US (%)
Place of birth - Native, outside of US (%) - White
Place of birth - Native, outside of US (%) - Black or African American
Place of birth - Native, outside of US (%) - Asian
Place of birth - Native, outside of US (%) - Hispanic or Latino
Place of birth - Native, outside of US (%) - American Indian and Alaska Native
Place of birth - Native, outside of US (%) - Multirace
Place of birth - Native, outside of US (%) - Other Race
Place of birth - Foreign born (%)
Place of birth - Foreign born (%) - White
Place of birth - Foreign born (%) - Black or African American
Place of birth - Foreign born (%) - Asian
Place of birth - Foreign born (%) - Hispanic or Latino
Place of birth - Foreign born (%) - American Indian and Alaska Native
Place of birth - Foreign born (%) - Multirace
Place of birth - Foreign born (%) - Other Race
Residents speaking English at home (%)
Residents speaking English at home - Born in the United States (%)
Residents speaking English at home - Native, born elsewhere (%)
Residents speaking English at home - Foreign born (%)
Residents speaking Spanish at home (%)
Residents speaking Spanish at home - Born in the United States (%)
Residents speaking Spanish at home - Native, born elsewhere (%)
Residents speaking Spanish at home - Foreign born (%)
Residents speaking other language at home (%)
Residents speaking other language at home - Born in the United States (%)
Residents speaking other language at home - Native, born elsewhere (%)
Residents speaking other language at home - Foreign born (%)
Marital status - Never married (%)
Marital status - Now married (%)
Marital status - Separated (%)
Marital status - Widowed (%)
Marital status - Divorced (%)
Ancestries Reported - Arab (%)
Ancestries Reported - Czech (%)
Ancestries Reported - Danish (%)
Ancestries Reported - Dutch (%)
Ancestries Reported - English (%)
Ancestries Reported - French (%)
Ancestries Reported - French Canadian (%)
Ancestries Reported - German (%)
Ancestries Reported - Greek (%)
Ancestries Reported - Hungarian (%)
Ancestries Reported - Irish (%)
Ancestries Reported - Italian (%)
Ancestries Reported - Lithuanian (%)
Ancestries Reported - Norwegian (%)
Ancestries Reported - Polish (%)
Ancestries Reported - Portuguese (%)
Ancestries Reported - Russian (%)
Ancestries Reported - Scotch-Irish (%)
Ancestries Reported - Scottish (%)
Ancestries Reported - Slovak (%)
Ancestries Reported - Subsaharan African (%)
Ancestries Reported - Swedish (%)
Ancestries Reported - Swiss (%)
Ancestries Reported - Ukrainian (%)
Ancestries Reported - United States (%)
Ancestries Reported - Welsh (%)
Ancestries Reported - West Indian (%)
Ancestries Reported - Other (%)
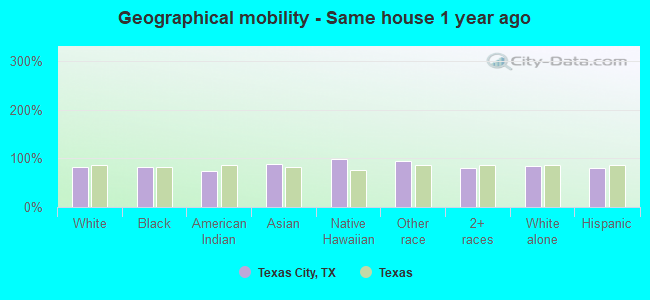
Geographical mobility - Same house 1 year ago (%)
Geographical mobility - Same house 1 year ago (%) - White
Geographical mobility - Same house 1 year ago (%) - Black or African American
Geographical mobility - Same house 1 year ago (%) - Asian
Geographical mobility - Same house 1 year ago (%) - Hispanic or Latino
Geographical mobility - Same house 1 year ago (%) - American Indian and Alaska Native
Geographical mobility - Same house 1 year ago (%) - Multirace
Geographical mobility - Same house 1 year ago (%) - Other Race
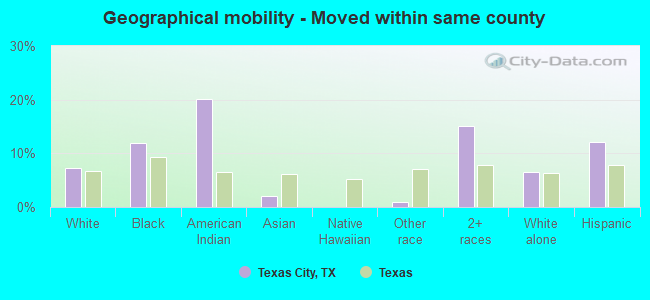
Geographical mobility - Moved within same county (%)
Geographical mobility - Moved within same county (%) - White
Geographical mobility - Moved within same county (%) - Black or African American
Geographical mobility - Moved within same county (%) - Asian
Geographical mobility - Moved within same county (%) - Hispanic or Latino
Geographical mobility - Moved within same county (%) - American Indian and Alaska Native
Geographical mobility - Moved within same county (%) - Multirace
Geographical mobility - Moved within same county (%) - Other Race
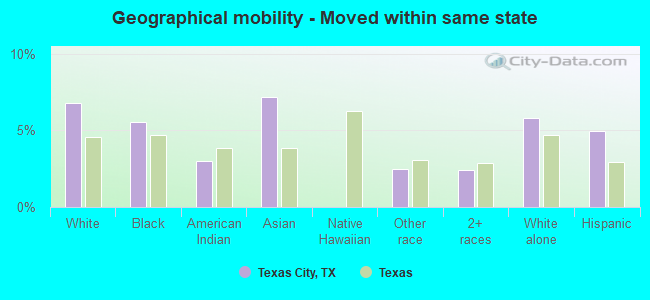
Geographical mobility - Moved from different county within same state (%)
Geographical mobility - Moved from different county within same state (%) - White
Geographical mobility - Moved from different county within same state (%) - Black or African American
Geographical mobility - Moved from different county within same state (%) - Asian
Geographical mobility - Moved from different county within same state (%) - Hispanic or Latino
Geographical mobility - Moved from different county within same state (%) - American Indian and Alaska Native
Geographical mobility - Moved from different county within same state (%) - Multirace
Geographical mobility - Moved from different county within same state (%) - Other Race
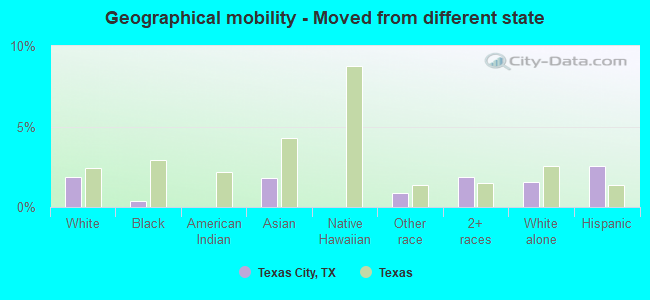
Geographical mobility - Moved from different state (%)
Geographical mobility - Moved from different state (%) - White
Geographical mobility - Moved from different state (%) - Black or African American
Geographical mobility - Moved from different state (%) - Asian
Geographical mobility - Moved from different state (%) - Hispanic or Latino
Geographical mobility - Moved from different state (%) - American Indian and Alaska Native
Geographical mobility - Moved from different state (%) - Multirace
Geographical mobility - Moved from different state (%) - Other Race
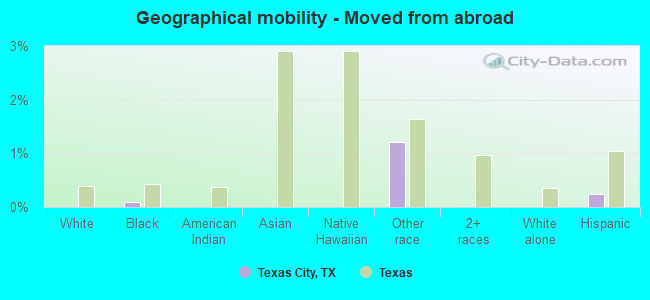
Geographical mobility - Moved from abroad (%)
Geographical mobility - Moved from abroad (%) - White
Geographical mobility - Moved from abroad (%) - Black or African American
Geographical mobility - Moved from abroad (%) - Asian
Geographical mobility - Moved from abroad (%) - Hispanic or Latino
Geographical mobility - Moved from abroad (%) - American Indian and Alaska Native
Geographical mobility - Moved from abroad (%) - Multirace
Geographical mobility - Moved from abroad (%) - Other Race
Place of birth for the foreign-born population - Ireland (%)
Place of birth for the foreign-born population - Denmark (%)
Place of birth for the foreign-born population - Norway (%)
Place of birth for the foreign-born population - Sweden (%)
Place of birth for the foreign-born population - United Kingdom (%)
Place of birth for the foreign-born population - England (%)
Place of birth for the foreign-born population - Scotland (%)
Place of birth for the foreign-born population - Other Northern Europe (%)
Place of birth for the foreign-born population - Austria (%)
Place of birth for the foreign-born population - Belgium (%)
Place of birth for the foreign-born population - France (%)
Place of birth for the foreign-born population - Germany (%)
Place of birth for the foreign-born population - Netherlands (%)
Place of birth for the foreign-born population - Switzerland (%)
Place of birth for the foreign-born population - Other Western Europe (%)
Place of birth for the foreign-born population - Greece (%)
Place of birth for the foreign-born population - Italy (%)
Place of birth for the foreign-born population - Portugal (%)
Place of birth for the foreign-born population - Spain (%)
Place of birth for the foreign-born population - Other Southern Europe (%)
Place of birth for the foreign-born population - Albania (%)
Place of birth for the foreign-born population - Belarus (%)
Place of birth for the foreign-born population - Bosnia and Herzegovina (%)
Place of birth for the foreign-born population - Bulgaria (%)
Place of birth for the foreign-born population - Croatia (%)
Place of birth for the foreign-born population - Czechoslovakia (%)
Place of birth for the foreign-born population - Hungary (%)
Place of birth for the foreign-born population - Latvia (%)
Place of birth for the foreign-born population - Lithuania (%)
Place of birth for the foreign-born population - North Macedonia (Macedonia) (%)
Place of birth for the foreign-born population - Moldova (%)
Place of birth for the foreign-born population - Poland (%)
Place of birth for the foreign-born population - Romania (%)
Place of birth for the foreign-born population - Russia (%)
Place of birth for the foreign-born population - Serbia (%)
Place of birth for the foreign-born population - Ukraine (%)
Place of birth for the foreign-born population - Other Eastern Europe (%)
Place of birth for the foreign-born population - China (%)
Place of birth for the foreign-born population - Hong Kong (%)
Place of birth for the foreign-born population - Taiwan (%)
Place of birth for the foreign-born population - Japan (%)
Place of birth for the foreign-born population - Korea (%)
Place of birth for the foreign-born population - Other Eastern Asia (%)
Place of birth for the foreign-born population - Afghanistan (%)
Place of birth for the foreign-born population - Bangladesh (%)
Place of birth for the foreign-born population - India (%)
Place of birth for the foreign-born population - Iran (%)
Place of birth for the foreign-born population - Kazakhstan (%)
Place of birth for the foreign-born population - Nepal (%)
Place of birth for the foreign-born population - Pakistan (%)
Place of birth for the foreign-born population - Sri Lanka (%)
Place of birth for the foreign-born population - Uzbekistan (%)
Place of birth for the foreign-born population - Other South Central Asia (%)
Place of birth for the foreign-born population - Burma (%)
Place of birth for the foreign-born population - Cambodia (%)
Place of birth for the foreign-born population - Indonesia (%)
Place of birth for the foreign-born population - Laos (%)
Place of birth for the foreign-born population - Malaysia (%)
Place of birth for the foreign-born population - Philippines (%)
Place of birth for the foreign-born population - Singapore (%)
Place of birth for the foreign-born population - Thailand (%)
Place of birth for the foreign-born population - Vietnam (%)
Place of birth for the foreign-born population - Other South Eastern Asia (%)
Place of birth for the foreign-born population - Armenia (%)
Place of birth for the foreign-born population - Iraq (%)
Place of birth for the foreign-born population - Israel (%)
Place of birth for the foreign-born population - Jordan (%)
Place of birth for the foreign-born population - Kuwait (%)
Place of birth for the foreign-born population - Lebanon (%)
Place of birth for the foreign-born population - Saudi Arabia (%)
Place of birth for the foreign-born population - Syria (%)
Place of birth for the foreign-born population - Turkey (%)
Place of birth for the foreign-born population - Yemen (%)
Place of birth for the foreign-born population - Other Western Asia (%)
Place of birth for the foreign-born population - Eritrea (%)
Place of birth for the foreign-born population - Ethiopia (%)
Place of birth for the foreign-born population - Kenya (%)
Place of birth for the foreign-born population - Somalia (%)
Place of birth for the foreign-born population - Uganda (%)
Place of birth for the foreign-born population - Zimbabwe (%)
Place of birth for the foreign-born population - Other Eastern Africa (%)
Place of birth for the foreign-born population - Cameroon (%)
Place of birth for the foreign-born population - Congo (%)
Place of birth for the foreign-born population - Democratic Republic of Congo (Zaire) (%)
Place of birth for the foreign-born population - Other Middle Africa (%)
Place of birth for the foreign-born population - Egypt (%)
Place of birth for the foreign-born population - Morocco (%)
Place of birth for the foreign-born population - Sudan (%)
Place of birth for the foreign-born population - Other Northern Africa (%)
Place of birth for the foreign-born population - South Africa (%)
Place of birth for the foreign-born population - Other Southern Africa (%)
Place of birth for the foreign-born population - Cabo Verde (%)
Place of birth for the foreign-born population - Ghana (%)
Place of birth for the foreign-born population - Liberia (%)
Place of birth for the foreign-born population - Nigeria (%)
Place of birth for the foreign-born population - Senegal (%)
Place of birth for the foreign-born population - Sierra Leone (%)
Place of birth for the foreign-born population - Other Western Africa (%)
Place of birth for the foreign-born population - Australia (%)
Place of birth for the foreign-born population - New Zealand (%)
Place of birth for the foreign-born population - Fiji (%)
Place of birth for the foreign-born population - Micronesia (%)
Place of birth for the foreign-born population - Bahamas (%)
Place of birth for the foreign-born population - Barbados (%)
Place of birth for the foreign-born population - Cuba (%)
Place of birth for the foreign-born population - Dominica (%)
Place of birth for the foreign-born population - Dominican Republic (%)
Place of birth for the foreign-born population - Grenada (%)
Place of birth for the foreign-born population - Haiti (%)
Place of birth for the foreign-born population - Jamaica (%)
Place of birth for the foreign-born population - St. Vincent and the Grenadines (%)
Place of birth for the foreign-born population - Trinidad and Tobago (%)
Place of birth for the foreign-born population - West Indies (%)
Place of birth for the foreign-born population - Other Caribbean (%)
Place of birth for the foreign-born population - Belize (%)
Place of birth for the foreign-born population - Costa Rica (%)
Place of birth for the foreign-born population - El Salvador (%)
Place of birth for the foreign-born population - Guatemala (%)
Place of birth for the foreign-born population - Honduras (%)
Place of birth for the foreign-born population - Mexico (%)
Place of birth for the foreign-born population - Nicaragua (%)
Place of birth for the foreign-born population - Panama (%)
Place of birth for the foreign-born population - Other Central America (%)
Place of birth for the foreign-born population - Argentina (%)
Place of birth for the foreign-born population - Bolivia (%)
Place of birth for the foreign-born population - Brazil (%)
Place of birth for the foreign-born population - Chile (%)
Place of birth for the foreign-born population - Colombia (%)
Place of birth for the foreign-born population - Ecuador (%)
Place of birth for the foreign-born population - Guyana (%)
Place of birth for the foreign-born population - Peru (%)
Place of birth for the foreign-born population - Uruguay (%)
Place of birth for the foreign-born population - Venezuela (%)
Place of birth for the foreign-born population - Other South America (%)
Place of birth for the foreign-born population - Canada (%)
Place of birth for the foreign-born population - Other Northern America (%)
Place of birth for the foreign-born population - Other (%)
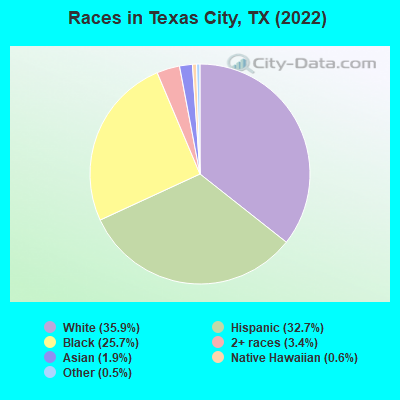
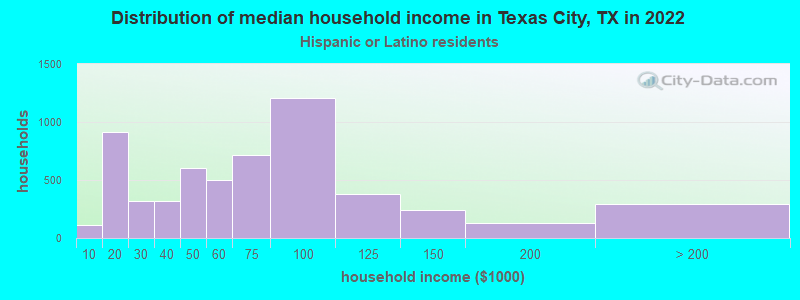
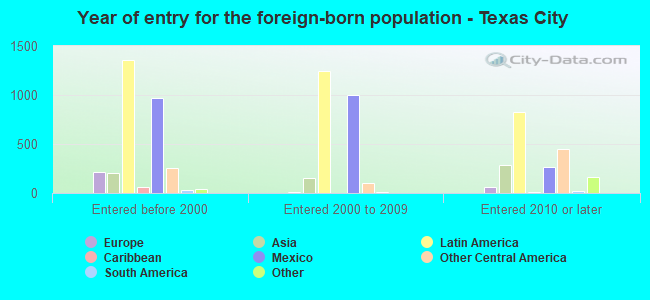
According to 2022 data, the most numerous races in Texas City, TX are Hispanic (17,659 residents), White alone (19,427 residents), and Black alone (13,878 residents). 76.7% of Texas City residents speak English at home. 7.7% of Texas City, TX residents are foreign-born (5.6% born in Latin America, 1.1% born in Asia), which is 120.0% less than the foreign-born rate of 17.0% across the entire state of Texas.
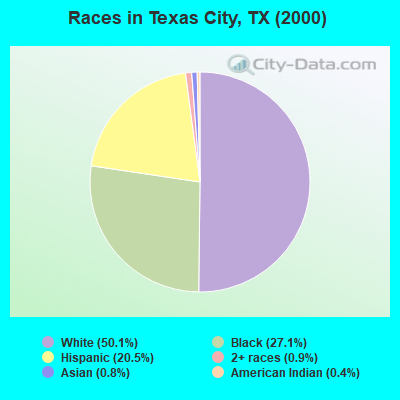
Race distribution in Texas City
2000 2022
10,933,313 52.4% White alone 6,669,666 32.0% Hispanic 2,364,255 11.3% Black alone 554,445 2.7% Asian alone 230,567 1.1% Two or more races 68,859 0.3% American Indian alone 19,958 0.10% Other race alone 10,757 0.05% Native Hawaiian and Other
12,070,642 40.2% Hispanic 11,683,430 38.9% White alone 3,508,706 11.7% Black alone 1,608,173 5.4% Asian alone 956,560 3.2% Two or more races 125,763 0.4% Other race alone 47,023 0.2% American Indian alone 29,275 0.10% Native Hawaiian and Other
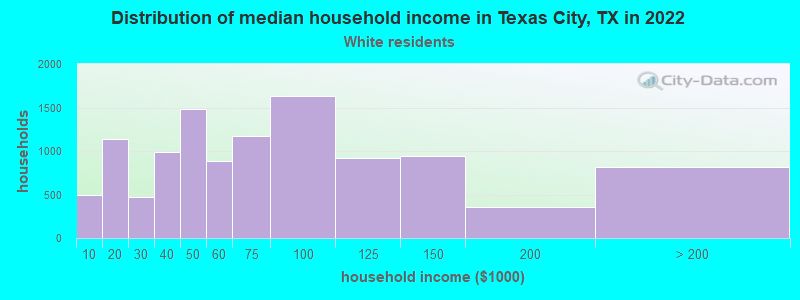
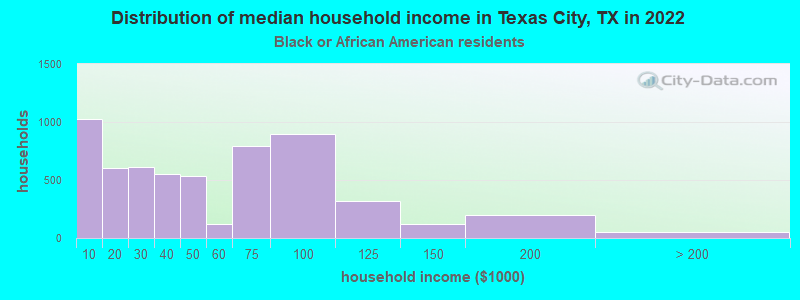
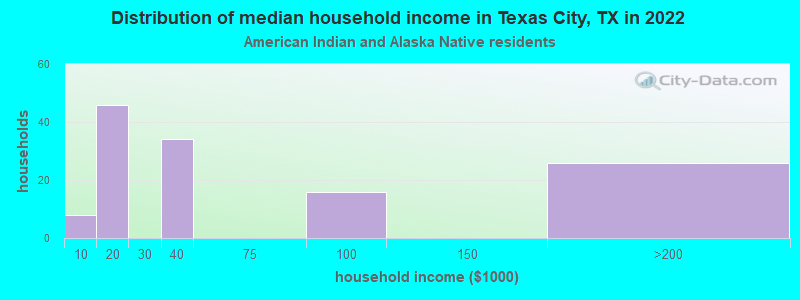
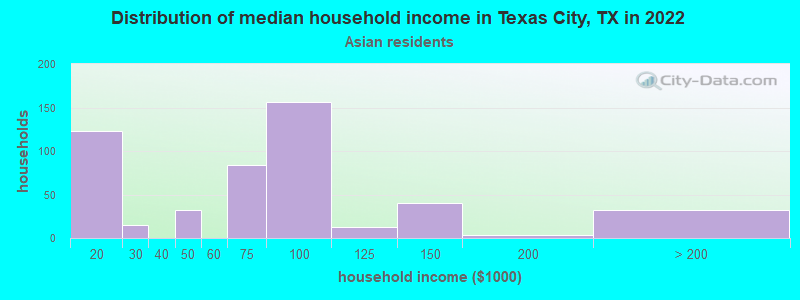
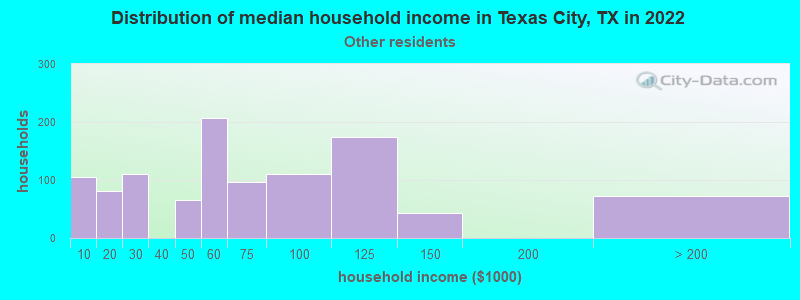
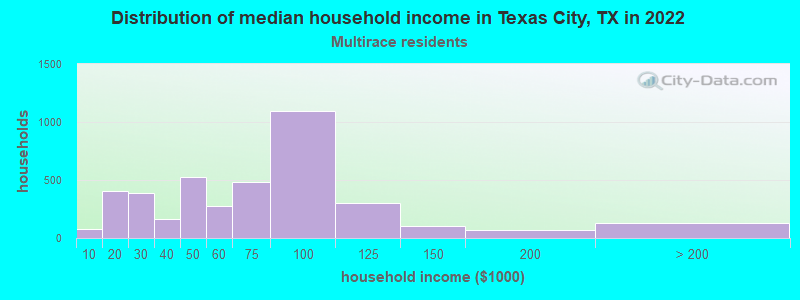
Income and house value in Texas City Median household income in 2022 $65,967 White non-Hispanic householders$45,487 Black householders$62,058 Asian householders$65,181 Some other race householders$63,681 Two or more races householders$58,541 Hispanic or Latino race householdersMedian 2022 house value $205,290 White Non-Hispanic householders$163,333 Black or African American householders$212,183 American Indian or Alaska Native householders $335,058 Asian householders$134,263 Some other race householders$124,073 Two or more races householders$157,039 Hispanic or Latino householders
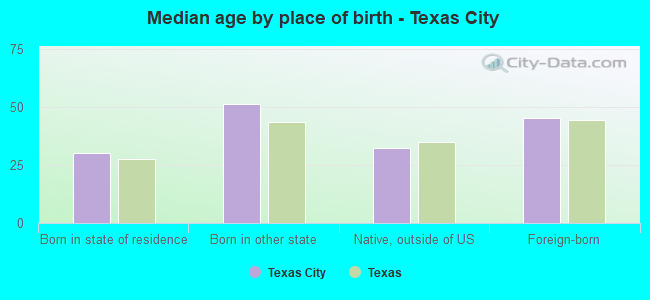
Median age by race in Texas City
41.2 Median age for White residents39.2 42.6 31.0 Median age for Black or African American residents26.6 37.7 50.5 Median age for American Indian / Alaska Native residents29.9 51.0 50.6 Median age for Asian residents42.6 56.1 20.2 Median age for Native Hawaiian / Pacific Islander residents3.4 -577,777,777.2 35.7 Median age for Other race residents34.9 33.9 30.9 Median age for Two or more races residents29.7 33.4 45.0 Median age for White alone residents46.3 44.8 31.7 Median age for Hispanic or Latino residents31.4 32.7
Owner/renter occupied households by race in Texas City
House owners and renters - White residents 6,591 61.1% Owner occupied4,197 38.9% Renter occupiedHouse owners and renters - Black or African American residents 2,001 34.0% Owner occupied3,890 66.0% Renter occupiedHouse owners and renters - American Indian / Alaska Native residents 112 80.5% Owner occupied27 19.5% Renter occupiedHouse owners and renters - Asian residents 267 52.4% Owner occupied242 47.6% Renter occupiedHouse owners and renters - Native Hawaiian / Pacific Islander residents 105 100.0% Renter occupiedHouse owners and renters - Other race residents 1,159 79.8% Owner occupied293 20.2% Renter occupiedHouse owners and renters - Two or more races residents 2,580 71.0% Owner occupied1,052 29.0% Renter occupiedHouse owners and renters - White alone residents 5,807 63.6% Owner occupied3,322 36.4% Renter occupiedHouse owners and renters - Hispanic or Latino residents 3,756 65.7% Owner occupied1,957 34.3% Renter occupied
Language usage in Texas City
English speakers - Total 76.7% of residents of Texas City speak English at home.
21.2% of residents speak Spanish at home 7,079 66.4% Speak English very well3,581 33.6% Speak English less than very well2.4% of residents speak other language at home 409 33.8% Speak English very well800 66.2% Speak English less than very well
English speakers - Born in the United States 91.0% of residents of Texas City speak English at home.
8.6% of residents speak Spanish at home 683 79.6% Speak English very well175 20.4% Speak English less than very well1.0% of residents speak other language at home 95 100.0% Speak English very well
English speakers - Native, born elsewhere 21.7% of residents of Texas City speak English at home.
108.6% of residents speak Spanish at home 205 34.4% Speak English very well391 65.6% Speak English less than very well0.7% of residents speak other language at home 4 100.0% Speak English very well
English speakers - Foreign-born 14.0% of residents of Texas City speak English at home.
67.3% of residents speak Spanish at home 933 30.6% Speak English very well2,117 69.4% Speak English less than very well18.7% of residents speak other language at home 302 35.5% Speak English very well548 64.5% Speak English less than very well
White (Caucasian) - Speak only English Native:
91.5% (19,994)Foreign-born:
26.0% (297)
White (Caucasian) - Speak another language Native:
7.1% (1,559)Foreign-born:
63.8% (729)
Black or African American - Speak only English Native:
97.0% (12,782)Foreign-born:
66.1% (57)
Black or African American - Speak another language Native:
3.2% (418)Foreign-born:
11.8% (10)
American Indian / Alaska Native - Speak another language Native:
63.7% (95)Foreign-born:
98.9% (13)
Asian - Speak only English Native:
49.7% (215)Foreign-born:
10.9% (63)
Asian - Speak another language Native:
50.5% (219)Foreign-born:
89.3% (516)
Native Hawaiian / Pacific Islander - Speak another language Native:
83.5% (90)Foreign-born:
100.0% (99)
Other race - Speak only English Native:
31.1% (1,038)Foreign-born:
24.9% (245)
Other race - Speak another language Native:
66.5% (2,220)Foreign-born:
75.6% (743)
Two or more races - Speak only English Native:
55.2% (4,834)Foreign-born:
4.1% (82)
Two or more races - Speak another language Native:
45.9% (4,016)Foreign-born:
96.8% (1,925)
White alone - Speak only English Native:
98.5% (17,820)Foreign-born:
37.2% (125)
White alone - Speak another language Native:
1.6% (292)Foreign-born:
63.1% (213)
Hispanic or Latino - Speak only English Native:
48.0% (6,223)Foreign-born:
10.6% (357)
Hispanic or Latino - Speak another language Native:
52.3% (6,782)Foreign-born:
89.4% (3,014)
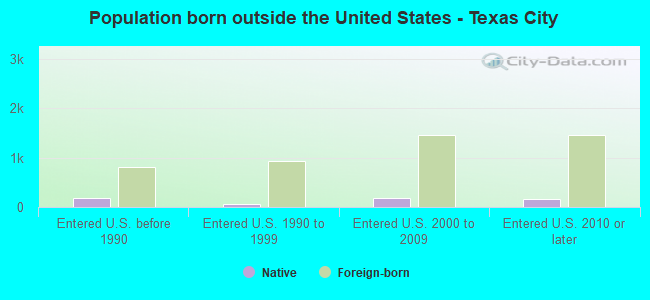
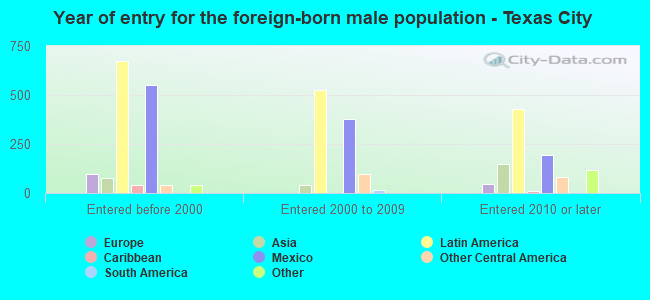
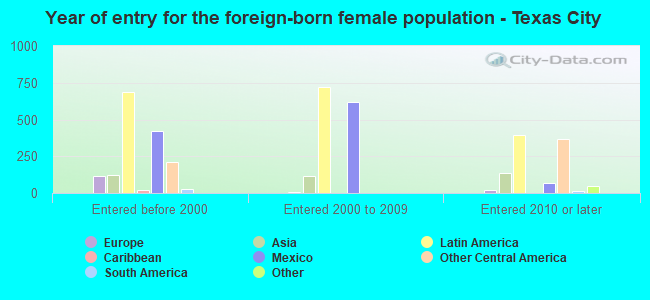
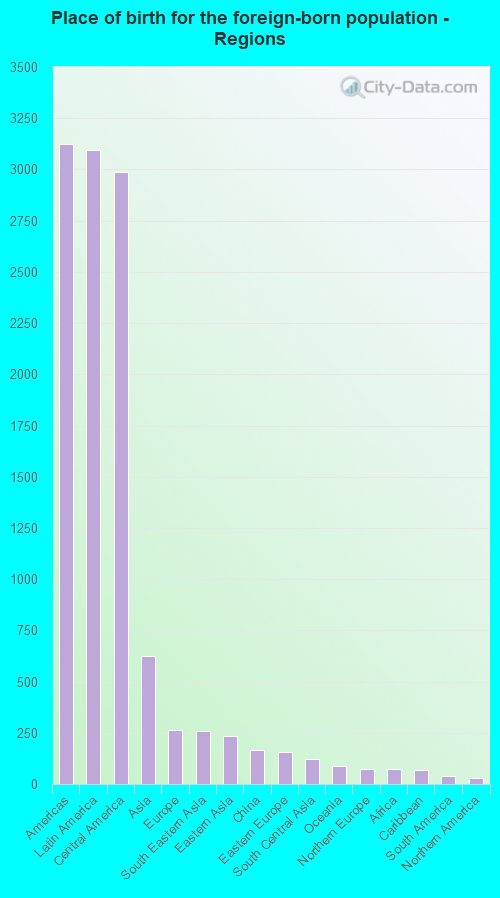
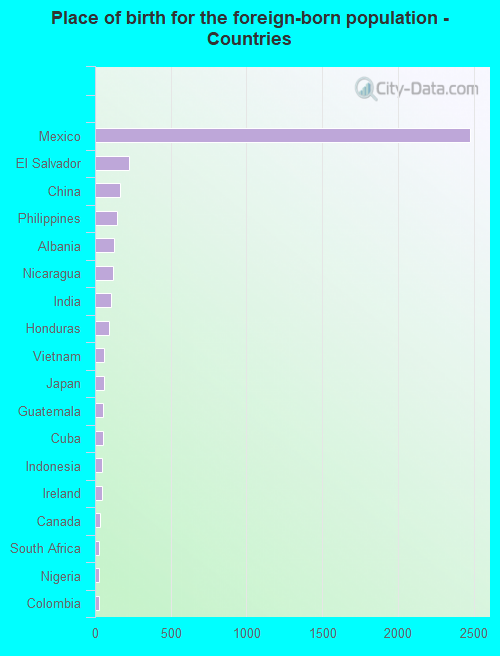
Foreign-born residents in Texas City 4,176 residents are foreign born (5.6% Latin America , 1.1% Asia ).
This city:
7.7%Texas:
17.1%
Marital status for residents in Texas City Marital status - White (Caucasian) population 15 years and over
Males 31.6% Never married50.1% Now married1.3% Separated4.2% Widowed12.8% DivorcedFemales 28.1% Never married44.5% Now married3.2% Separated8.4% Widowed15.8% DivorcedWomen who gave birth in the past 12 months Now married:
87.3% (284)Unmarried:
12.7% (41)
Women who did not give birth in the past 12 months Now married:
41.8% (2,533)Unmarried:
58.2% (3,534)
Marital status - Black or African American population 15 years and over
Males 43.3% Never married38.3% Now married1.2% Separated1.0% Widowed16.2% DivorcedFemales 42.1% Never married26.9% Now married2.5% Separated10.5% Widowed18.0% DivorcedWomen who gave birth in the past 12 months Now married:
29.3% (72)Unmarried:
70.7% (173)
Women who did not give birth in the past 12 months Now married:
29.6% (946)Unmarried:
70.4% (2,253)
Marital status - American Indian / Alaska Native population 15 years and over
Males 0.0% Never married53.7% Now married0.0% Separated0.0% Widowed46.3% DivorcedFemales 25.4% Never married63.5% Now married0.0% Separated0.0% Widowed11.1% DivorcedWomen who did not give birth in the past 12 months Now married:
66.7% (46)Unmarried:
33.3% (23)
Marital status - Asian population 15 years and over
Males 12.3% Never married87.7% Now married0.0% Separated0.0% Widowed0.0% DivorcedFemales 20.7% Never married59.1% Now married0.0% Separated11.7% Widowed8.6% DivorcedWomen who did not give birth in the past 12 months Now married:
45.1% (110)Unmarried:
54.9% (133)
Marital status - Native Hawaiian / Pacific Islander population 15 years and over
Males 0.0% Never married100.0% Now married0.0% Separated0.0% Widowed0.0% DivorcedFemales 0.0% Never married100.0% Now married0.0% Separated0.0% Widowed0.0% DivorcedWomen who did not give birth in the past 12 months Now married:
100.0% (81)Unmarried:
0.0% (0)
Marital status - Other race population 15 years and over
Males 31.5% Never married47.8% Now married0.7% Separated9.9% Widowed10.1% DivorcedFemales 32.1% Never married52.6% Now married1.8% Separated8.9% Widowed4.6% DivorcedWomen who gave birth in the past 12 months Now married:
71.0% (217)Unmarried:
29.0% (88)
Women who did not give birth in the past 12 months Now married:
51.5% (404)Unmarried:
48.5% (379)
Marital status - Two or more races population 15 years and over
Males 34.3% Never married48.4% Now married1.2% Separated1.3% Widowed14.8% DivorcedFemales 25.5% Never married45.7% Now married0.6% Separated3.9% Widowed24.2% DivorcedWomen who did not give birth in the past 12 months Now married:
47.0% (1,125)Unmarried:
53.0% (1,269)
Marital status - White alone, not Hispanic / Latino population 15 years and over
Males 25.4% Never married52.6% Now married1.4% Separated5.2% Widowed15.4% DivorcedFemales 25.7% Never married48.1% Now married2.2% Separated7.9% Widowed16.1% DivorcedWomen who gave birth in the past 12 months Now married:
88.7% (202)Unmarried:
11.3% (26)
Women who did not give birth in the past 12 months Now married:
43.9% (2,118)Unmarried:
56.1% (2,702)
Marital status - Hispanic or Latino population 15 years and over
Males 40.2% Never married46.8% Now married0.7% Separated2.8% Widowed9.5% DivorcedFemales 30.8% Never married42.5% Now married3.5% Separated7.4% Widowed15.8% DivorcedWomen who gave birth in the past 12 months Now married:
77.1% (258)Unmarried:
22.9% (76)
Women who did not give birth in the past 12 months Now married:
44.7% (1,773)Unmarried:
55.3% (2,197)
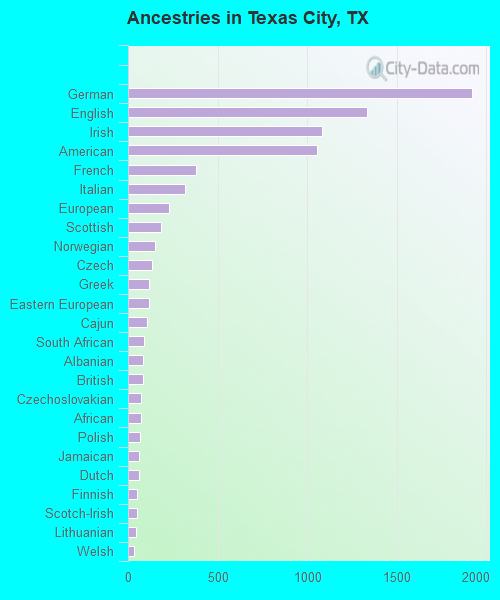
Ancestries in Texas City
1,920 6.2% German1,337 4.3% English1,082 3.5% Irish1,055 3.4% American382 1.2% French318 1.0% Italian231 0.7% European182 0.6% Scottish148 0.5% Norwegian133 0.4% Czech118 0.4% Greek115 0.4% Eastern European105 0.3% Cajun89 0.3% South African84 0.3% Albanian83 0.3% British75 0.2% Czechoslovakian75 0.2% African65 0.2% Polish61 0.2% Jamaican60 0.2% Dutch52 0.2% Finnish52 0.2% Scotch-Irish42 0.1% Lithuanian34 0.1% Welsh29 0.09% Belizean27 0.09% Swedish22 0.07% Hungarian19 0.06% French Canadian12 0.04% Nigerian10 0.03% Lebanese8 0.03% Romanian
Geographical mobility in Texas City Same house 1 year ago 19,715 82.1% White (Caucasian)11,291 81.3% Black or African American126 73.7% American Indian / Alaska Native924 89.0% Asian378 98.2% Native Hawaiian / Pacific Islander4,285 95.5% Other race9,601 80.7% Two or more races16,289 85.0% White alone, not Hispanic / Latino13,941 79.4% Hispanic or LatinoMoved within same county 1,742 7.3% White / Caucasian1,664 12.0% Black or African American35 20.2% American Indian / Alaska Native21 2.0% Asian40 0.9% Other race1,795 15.1% Two or more races1,256 6.6% White alone, not Hispanic / Latino2,110 12.0% Hispanic or LatinoMoved within same state 1,628 6.8% White / Caucasian773 5.6% Black or African American5 3.0% American Indian / Alaska Native74 7.1% Asian110 2.4% Other race290 2.4% Two or more races1,112 5.8% White alone, not Hispanic / Latino869 5.0% Hispanic or LatinoMoved from different state 444 1.8% White / Caucasian48 0.3% Black or African American19 1.8% Asian39 0.9% Other race225 1.9% Two or more races302 1.6% White alone, not Hispanic / Latino447 2.5% Hispanic or LatinoMoved from abroad 1 0.0% White13 0.1% Black or African American54 1.2% Other race42 0.2% Hispanic or Latino
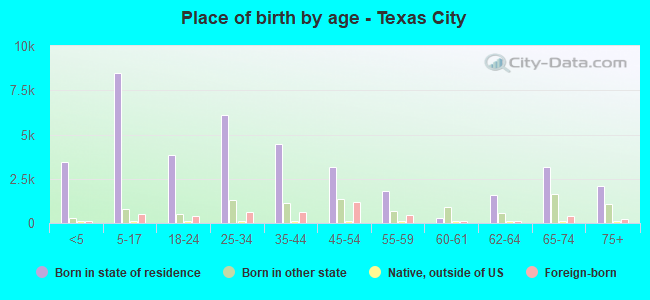
Children Nativity (place of birth) in Texas City
Children under 6 years - Living with two parents Both parents native 1,314 100.0% NativeBoth parents foreign-born 120 100.0% NativeOne native, one foreign-born parent 277 100.0% NativeChildren under 6 years - Living with one parent Native parent 1,685 100.0% NativeForeign-born parent 45 100.0% Foreign-bornChildren 6 to 17 years - Living with two parents Both parents native 3,761 97.2% Native107 2.8% Foreign-bornBoth parents foreign-born 379 75.1% Native126 24.9% Foreign-bornOne native, one foreign-born parent 338 100.0% NativeChildren 6 to 17 years - Living with one parent Native parent 3,364 95.8% Native147 4.2% Foreign-bornForeign-born parent 318 71.9% Native124 28.1% Foreign-born
Grandparents responsible for own grandchildren in Texas City
Grandparents (30 to 59 years) White / Caucasian 168 71.2% Responsible for grandchildren68 28.8% Not responsible for grandchildrenBlack or African American 20 60.4% Responsible for grandchildren13 39.6% Not responsible for grandchildrenAsian 3 100.0% Not responsible for grandchildrenOther race 21 18.7% Responsible for grandchildren93 81.3% Not responsible for grandchildrenTwo or more races 29 100.0% Not responsible for grandchildrenWhite alone, not Hispanic / Latino 123 59.5% Responsible for grandchildren84 40.5% Not responsible for grandchildrenHispanic or Latino 82 53.9% Responsible for grandchildren70 46.1% Not responsible for grandchildrenGrandparents (60 years and over) White / Caucasian 73 31.6% Responsible for grandchildren157 68.4% Not responsible for grandchildrenBlack or African American 106 57.5% Responsible for grandchildren78 42.5% Not responsible for grandchildrenAsian 5 100.0% Not responsible for grandchildrenOther race 125 100.0% Not responsible for grandchildrenTwo or more races 134 100.0% Not responsible for grandchildrenWhite alone, not Hispanic / Latino 56 22.4% Responsible for grandchildren194 77.6% Not responsible for grandchildrenHispanic or Latino 53 16.0% Responsible for grandchildren279 84.0% Not responsible for grandchildren