Races in The Village, Oklahoma (OK) Detailed Stats
Data:
Races - White alone (%)
Races - White alone (% change since 2000)
Races - Black alone (%)
Races - Black alone (% change since 2000)
Races - American Indian alone (%)
Races - American Indian alone (% change since 2000)
Races - Asian alone (%)
Races - Asian alone (% change since 2000)
Races - Hispanic (%)
Races - Hispanic (% change since 2000)
Races - Native Hawaiian and Other Pacific Islander alone (%)
Races - Native Hawaiian and Other Pacific Islander alone (% change since 2000)
Races - Two or more races(%)
Races - Two or more races(% change since 2000)
Races - Other race alone (%)
Races - Other race alone (% change since 2000)
Racial diversity
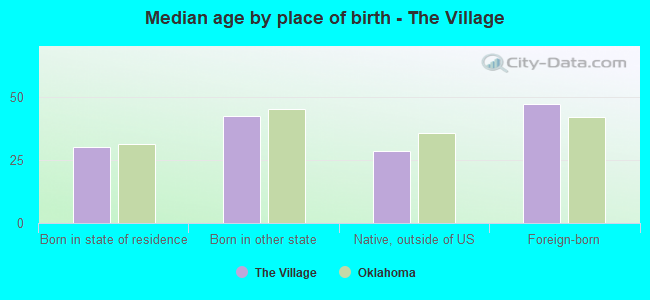
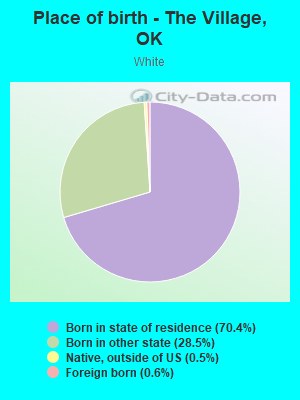
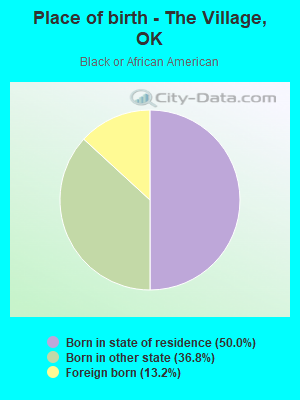
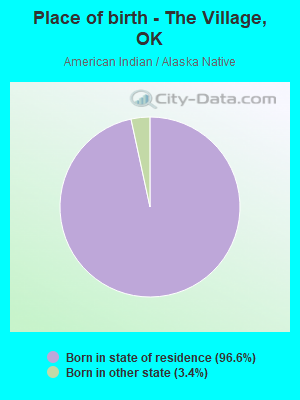
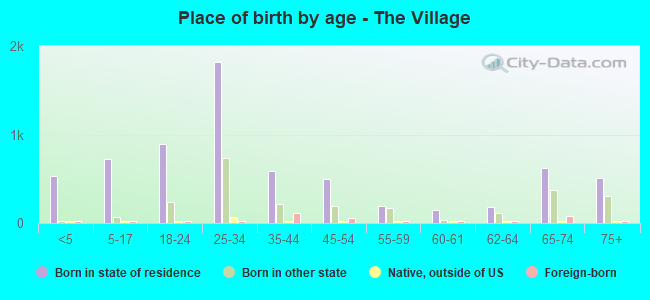
Place of birth - Born in state of residence (%)
Place of birth - Born in state of residence (%) - White
Place of birth - Born in state of residence (%) - Black or African American
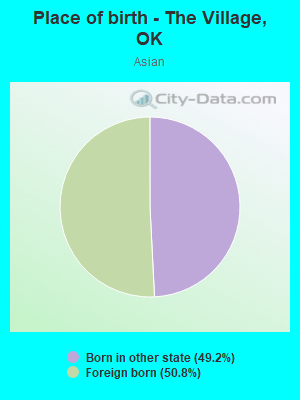
Place of birth - Born in state of residence (%) - Asian
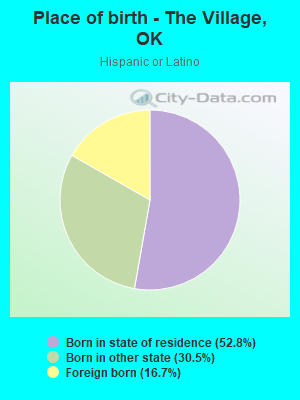
Place of birth - Born in state of residence (%) - Hispanic or Latino
Place of birth - Born in state of residence (%) - American Indian and Alaska Native
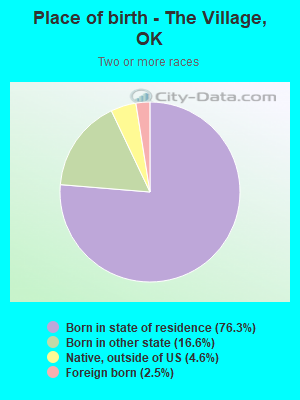
Place of birth - Born in state of residence (%) - Multirace
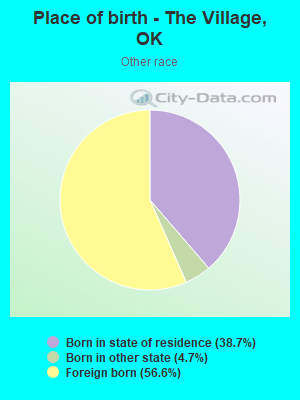
Place of birth - Born in state of residence (%) - Other Race
Place of birth - Born in other state (%)
Place of birth - Born in other state (%) - White
Place of birth - Born in other state (%) - Black or African American
Place of birth - Born in other state (%) - Asian
Place of birth - Born in other state (%) - Hispanic or Latino
Place of birth - Born in other state (%) - American Indian and Alaska Native
Place of birth - Born in other state (%) - Multirace
Place of birth - Born in other state (%) - Other Race
Place of birth - Native, outside of US (%)
Place of birth - Native, outside of US (%) - White
Place of birth - Native, outside of US (%) - Black or African American
Place of birth - Native, outside of US (%) - Asian
Place of birth - Native, outside of US (%) - Hispanic or Latino
Place of birth - Native, outside of US (%) - American Indian and Alaska Native
Place of birth - Native, outside of US (%) - Multirace
Place of birth - Native, outside of US (%) - Other Race
Place of birth - Foreign born (%)
Place of birth - Foreign born (%) - White
Place of birth - Foreign born (%) - Black or African American
Place of birth - Foreign born (%) - Asian
Place of birth - Foreign born (%) - Hispanic or Latino
Place of birth - Foreign born (%) - American Indian and Alaska Native
Place of birth - Foreign born (%) - Multirace
Place of birth - Foreign born (%) - Other Race
Residents speaking English at home (%)
Residents speaking English at home - Born in the United States (%)
Residents speaking English at home - Native, born elsewhere (%)
Residents speaking English at home - Foreign born (%)
Residents speaking Spanish at home (%)
Residents speaking Spanish at home - Born in the United States (%)
Residents speaking Spanish at home - Native, born elsewhere (%)
Residents speaking Spanish at home - Foreign born (%)
Residents speaking other language at home (%)
Residents speaking other language at home - Born in the United States (%)
Residents speaking other language at home - Native, born elsewhere (%)
Residents speaking other language at home - Foreign born (%)
Marital status - Never married (%)
Marital status - Now married (%)
Marital status - Separated (%)
Marital status - Widowed (%)
Marital status - Divorced (%)
Ancestries Reported - Arab (%)
Ancestries Reported - Czech (%)
Ancestries Reported - Danish (%)
Ancestries Reported - Dutch (%)
Ancestries Reported - English (%)
Ancestries Reported - French (%)
Ancestries Reported - French Canadian (%)
Ancestries Reported - German (%)
Ancestries Reported - Greek (%)
Ancestries Reported - Hungarian (%)
Ancestries Reported - Irish (%)
Ancestries Reported - Italian (%)
Ancestries Reported - Lithuanian (%)
Ancestries Reported - Norwegian (%)
Ancestries Reported - Polish (%)
Ancestries Reported - Portuguese (%)
Ancestries Reported - Russian (%)
Ancestries Reported - Scotch-Irish (%)
Ancestries Reported - Scottish (%)
Ancestries Reported - Slovak (%)
Ancestries Reported - Subsaharan African (%)
Ancestries Reported - Swedish (%)
Ancestries Reported - Swiss (%)
Ancestries Reported - Ukrainian (%)
Ancestries Reported - United States (%)
Ancestries Reported - Welsh (%)
Ancestries Reported - West Indian (%)
Ancestries Reported - Other (%)
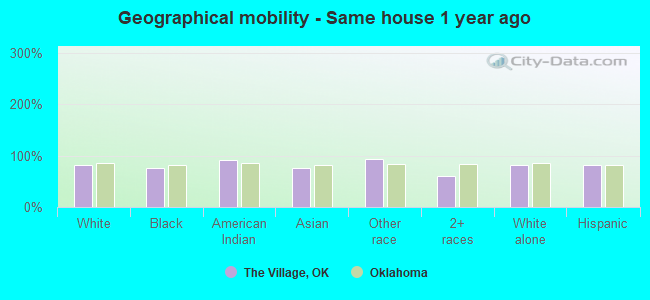
Geographical mobility - Same house 1 year ago (%)
Geographical mobility - Same house 1 year ago (%) - White
Geographical mobility - Same house 1 year ago (%) - Black or African American
Geographical mobility - Same house 1 year ago (%) - Asian
Geographical mobility - Same house 1 year ago (%) - Hispanic or Latino
Geographical mobility - Same house 1 year ago (%) - American Indian and Alaska Native
Geographical mobility - Same house 1 year ago (%) - Multirace
Geographical mobility - Same house 1 year ago (%) - Other Race
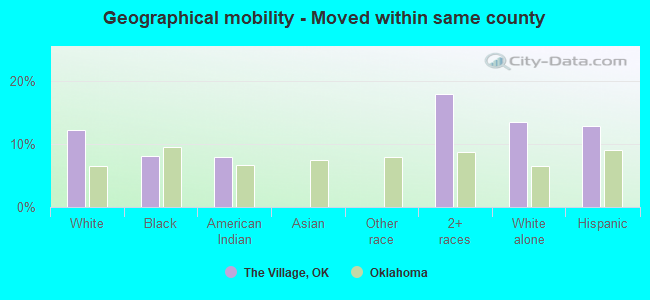
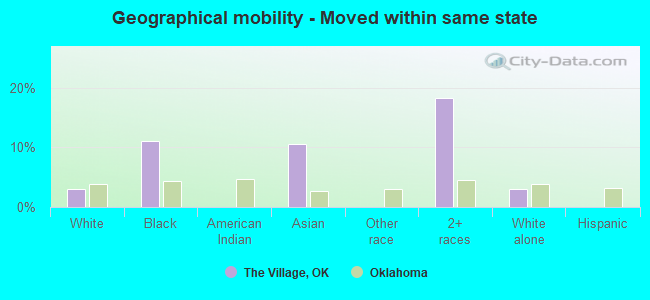
Geographical mobility - Moved within same county (%)
Geographical mobility - Moved within same county (%) - White
Geographical mobility - Moved within same county (%) - Black or African American
Geographical mobility - Moved within same county (%) - Asian
Geographical mobility - Moved within same county (%) - Hispanic or Latino
Geographical mobility - Moved within same county (%) - American Indian and Alaska Native
Geographical mobility - Moved within same county (%) - Multirace
Geographical mobility - Moved within same county (%) - Other Race
Geographical mobility - Moved from different county within same state (%)
Geographical mobility - Moved from different county within same state (%) - White
Geographical mobility - Moved from different county within same state (%) - Black or African American
Geographical mobility - Moved from different county within same state (%) - Asian
Geographical mobility - Moved from different county within same state (%) - Hispanic or Latino
Geographical mobility - Moved from different county within same state (%) - American Indian and Alaska Native
Geographical mobility - Moved from different county within same state (%) - Multirace
Geographical mobility - Moved from different county within same state (%) - Other Race
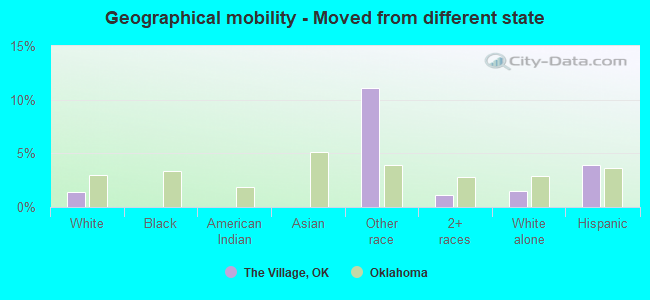
Geographical mobility - Moved from different state (%)
Geographical mobility - Moved from different state (%) - White
Geographical mobility - Moved from different state (%) - Black or African American
Geographical mobility - Moved from different state (%) - Asian
Geographical mobility - Moved from different state (%) - Hispanic or Latino
Geographical mobility - Moved from different state (%) - American Indian and Alaska Native
Geographical mobility - Moved from different state (%) - Multirace
Geographical mobility - Moved from different state (%) - Other Race
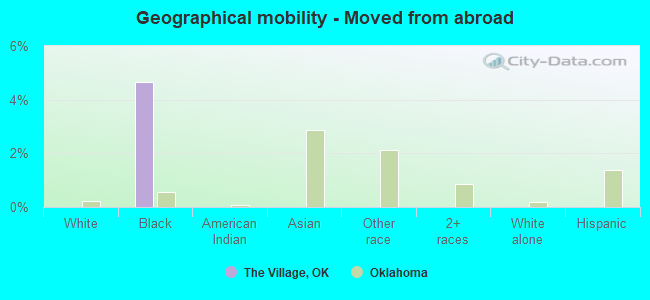
Geographical mobility - Moved from abroad (%)
Geographical mobility - Moved from abroad (%) - White
Geographical mobility - Moved from abroad (%) - Black or African American
Geographical mobility - Moved from abroad (%) - Asian
Geographical mobility - Moved from abroad (%) - Hispanic or Latino
Geographical mobility - Moved from abroad (%) - American Indian and Alaska Native
Geographical mobility - Moved from abroad (%) - Multirace
Geographical mobility - Moved from abroad (%) - Other Race
Place of birth for the foreign-born population - Ireland (%)
Place of birth for the foreign-born population - Denmark (%)
Place of birth for the foreign-born population - Norway (%)
Place of birth for the foreign-born population - Sweden (%)
Place of birth for the foreign-born population - United Kingdom (%)
Place of birth for the foreign-born population - England (%)
Place of birth for the foreign-born population - Scotland (%)
Place of birth for the foreign-born population - Other Northern Europe (%)
Place of birth for the foreign-born population - Austria (%)
Place of birth for the foreign-born population - Belgium (%)
Place of birth for the foreign-born population - France (%)
Place of birth for the foreign-born population - Germany (%)
Place of birth for the foreign-born population - Netherlands (%)
Place of birth for the foreign-born population - Switzerland (%)
Place of birth for the foreign-born population - Other Western Europe (%)
Place of birth for the foreign-born population - Greece (%)
Place of birth for the foreign-born population - Italy (%)
Place of birth for the foreign-born population - Portugal (%)
Place of birth for the foreign-born population - Spain (%)
Place of birth for the foreign-born population - Other Southern Europe (%)
Place of birth for the foreign-born population - Albania (%)
Place of birth for the foreign-born population - Belarus (%)
Place of birth for the foreign-born population - Bosnia and Herzegovina (%)
Place of birth for the foreign-born population - Bulgaria (%)
Place of birth for the foreign-born population - Croatia (%)
Place of birth for the foreign-born population - Czechoslovakia (%)
Place of birth for the foreign-born population - Hungary (%)
Place of birth for the foreign-born population - Latvia (%)
Place of birth for the foreign-born population - Lithuania (%)
Place of birth for the foreign-born population - North Macedonia (Macedonia) (%)
Place of birth for the foreign-born population - Moldova (%)
Place of birth for the foreign-born population - Poland (%)
Place of birth for the foreign-born population - Romania (%)
Place of birth for the foreign-born population - Russia (%)
Place of birth for the foreign-born population - Serbia (%)
Place of birth for the foreign-born population - Ukraine (%)
Place of birth for the foreign-born population - Other Eastern Europe (%)
Place of birth for the foreign-born population - China (%)
Place of birth for the foreign-born population - Hong Kong (%)
Place of birth for the foreign-born population - Taiwan (%)
Place of birth for the foreign-born population - Japan (%)
Place of birth for the foreign-born population - Korea (%)
Place of birth for the foreign-born population - Other Eastern Asia (%)
Place of birth for the foreign-born population - Afghanistan (%)
Place of birth for the foreign-born population - Bangladesh (%)
Place of birth for the foreign-born population - India (%)
Place of birth for the foreign-born population - Iran (%)
Place of birth for the foreign-born population - Kazakhstan (%)
Place of birth for the foreign-born population - Nepal (%)
Place of birth for the foreign-born population - Pakistan (%)
Place of birth for the foreign-born population - Sri Lanka (%)
Place of birth for the foreign-born population - Uzbekistan (%)
Place of birth for the foreign-born population - Other South Central Asia (%)
Place of birth for the foreign-born population - Burma (%)
Place of birth for the foreign-born population - Cambodia (%)
Place of birth for the foreign-born population - Indonesia (%)
Place of birth for the foreign-born population - Laos (%)
Place of birth for the foreign-born population - Malaysia (%)
Place of birth for the foreign-born population - Philippines (%)
Place of birth for the foreign-born population - Singapore (%)
Place of birth for the foreign-born population - Thailand (%)
Place of birth for the foreign-born population - Vietnam (%)
Place of birth for the foreign-born population - Other South Eastern Asia (%)
Place of birth for the foreign-born population - Armenia (%)
Place of birth for the foreign-born population - Iraq (%)
Place of birth for the foreign-born population - Israel (%)
Place of birth for the foreign-born population - Jordan (%)
Place of birth for the foreign-born population - Kuwait (%)
Place of birth for the foreign-born population - Lebanon (%)
Place of birth for the foreign-born population - Saudi Arabia (%)
Place of birth for the foreign-born population - Syria (%)
Place of birth for the foreign-born population - Turkey (%)
Place of birth for the foreign-born population - Yemen (%)
Place of birth for the foreign-born population - Other Western Asia (%)
Place of birth for the foreign-born population - Eritrea (%)
Place of birth for the foreign-born population - Ethiopia (%)
Place of birth for the foreign-born population - Kenya (%)
Place of birth for the foreign-born population - Somalia (%)
Place of birth for the foreign-born population - Uganda (%)
Place of birth for the foreign-born population - Zimbabwe (%)
Place of birth for the foreign-born population - Other Eastern Africa (%)
Place of birth for the foreign-born population - Cameroon (%)
Place of birth for the foreign-born population - Congo (%)
Place of birth for the foreign-born population - Democratic Republic of Congo (Zaire) (%)
Place of birth for the foreign-born population - Other Middle Africa (%)
Place of birth for the foreign-born population - Egypt (%)
Place of birth for the foreign-born population - Morocco (%)
Place of birth for the foreign-born population - Sudan (%)
Place of birth for the foreign-born population - Other Northern Africa (%)
Place of birth for the foreign-born population - South Africa (%)
Place of birth for the foreign-born population - Other Southern Africa (%)
Place of birth for the foreign-born population - Cabo Verde (%)
Place of birth for the foreign-born population - Ghana (%)
Place of birth for the foreign-born population - Liberia (%)
Place of birth for the foreign-born population - Nigeria (%)
Place of birth for the foreign-born population - Senegal (%)
Place of birth for the foreign-born population - Sierra Leone (%)
Place of birth for the foreign-born population - Other Western Africa (%)
Place of birth for the foreign-born population - Australia (%)
Place of birth for the foreign-born population - New Zealand (%)
Place of birth for the foreign-born population - Fiji (%)
Place of birth for the foreign-born population - Micronesia (%)
Place of birth for the foreign-born population - Bahamas (%)
Place of birth for the foreign-born population - Barbados (%)
Place of birth for the foreign-born population - Cuba (%)
Place of birth for the foreign-born population - Dominica (%)
Place of birth for the foreign-born population - Dominican Republic (%)
Place of birth for the foreign-born population - Grenada (%)
Place of birth for the foreign-born population - Haiti (%)
Place of birth for the foreign-born population - Jamaica (%)
Place of birth for the foreign-born population - St. Vincent and the Grenadines (%)
Place of birth for the foreign-born population - Trinidad and Tobago (%)
Place of birth for the foreign-born population - West Indies (%)
Place of birth for the foreign-born population - Other Caribbean (%)
Place of birth for the foreign-born population - Belize (%)
Place of birth for the foreign-born population - Costa Rica (%)
Place of birth for the foreign-born population - El Salvador (%)
Place of birth for the foreign-born population - Guatemala (%)
Place of birth for the foreign-born population - Honduras (%)
Place of birth for the foreign-born population - Mexico (%)
Place of birth for the foreign-born population - Nicaragua (%)
Place of birth for the foreign-born population - Panama (%)
Place of birth for the foreign-born population - Other Central America (%)
Place of birth for the foreign-born population - Argentina (%)
Place of birth for the foreign-born population - Bolivia (%)
Place of birth for the foreign-born population - Brazil (%)
Place of birth for the foreign-born population - Chile (%)
Place of birth for the foreign-born population - Colombia (%)
Place of birth for the foreign-born population - Ecuador (%)
Place of birth for the foreign-born population - Guyana (%)
Place of birth for the foreign-born population - Peru (%)
Place of birth for the foreign-born population - Uruguay (%)
Place of birth for the foreign-born population - Venezuela (%)
Place of birth for the foreign-born population - Other South America (%)
Place of birth for the foreign-born population - Canada (%)
Place of birth for the foreign-born population - Other Northern America (%)
Place of birth for the foreign-born population - Other (%)
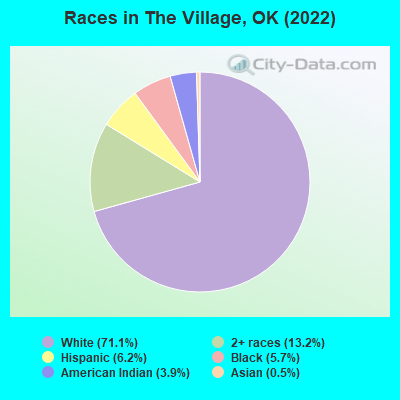
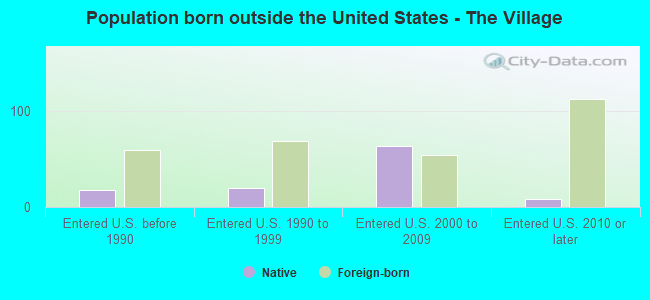
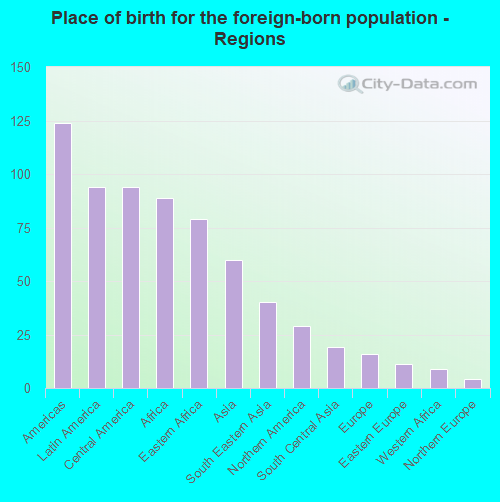
According to 2022 data, the most numerous races in The Village, OK are White alone (6,797 residents), Hispanic (589 residents), and Two or more races (1,263 residents). 95.4% of The Village residents speak English at home. 3.0% of The Village, OK residents are foreign-born (1.0% born in Latin America, 0.9% born in Africa, 0.6% born in Asia, 0.3% born in North America), which is 97.1% less than the foreign-born rate of 6.0% across the entire state of Oklahoma.
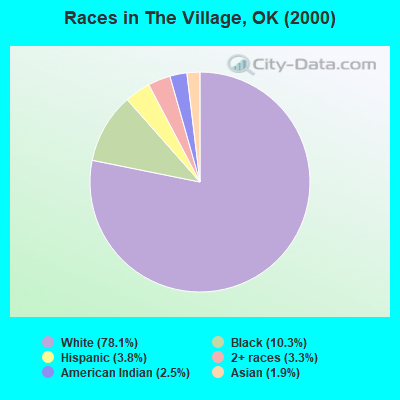
Race distribution in The Village
2000 2022
2,556,368 74.1% White alone 266,158 7.7% American Indian alone 257,981 7.5% Black alone 179,304 5.2% Hispanic 140,249 4.1% Two or more races 46,172 1.3% Asian alone 2,322 0.07% Other race alone 2,100 0.06% Native Hawaiian and Other
2,517,403 62.6% White alone 486,692 12.1% Hispanic 364,453 9.1% Two or more races 273,650 6.8% American Indian alone 268,543 6.7% Black alone 92,672 2.3% Asian alone 10,786 0.3% Other race alone 5,601 0.1% Native Hawaiian and Other
Income and house value in The Village Median household income in 2022 $70,973 White non-Hispanic householders$72,763 Black householders$57,569 American Indian and Alaska Native householders$119,128 Some other race householders$43,373 Two or more races householders$98,061 Hispanic or Latino race householdersMedian 2022 house value $198,548 White Non-Hispanic householders$196,516 Black or African American householders$252,829 American Indian or Alaska Native householders $157,619 Asian householders$188,678 Some other race householders$206,095 Two or more races householders$188,098 Hispanic or Latino householders
Median age by race in The Village
35.6 Median age for White residents35.2 35.8 31.7 Median age for Black or African American residents31.6 31.7 42.3 Median age for American Indian / Alaska Native residents41.3 33.5 38.0 Median age for Asian residents-610,354,222.8 -682,291,666.0 -725,225,224.5 Median age for Native Hawaiian / Pacific Islander residents-675,324,674.6 -767,251,461.2 31.5 Median age for Other race residents37.1 29.2 22.3 Median age for Two or more races residents22.0 23.0 36.2 Median age for White alone residents34.5 36.7 27.1 Median age for Hispanic or Latino residents25.6 27.7
Owner/renter occupied households by race in The Village
House owners and renters - White residents 2,339 67.5% Owner occupied1,127 32.5% Renter occupiedHouse owners and renters - Black or African American residents 103 40.4% Owner occupied152 59.6% Renter occupiedHouse owners and renters - American Indian / Alaska Native residents 88 32.6% Owner occupied182 67.4% Renter occupiedHouse owners and renters - Asian residents 9 100.0% Owner occupiedHouse owners and renters - Other race residents 33 100.0% Owner occupiedHouse owners and renters - Two or more races residents 257 29.3% Owner occupied622 70.7% Renter occupiedHouse owners and renters - White alone residents 2,386 67.4% Owner occupied1,156 32.6% Renter occupiedHouse owners and renters - Hispanic or Latino residents 99 35.6% Owner occupied178 64.4% Renter occupied
Language usage in The Village
English speakers - Total 95.4% of residents of The Village speak English at home.
2.6% of residents speak Spanish at home 178 76.1% Speak English very well56 23.9% Speak English less than very well1.7% of residents speak other language at home 139 89.1% Speak English very well17 10.9% Speak English less than very well
English speakers - Born in the United States 95.9% of residents of The Village speak English at home.
3.2% of residents speak Spanish at home 79 100.0% Speak English very well0.9% of residents speak other language at home 21 100.0% Speak English very well
English speakers - Native, born elsewhere 91.9% of residents of The Village speak English at home.
English speakers - Foreign-born 32.1% of residents of The Village speak English at home.
23.5% of residents speak Spanish at home 22 31.9% Speak English very well47 68.1% Speak English less than very well44.7% of residents speak other language at home 120 91.6% Speak English very well11 8.4% Speak English less than very well
White (Caucasian) - Speak only English Native:
100.0% (6,438)Foreign-born:
100.0% (38)
White (Caucasian) - Speak another language Native:
0.6% (38)Foreign-born:
41.3% (16)
Black or African American - Speak only English Native:
82.6% (345)Foreign-born:
8.9% (6)
Black or African American - Speak another language Native:
16.4% (68)Foreign-born:
97.7% (70)
Other race - Speak only English Native:
32.9% (21)Foreign-born:
24.4% (21)
Other race - Speak another language Native:
67.6% (44)Foreign-born:
73.3% (62)
Two or more races - Speak only English Native:
91.7% (1,330)Foreign-born:
71.3% (29)
White alone - Speak only English Native:
98.9% (6,354)Foreign-born:
75.5% (46)
White alone - Speak another language Native:
0.9% (61)Foreign-born:
26.1% (16)
Hispanic or Latino - Speak only English Native:
89.1% (433)Foreign-born:
37.0% (37)
Hispanic or Latino - Speak another language Native:
11.7% (57)Foreign-born:
71.5% (71)
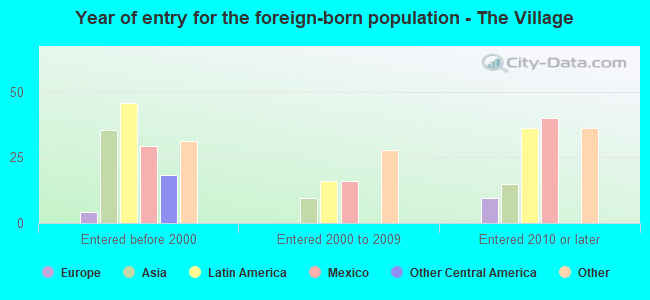
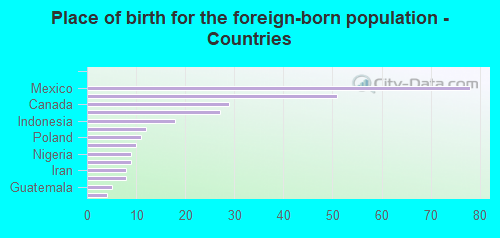
Foreign-born residents in The Village 291 residents are foreign born (1.0% Latin America , 0.9% Africa , 0.6% Asia , 0.3% North America ).
This city:
3.0%Oklahoma:
6.1%
Marital status for residents in The Village Marital status - White (Caucasian) population 15 years and over
Males 36.1% Never married48.8% Now married0.0% Separated7.0% Widowed8.1% DivorcedFemales 39.9% Never married34.1% Now married0.6% Separated6.8% Widowed18.7% DivorcedWomen who gave birth in the past 12 months Now married:
78.9% (79)Unmarried:
21.1% (21)
Women who did not give birth in the past 12 months Now married:
31.5% (612)Unmarried:
68.5% (1,333)
Marital status - Black or African American population 15 years and over
Males 56.6% Never married23.7% Now married0.0% Separated1.1% Widowed18.6% DivorcedFemales 22.5% Never married44.0% Now married8.6% Separated12.0% Widowed12.9% DivorcedWomen who did not give birth in the past 12 months Now married:
36.1% (39)Unmarried:
63.9% (69)
Marital status - American Indian / Alaska Native population 15 years and over
Males 64.6% Never married12.8% Now married0.0% Separated0.0% Widowed22.6% DivorcedFemales 38.8% Never married36.2% Now married0.0% Separated4.1% Widowed20.9% DivorcedWomen who gave birth in the past 12 months Now married:
100.0% (12)Unmarried:
0.0% (0)
Women who did not give birth in the past 12 months Now married:
52.6% (68)Unmarried:
47.4% (61)
Marital status - Asian population 15 years and over
Males 0.0% Never married100.0% Now married0.0% Separated0.0% Widowed0.0% DivorcedFemales 0.0% Never married59.1% Now married0.0% Separated0.0% Widowed40.9% DivorcedWomen who did not give birth in the past 12 months Now married:
100.0% (14)Unmarried:
0.0% (0)
Marital status - Other race population 15 years and over
Males 58.3% Never married41.7% Now married0.0% Separated0.0% Widowed0.0% DivorcedFemales 0.0% Never married71.4% Now married0.0% Separated28.6% Widowed0.0% DivorcedWomen who did not give birth in the past 12 months Now married:
71.4% (29)Unmarried:
28.6% (12)
Marital status - Two or more races population 15 years and over
Males 71.4% Never married15.6% Now married0.0% Separated0.0% Widowed13.1% DivorcedFemales 68.4% Never married22.4% Now married0.0% Separated1.5% Widowed7.6% DivorcedWomen who did not give birth in the past 12 months Now married:
19.5% (95)Unmarried:
80.5% (392)
Marital status - White alone, not Hispanic / Latino population 15 years and over
Males 36.3% Never married48.3% Now married0.0% Separated7.2% Widowed8.3% DivorcedFemales 39.7% Never married33.8% Now married0.6% Separated7.0% Widowed18.8% DivorcedWomen who gave birth in the past 12 months Now married:
78.9% (86)Unmarried:
21.1% (23)
Women who did not give birth in the past 12 months Now married:
30.8% (603)Unmarried:
69.2% (1,356)
Marital status - Hispanic or Latino population 15 years and over
Males 65.8% Never married34.2% Now married0.0% Separated0.0% Widowed0.0% DivorcedFemales 39.0% Never married46.8% Now married0.0% Separated4.3% Widowed10.0% DivorcedWomen who did not give birth in the past 12 months Now married:
46.8% (116)Unmarried:
53.2% (133)
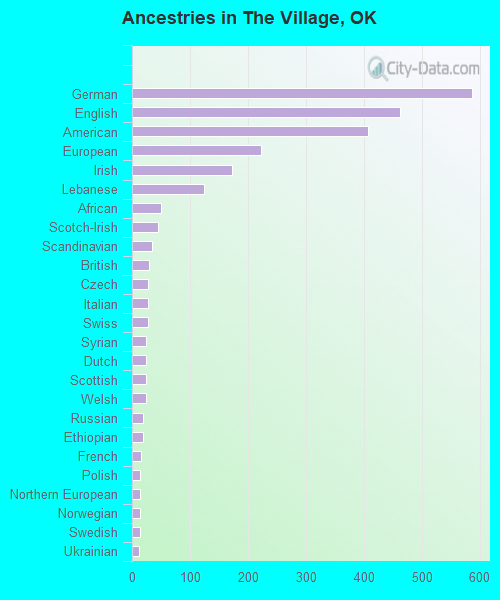
Ancestries in The Village
587 15.6% German463 12.3% English407 10.8% American223 5.9% European172 4.6% Irish124 3.3% Lebanese50 1.3% African45 1.2% Scotch-Irish34 0.9% Scandinavian30 0.8% British28 0.7% Czech28 0.7% Italian27 0.7% Swiss25 0.7% Syrian25 0.7% Dutch24 0.6% Scottish24 0.6% Welsh19 0.5% Russian19 0.5% Ethiopian16 0.4% French14 0.4% Polish13 0.3% Northern European13 0.3% Norwegian13 0.3% Swedish12 0.3% Ukrainian11 0.3% Finnish7 0.2% Czechoslovakian7 0.2% Greek5 0.1% Eastern European5 0.1% Lithuanian3 0.08% Austrian
Children Nativity (place of birth) in The Village
Children under 6 years - Living with two parents Both parents native 287 100.0% NativeBoth parents foreign-born 16 100.0% NativeOne native, one foreign-born parent 26 100.0% NativeChildren under 6 years - Living with one parent Native parent 287 100.0% NativeChildren 6 to 17 years - Living with two parents Both parents native 409 100.0% NativeOne native, one foreign-born parent 31 100.0% NativeChildren 6 to 17 years - Living with one parent Native parent 111 100.0% NativeForeign-born parent 16 50.3% Native16 49.7% Foreign-born