Races in The Villages, Florida (FL) Detailed Stats
Ancestries, Foreign-born residents, place of birth
Settings
X


Recent posts about races in The Villages, Florida on our local forum with over 2,400,000 registered users:
 | The Villages - Where to start ? (45 replies) |
| Absolute house insanity (701 replies) |
| Villagers of “The Villages”: there’s now a documentary about ya’ll! (50 replies) |
| Why would liberals ever move to The Villages? (143 replies) |
| The Villages - Buyers agent/realtor recommendation (7 replies) |
| Florida's next boom city (60 replies) |
According to 2022 data, the most numerous races in The Villages, FL are White alone (83,197 residents), Hispanic (1,315 residents), and Black alone (308 residents). 95.2% of The Villages residents speak English at home. 5.3% of The Villages, FL residents are foreign-born (2.2% born in Europe, 1.7% born in North America, 0.9% born in Asia, 0.6% born in Latin America), which is 293.5% less than the foreign-born rate of 21.0% across the entire state of Florida.
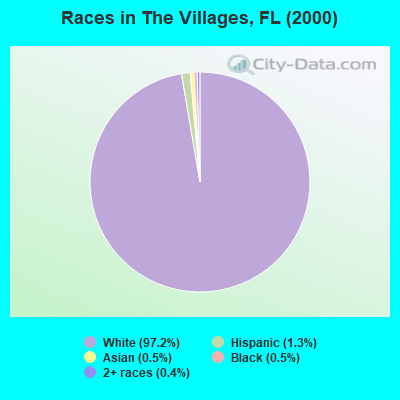
Race distribution in The Villages
2000
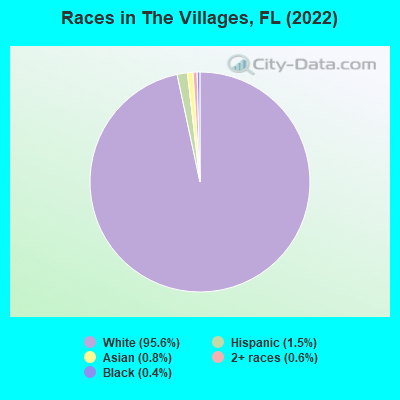
2022

- 8,10097.2%White alone
- 1081.3%Hispanic
- 410.5%Black alone
- 440.5%Asian alone
- 310.4%Two or more races
- 70.08%American Indian alone
- 10.01%Other race alone
- 10.01%Native Hawaiian and Other
Pacific Islander alone
-
- 83,19795.6%White alone
- 1,3151.5%Hispanic
- 7130.8%Asian alone
- 5160.6%Two or more races
- 3080.4%Black alone
- 360.04%American Indian alone
- 120.01%Native Hawaiian and Other
Pacific Islander alone
2000
2022
-
- 10,458,50965.4%White alone
- 2,682,71516.8%Hispanic
- 2,264,26814.2%Black alone
- 261,6931.6%Asian alone
- 236,9541.5%Two or more races
- 42,3580.3%American Indian alone
- 28,9940.2%Other race alone
- 6,8870.04%Native Hawaiian and Other
Pacific Islander alone

-
- 11,309,40350.8%White alone
- 6,025,03927.1%Hispanic
- 3,241,01514.6%Black alone
- 861,6303.9%Two or more races
- 623,6922.8%Asian alone
- 152,0540.7%Other race alone
- 22,5040.1%American Indian alone
- 9,4860.04%Native Hawaiian and Other
Pacific Islander alone

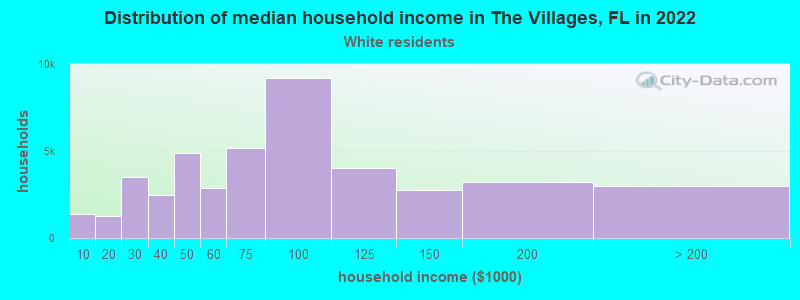
Income and house value in The Villages
- Median household income in 2022
- $75,893White non-Hispanic householders
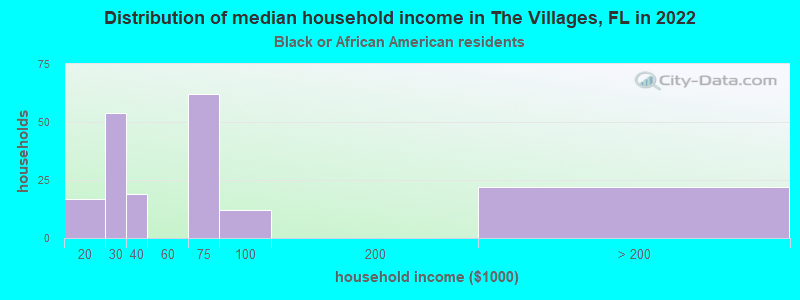
- $26,044Black householders
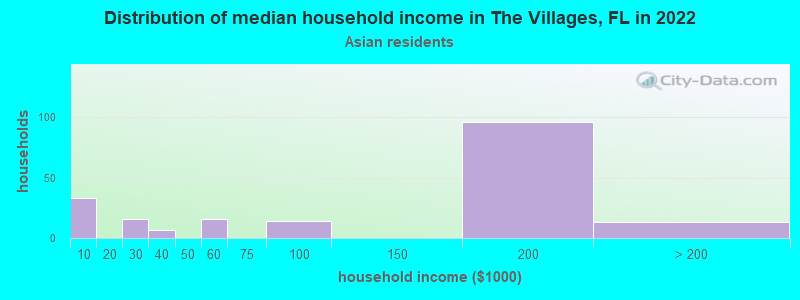
- $75,218Asian householders
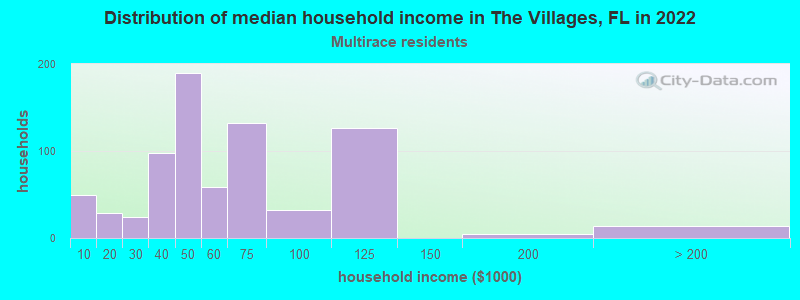
- $61,474Two or more races householders
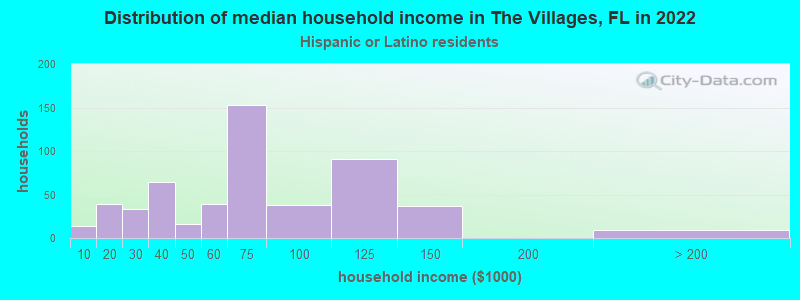
- $60,918Hispanic or Latino race householders
- Median 2022 house value
- $386,382White Non-Hispanic householders
- $283,271Black or African American householders
- $240,781American Indian or Alaska Native householders
- $531,134Asian householders
- $269,108Two or more races householders
- $348,141Hispanic or Latino householders
Household income for White non-Hispanic householders
Household income for Black householders
Household income for Asian householders
Household income for Two or more races householders
Household income for Hispanic or Latino race householders
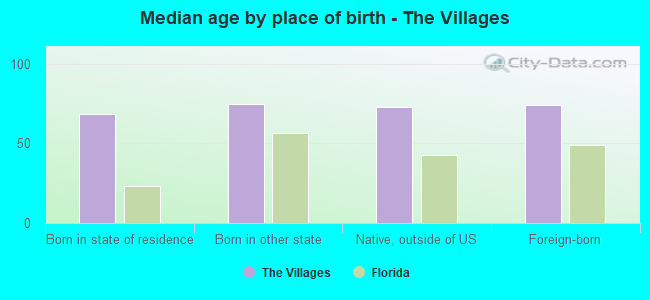
Median age by race in The Villages
- 74.7Median age for White residents
- 75.4Males
- 74.3Females
- 83.3Median age for Black or African American residents
- -666,666,666.0Males
- -666,666,666.0Females
- -666,666,666.0Median age for American Indian / Alaska Native residents
- -666,666,666.0Males
- -666,666,666.0Females
- 74.3Median age for Asian residents
- -666,666,666.0Males
- 74.2Females
- -666,666,666.0Median age for Native Hawaiian / Pacific Islander residents
- -666,666,666.0Males
- -666,666,666.0Females
- -666,666,666.0Median age for Other race residents
- -666,666,666.0Males
- -666,666,666.0Females
- 70.4Median age for Two or more races residents
- 48.5Males
- 74.6Females
- 74.7Median age for White alone residents
- 75.5Males
- 74.3Females
- 66.0Median age for Hispanic or Latino residents
- 48.4Males
- 73.5Females
Owner/renter occupied households by race in The Villages
- House owners and renters - White residents
- 41,43594.5%Owner occupied
- 2,3925.5%Renter occupied
- House owners and renters - Black or African American residents
- 14571.1%Owner occupied
- 5928.9%Renter occupied
- House owners and renters - American Indian / Alaska Native residents
- 37100.0%Owner occupied
- House owners and renters - Asian residents
- 18296.2%Owner occupied
- 73.8%Renter occupied
- House owners and renters - Native Hawaiian / Pacific Islander residents
- 14100.0%Owner occupied
- House owners and renters - Two or more races residents
- 85699.2%Owner occupied
- 70.8%Renter occupied
- House owners and renters - White alone residents
- 41,07194.5%Owner occupied
- 2,3925.5%Renter occupied
- House owners and renters - Hispanic or Latino residents
- 79898.0%Owner occupied
- 172.0%Renter occupied
Language usage in The Villages
- English speakers - Total
- 95.2% of residents of The Villages speak English at home.
- 1.6% of residents speak Spanish at home
- 1,27992.3%Speak English very well
- 1067.7%Speak English less than very well
- 3.3% of residents speak other language at home
- 2,28580.2%Speak English very well
- 56419.8%Speak English less than very well
- English speakers - Born in the United States
- 97.9% of residents of The Villages speak English at home.
- 0.5% of residents speak Spanish at home
- 439100.0%Speak English very well
- 1.5% of residents speak other language at home
- 1,09290.3%Speak English very well
- 1179.7%Speak English less than very well
- English speakers - Native, born elsewhere
- 95.6% of residents of The Villages speak English at home.
- 13.4% of residents speak Spanish at home
- 12191.7%Speak English very well
- 118.3%Speak English less than very well
- 6.6% of residents speak other language at home
- 812.3%Speak English very well
- 5787.7%Speak English less than very well
- English speakers - Foreign-born
- 53.2% of residents of The Villages speak English at home.
- 12.0% of residents speak Spanish at home
- 45979.4%Speak English very well
- 11920.6%Speak English less than very well
- 30.3% of residents speak other language at home
- 1,27987.9%Speak English very well
- 17612.1%Speak English less than very well
White (Caucasian) - Speak only English
| Native: | 98.1% (69,621) |
| Foreign-born: | 66.6% (2,879) |
White (Caucasian) - Speak another language
| Native: | 1.9% (1,340) |
| Foreign-born: | 33.4% (1,443) |
Black or African American - Speak another language
| Native: | 7.3% (19) |
| Foreign-born: | 100.0% (19) |
Asian - Speak only English
| Native: | 80.9% (91) |
| Foreign-born: | 17.0% (109) |
Asian - Speak another language
| Native: | 19.9% (22) |
| Foreign-born: | 83.1% (533) |
Two or more races - Speak only English
| Native: | 64.4% (538) |
| Foreign-born: | 9.1% (36) |
Two or more races - Speak another language
| Native: | 39.2% (327) |
| Foreign-born: | 100.0% (394) |
White alone - Speak only English
| Native: | 98.1% (69,468) |
| Foreign-born: | 70.0% (2,879) |
White alone - Speak another language
| Native: | 1.9% (1,340) |
| Foreign-born: | 30.0% (1,232) |
Hispanic or Latino - Speak only English
| Native: | 43.7% (299) |
| Foreign-born: | 7.8% (44) |
Hispanic or Latino - Speak another language
| Native: | 55.4% (379) |
| Foreign-born: | 93.1% (529) |
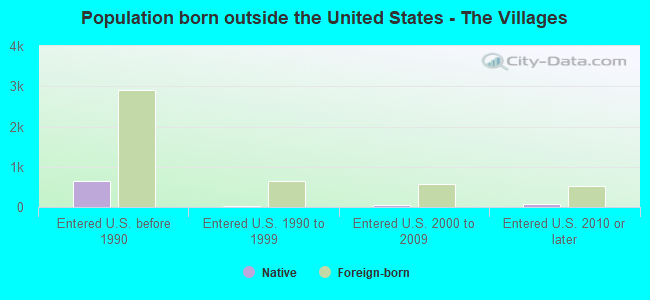
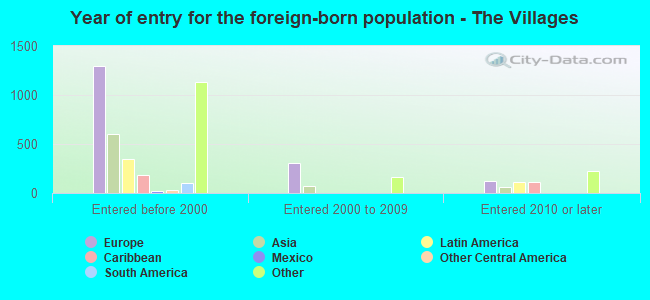
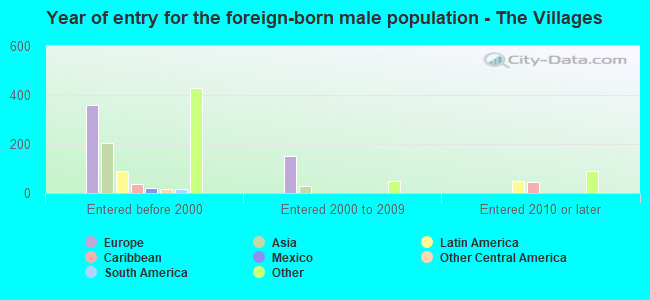
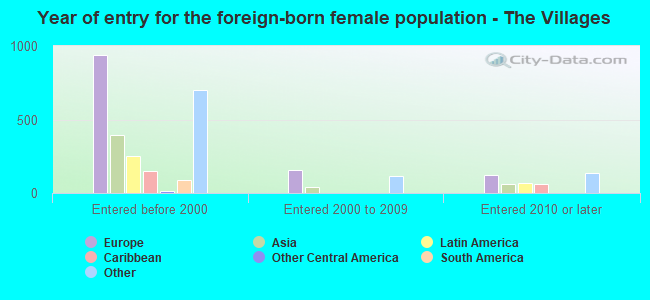
Foreign-born residents in The Villages
4,642 residents are foreign born (2.2% Europe, 1.7% North America, 0.9% Asia, 0.6% Latin America).
| This city: | 5.3% |
| Florida: | 21.1% |

Marital status for residents in The Villages
Marital status - White (Caucasian) population 15 years and over
- Males
- 2.9%Never married
- 82.4%Now married
- 0.3%Separated
- 7.3%Widowed
- 7.0%Divorced
- Females
- 2.4%Never married
- 64.7%Now married
- 1.0%Separated
- 20.1%Widowed
- 11.9%Divorced
Women who did not give birth in the past 12 months
| Now married: | 56.5% (409) |
| Unmarried: | 43.5% (315) |
Marital status - Black or African American population 15 years and over
- Males
- 20.0%Never married
- 32.2%Now married
- 0.0%Separated
- 0.0%Widowed
- 47.8%Divorced
- Females
- 8.2%Never married
- 25.5%Now married
- 0.0%Separated
- 0.0%Widowed
- 66.3%Divorced
Women who did not give birth in the past 12 months
| Now married: | 0.0% (0) |
| Unmarried: | 100.0% (16) |
Marital status - Asian population 15 years and over
- Males
- 11.9%Never married
- 88.1%Now married
- 0.0%Separated
- 0.0%Widowed
- 0.0%Divorced
- Females
- 0.0%Never married
- 95.2%Now married
- 0.0%Separated
- 3.2%Widowed
- 1.6%Divorced
Marital status - Two or more races population 15 years and over
- Males
- 7.2%Never married
- 66.6%Now married
- 0.0%Separated
- 12.0%Widowed
- 14.2%Divorced
- Females
- 11.7%Never married
- 72.7%Now married
- 0.0%Separated
- 12.5%Widowed
- 3.1%Divorced
Women who did not give birth in the past 12 months
| Now married: | 36.3% (50) |
| Unmarried: | 63.7% (87) |
Marital status - White alone, not Hispanic / Latino population 15 years and over
- Males
- 2.9%Never married
- 82.4%Now married
- 0.3%Separated
- 7.3%Widowed
- 7.0%Divorced
- Females
- 2.4%Never married
- 65.2%Now married
- 1.0%Separated
- 19.7%Widowed
- 11.7%Divorced
Women who did not give birth in the past 12 months
| Now married: | 51.4% (361) |
| Unmarried: | 48.6% (341) |
Marital status - Hispanic or Latino population 15 years and over
- Males
- 3.6%Never married
- 59.0%Now married
- 0.0%Separated
- 14.7%Widowed
- 22.8%Divorced
- Females
- 8.8%Never married
- 67.5%Now married
- 0.0%Separated
- 10.8%Widowed
- 12.9%Divorced
Women who did not give birth in the past 12 months
| Now married: | 65.2% (109) |
| Unmarried: | 34.8% (58) |
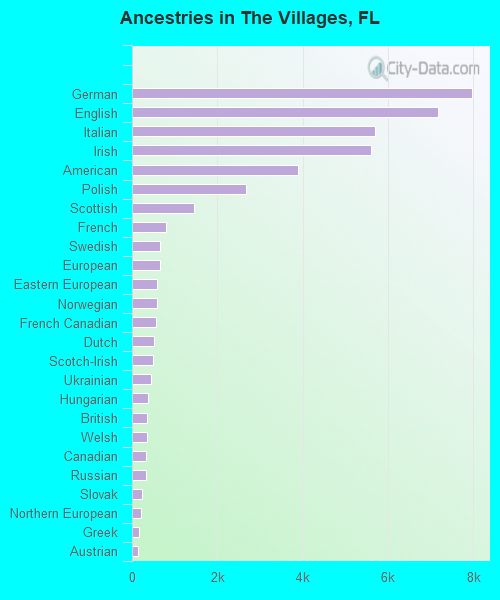
Ancestries in The Villages

- 7,96917.8%German
- 7,16416.0%English
- 5,69712.7%Italian
- 5,61112.5%Irish
- 3,8848.7%American
- 2,6826.0%Polish
- 1,4453.2%Scottish
- 7901.8%French
- 6641.5%Swedish
- 6531.5%European
- 5931.3%Eastern European
- 5821.3%Norwegian
- 5741.3%French Canadian
- 5271.2%Dutch
- 4961.1%Scotch-Irish
- 4381.0%Ukrainian
- 3790.8%Hungarian
- 3480.8%British
- 3400.8%Welsh
- 3380.8%Canadian
- 3180.7%Russian
- 2230.5%Slovak
- 2110.5%Northern European
- 1710.4%Greek
- 1440.3%Austrian
- 1430.3%Danish
- 1350.3%Egyptian
- 1330.3%Czech
- 1240.3%Scandinavian
- 1190.3%Lithuanian
- 1180.3%Swiss
- 750.2%Czechoslovakian
- 700.2%Pennsylvania German
- 620.1%Belgian
- 600.1%Slovene
- 580.1%Maltese
- 530.1%Nigerian
- 420.09%Croatian
- 340.08%Syrian
- 320.07%Bulgarian
- 280.06%Yugoslavian
- 230.05%Romanian
- 230.05%Latvian
- 190.04%African
- 180.04%Serbian
- 150.03%Lebanese
- 140.03%Israeli
- 90.02%Portuguese
- 90.02%Australian
- 90.02%Finnish
- 70.02%Bahamian
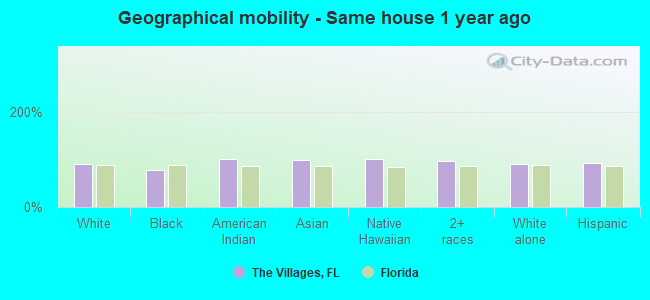
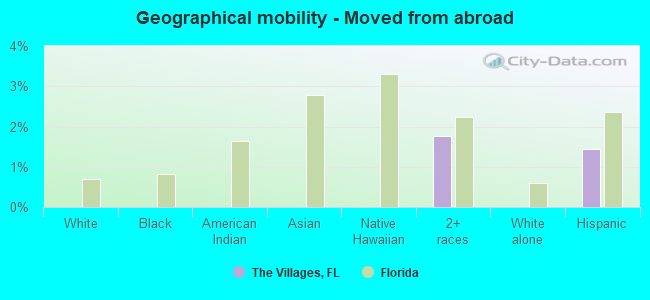
Geographical mobility in The Villages

- Same house 1 year ago
- 68,68591.2%White (Caucasian)
- 21976.8%Black or African American
- 46100.0%American Indian / Alaska Native
- 74799.1%Asian
- 12100.0%Native Hawaiian / Pacific Islander
- 1,48897.4%Two or more races
- 68,32191.2%White alone, not Hispanic / Latino
- 1,10793.0%Hispanic or Latino
-
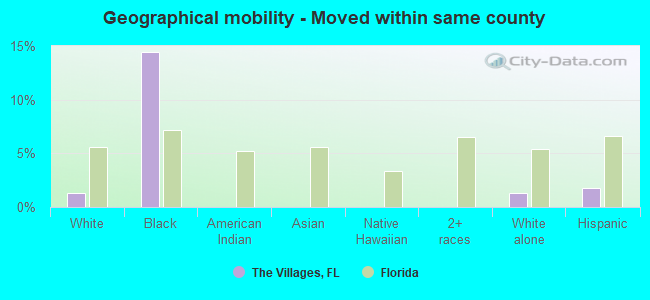
- Moved within same county
- 9691.3%White / Caucasian
- 4114.5%Black or African American
- 9691.3%White alone, not Hispanic / Latino
- 211.7%Hispanic or Latino
-
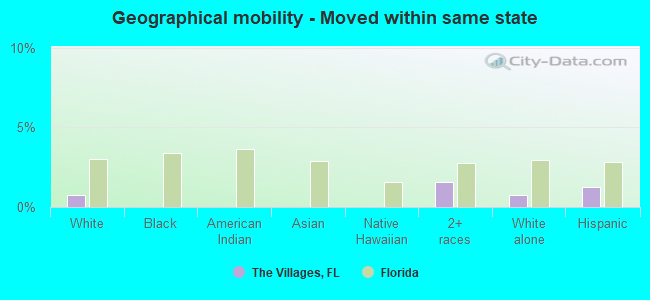
- Moved within same state
- 5710.8%White / Caucasian
- 241.6%Two or more races
- 5710.8%White alone, not Hispanic / Latino
- 151.2%Hispanic or Latino
-
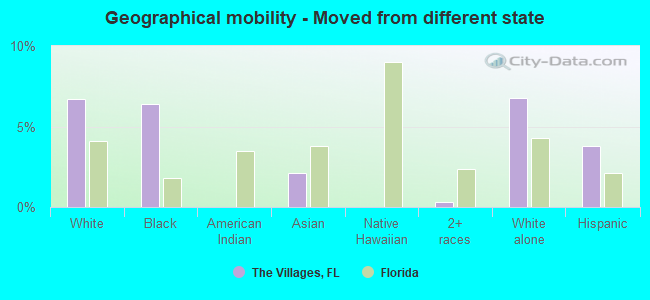
- Moved from different state
- 5,0586.7%White / Caucasian
- 186.4%Black or African American
- 162.1%Asian
- 50.3%Two or more races
- 5,0586.8%White alone, not Hispanic / Latino
- 453.8%Hispanic or Latino
-
- Moved from abroad
- 271.8%Two or more races
- 171.4%Hispanic or Latino
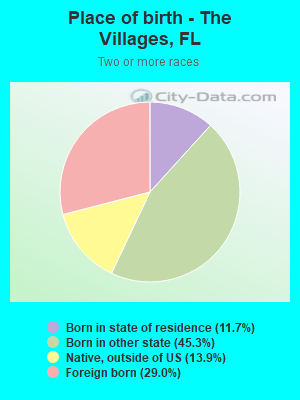
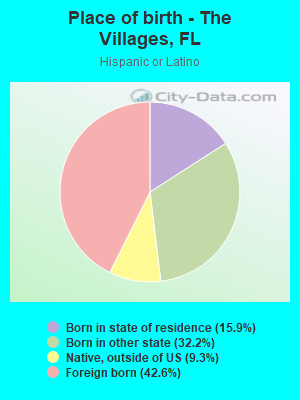
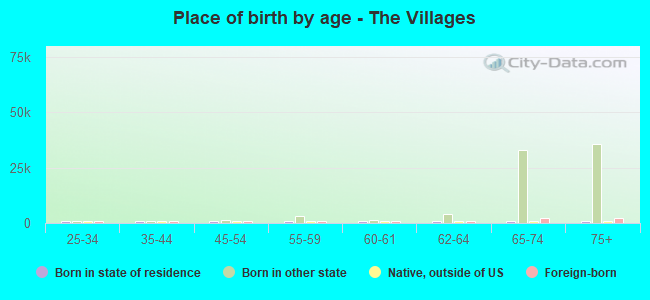
Children Nativity (place of birth) in The Villages
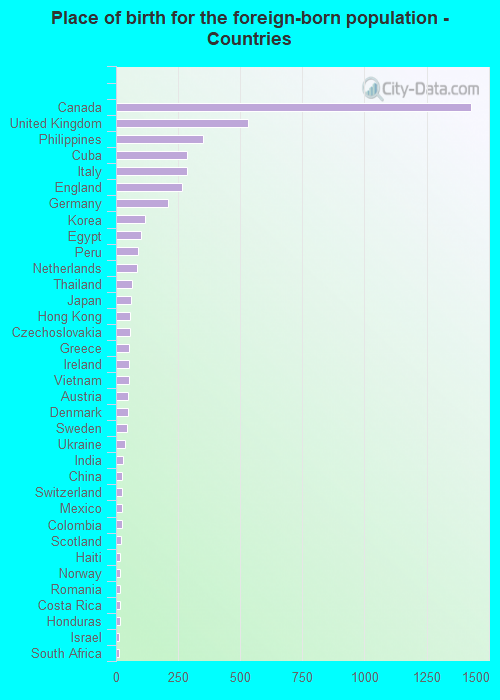
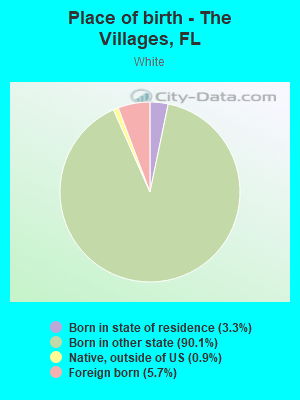
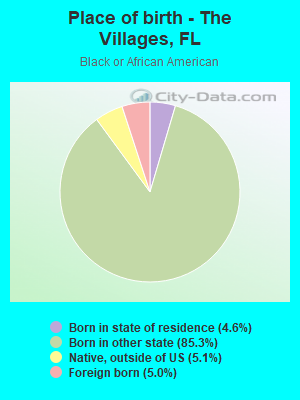
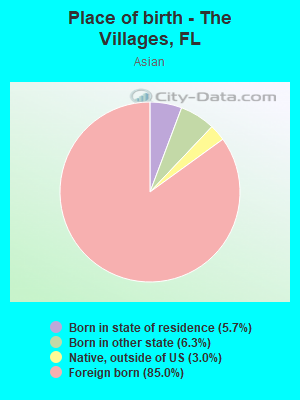
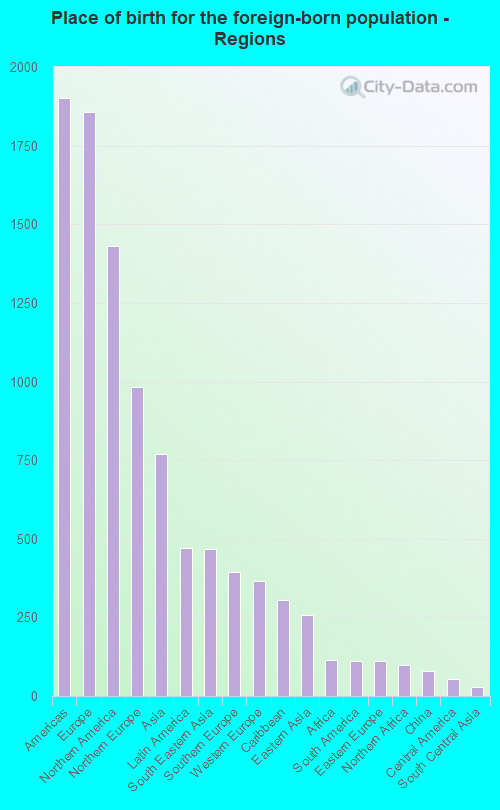
Place of birth for residents in The Villages
![Place of birth for the foreign-born population - Regions]()
- 1,901Americas
- 1,857Europe
- 1,430Northern America
- 983Northern Europe
- 768Asia
- 471Latin America
- 466South Eastern Asia
- 395Southern Europe
- 367Western Europe
- 304Caribbean
- 258Eastern Asia
- 113Africa
- 112South America
- 110Eastern Europe
- 100Northern Africa
- 81China
- 54Central America
- 29South Central Asia
- 14Western Asia
- 13Southern Africa
![Place of birth for the foreign-born population - Countries]()
- 1,430Canada
- 533United Kingdom
- 349Philippines
- 285Cuba
- 284Italy
- 264England
- 209Germany
- 115Korea
- 100Egypt
- 89Peru
- 84Netherlands
- 65Thailand
- 61Japan
- 55Hong Kong
- 55Czechoslovakia
- 54Greece
- 51Ireland
- 51Vietnam
- 50Austria
- 50Denmark
- 46Sweden
- 38Ukraine
- 29India
- 25China
- 23Switzerland
- 23Mexico
- 23Colombia
- 21Scotland
- 18Haiti
- 15Norway
- 15Romania
- 15Costa Rica
- 15Honduras
- 14Israel
- 13South Africa