Races in Tillamook, Oregon (OR) Detailed Stats
Data:
Races - White alone (%)
Races - White alone (% change since 2000)
Races - Black alone (%)
Races - Black alone (% change since 2000)
Races - American Indian alone (%)
Races - American Indian alone (% change since 2000)
Races - Asian alone (%)
Races - Asian alone (% change since 2000)
Races - Hispanic (%)
Races - Hispanic (% change since 2000)
Races - Native Hawaiian and Other Pacific Islander alone (%)
Races - Native Hawaiian and Other Pacific Islander alone (% change since 2000)
Races - Two or more races(%)
Races - Two or more races(% change since 2000)
Races - Other race alone (%)
Races - Other race alone (% change since 2000)
Racial diversity
Place of birth - Born in state of residence (%)
Place of birth - Born in state of residence (%) - White
Place of birth - Born in state of residence (%) - Black or African American
Place of birth - Born in state of residence (%) - Asian
Place of birth - Born in state of residence (%) - Hispanic or Latino
Place of birth - Born in state of residence (%) - American Indian and Alaska Native
Place of birth - Born in state of residence (%) - Multirace
Place of birth - Born in state of residence (%) - Other Race
Place of birth - Born in other state (%)
Place of birth - Born in other state (%) - White
Place of birth - Born in other state (%) - Black or African American
Place of birth - Born in other state (%) - Asian
Place of birth - Born in other state (%) - Hispanic or Latino
Place of birth - Born in other state (%) - American Indian and Alaska Native
Place of birth - Born in other state (%) - Multirace
Place of birth - Born in other state (%) - Other Race
Place of birth - Native, outside of US (%)
Place of birth - Native, outside of US (%) - White
Place of birth - Native, outside of US (%) - Black or African American
Place of birth - Native, outside of US (%) - Asian
Place of birth - Native, outside of US (%) - Hispanic or Latino
Place of birth - Native, outside of US (%) - American Indian and Alaska Native
Place of birth - Native, outside of US (%) - Multirace
Place of birth - Native, outside of US (%) - Other Race
Place of birth - Foreign born (%)
Place of birth - Foreign born (%) - White
Place of birth - Foreign born (%) - Black or African American
Place of birth - Foreign born (%) - Asian
Place of birth - Foreign born (%) - Hispanic or Latino
Place of birth - Foreign born (%) - American Indian and Alaska Native
Place of birth - Foreign born (%) - Multirace
Place of birth - Foreign born (%) - Other Race
Residents speaking English at home (%)
Residents speaking English at home - Born in the United States (%)
Residents speaking English at home - Native, born elsewhere (%)
Residents speaking English at home - Foreign born (%)
Residents speaking Spanish at home (%)
Residents speaking Spanish at home - Born in the United States (%)
Residents speaking Spanish at home - Native, born elsewhere (%)
Residents speaking Spanish at home - Foreign born (%)
Residents speaking other language at home (%)
Residents speaking other language at home - Born in the United States (%)
Residents speaking other language at home - Native, born elsewhere (%)
Residents speaking other language at home - Foreign born (%)
Marital status - Never married (%)
Marital status - Now married (%)
Marital status - Separated (%)
Marital status - Widowed (%)
Marital status - Divorced (%)
Ancestries Reported - Arab (%)
Ancestries Reported - Czech (%)
Ancestries Reported - Danish (%)
Ancestries Reported - Dutch (%)
Ancestries Reported - English (%)
Ancestries Reported - French (%)
Ancestries Reported - French Canadian (%)
Ancestries Reported - German (%)
Ancestries Reported - Greek (%)
Ancestries Reported - Hungarian (%)
Ancestries Reported - Irish (%)
Ancestries Reported - Italian (%)
Ancestries Reported - Lithuanian (%)
Ancestries Reported - Norwegian (%)
Ancestries Reported - Polish (%)
Ancestries Reported - Portuguese (%)
Ancestries Reported - Russian (%)
Ancestries Reported - Scotch-Irish (%)
Ancestries Reported - Scottish (%)
Ancestries Reported - Slovak (%)
Ancestries Reported - Subsaharan African (%)
Ancestries Reported - Swedish (%)
Ancestries Reported - Swiss (%)
Ancestries Reported - Ukrainian (%)
Ancestries Reported - United States (%)
Ancestries Reported - Welsh (%)
Ancestries Reported - West Indian (%)
Ancestries Reported - Other (%)
Geographical mobility - Same house 1 year ago (%)
Geographical mobility - Same house 1 year ago (%) - White
Geographical mobility - Same house 1 year ago (%) - Black or African American
Geographical mobility - Same house 1 year ago (%) - Asian
Geographical mobility - Same house 1 year ago (%) - Hispanic or Latino
Geographical mobility - Same house 1 year ago (%) - American Indian and Alaska Native
Geographical mobility - Same house 1 year ago (%) - Multirace
Geographical mobility - Same house 1 year ago (%) - Other Race
Geographical mobility - Moved within same county (%)
Geographical mobility - Moved within same county (%) - White
Geographical mobility - Moved within same county (%) - Black or African American
Geographical mobility - Moved within same county (%) - Asian
Geographical mobility - Moved within same county (%) - Hispanic or Latino
Geographical mobility - Moved within same county (%) - American Indian and Alaska Native
Geographical mobility - Moved within same county (%) - Multirace
Geographical mobility - Moved within same county (%) - Other Race
Geographical mobility - Moved from different county within same state (%)
Geographical mobility - Moved from different county within same state (%) - White
Geographical mobility - Moved from different county within same state (%) - Black or African American
Geographical mobility - Moved from different county within same state (%) - Asian
Geographical mobility - Moved from different county within same state (%) - Hispanic or Latino
Geographical mobility - Moved from different county within same state (%) - American Indian and Alaska Native
Geographical mobility - Moved from different county within same state (%) - Multirace
Geographical mobility - Moved from different county within same state (%) - Other Race
Geographical mobility - Moved from different state (%)
Geographical mobility - Moved from different state (%) - White
Geographical mobility - Moved from different state (%) - Black or African American
Geographical mobility - Moved from different state (%) - Asian
Geographical mobility - Moved from different state (%) - Hispanic or Latino
Geographical mobility - Moved from different state (%) - American Indian and Alaska Native
Geographical mobility - Moved from different state (%) - Multirace
Geographical mobility - Moved from different state (%) - Other Race
Geographical mobility - Moved from abroad (%)
Geographical mobility - Moved from abroad (%) - White
Geographical mobility - Moved from abroad (%) - Black or African American
Geographical mobility - Moved from abroad (%) - Asian
Geographical mobility - Moved from abroad (%) - Hispanic or Latino
Geographical mobility - Moved from abroad (%) - American Indian and Alaska Native
Geographical mobility - Moved from abroad (%) - Multirace
Geographical mobility - Moved from abroad (%) - Other Race
Place of birth for the foreign-born population - Ireland (%)
Place of birth for the foreign-born population - Denmark (%)
Place of birth for the foreign-born population - Norway (%)
Place of birth for the foreign-born population - Sweden (%)
Place of birth for the foreign-born population - United Kingdom (%)
Place of birth for the foreign-born population - England (%)
Place of birth for the foreign-born population - Scotland (%)
Place of birth for the foreign-born population - Other Northern Europe (%)
Place of birth for the foreign-born population - Austria (%)
Place of birth for the foreign-born population - Belgium (%)
Place of birth for the foreign-born population - France (%)
Place of birth for the foreign-born population - Germany (%)
Place of birth for the foreign-born population - Netherlands (%)
Place of birth for the foreign-born population - Switzerland (%)
Place of birth for the foreign-born population - Other Western Europe (%)
Place of birth for the foreign-born population - Greece (%)
Place of birth for the foreign-born population - Italy (%)
Place of birth for the foreign-born population - Portugal (%)
Place of birth for the foreign-born population - Spain (%)
Place of birth for the foreign-born population - Other Southern Europe (%)
Place of birth for the foreign-born population - Albania (%)
Place of birth for the foreign-born population - Belarus (%)
Place of birth for the foreign-born population - Bosnia and Herzegovina (%)
Place of birth for the foreign-born population - Bulgaria (%)
Place of birth for the foreign-born population - Croatia (%)
Place of birth for the foreign-born population - Czechoslovakia (%)
Place of birth for the foreign-born population - Hungary (%)
Place of birth for the foreign-born population - Latvia (%)
Place of birth for the foreign-born population - Lithuania (%)
Place of birth for the foreign-born population - North Macedonia (Macedonia) (%)
Place of birth for the foreign-born population - Moldova (%)
Place of birth for the foreign-born population - Poland (%)
Place of birth for the foreign-born population - Romania (%)
Place of birth for the foreign-born population - Russia (%)
Place of birth for the foreign-born population - Serbia (%)
Place of birth for the foreign-born population - Ukraine (%)
Place of birth for the foreign-born population - Other Eastern Europe (%)
Place of birth for the foreign-born population - China (%)
Place of birth for the foreign-born population - Hong Kong (%)
Place of birth for the foreign-born population - Taiwan (%)
Place of birth for the foreign-born population - Japan (%)
Place of birth for the foreign-born population - Korea (%)
Place of birth for the foreign-born population - Other Eastern Asia (%)
Place of birth for the foreign-born population - Afghanistan (%)
Place of birth for the foreign-born population - Bangladesh (%)
Place of birth for the foreign-born population - India (%)
Place of birth for the foreign-born population - Iran (%)
Place of birth for the foreign-born population - Kazakhstan (%)
Place of birth for the foreign-born population - Nepal (%)
Place of birth for the foreign-born population - Pakistan (%)
Place of birth for the foreign-born population - Sri Lanka (%)
Place of birth for the foreign-born population - Uzbekistan (%)
Place of birth for the foreign-born population - Other South Central Asia (%)
Place of birth for the foreign-born population - Burma (%)
Place of birth for the foreign-born population - Cambodia (%)
Place of birth for the foreign-born population - Indonesia (%)
Place of birth for the foreign-born population - Laos (%)
Place of birth for the foreign-born population - Malaysia (%)
Place of birth for the foreign-born population - Philippines (%)
Place of birth for the foreign-born population - Singapore (%)
Place of birth for the foreign-born population - Thailand (%)
Place of birth for the foreign-born population - Vietnam (%)
Place of birth for the foreign-born population - Other South Eastern Asia (%)
Place of birth for the foreign-born population - Armenia (%)
Place of birth for the foreign-born population - Iraq (%)
Place of birth for the foreign-born population - Israel (%)
Place of birth for the foreign-born population - Jordan (%)
Place of birth for the foreign-born population - Kuwait (%)
Place of birth for the foreign-born population - Lebanon (%)
Place of birth for the foreign-born population - Saudi Arabia (%)
Place of birth for the foreign-born population - Syria (%)
Place of birth for the foreign-born population - Turkey (%)
Place of birth for the foreign-born population - Yemen (%)
Place of birth for the foreign-born population - Other Western Asia (%)
Place of birth for the foreign-born population - Eritrea (%)
Place of birth for the foreign-born population - Ethiopia (%)
Place of birth for the foreign-born population - Kenya (%)
Place of birth for the foreign-born population - Somalia (%)
Place of birth for the foreign-born population - Uganda (%)
Place of birth for the foreign-born population - Zimbabwe (%)
Place of birth for the foreign-born population - Other Eastern Africa (%)
Place of birth for the foreign-born population - Cameroon (%)
Place of birth for the foreign-born population - Congo (%)
Place of birth for the foreign-born population - Democratic Republic of Congo (Zaire) (%)
Place of birth for the foreign-born population - Other Middle Africa (%)
Place of birth for the foreign-born population - Egypt (%)
Place of birth for the foreign-born population - Morocco (%)
Place of birth for the foreign-born population - Sudan (%)
Place of birth for the foreign-born population - Other Northern Africa (%)
Place of birth for the foreign-born population - South Africa (%)
Place of birth for the foreign-born population - Other Southern Africa (%)
Place of birth for the foreign-born population - Cabo Verde (%)
Place of birth for the foreign-born population - Ghana (%)
Place of birth for the foreign-born population - Liberia (%)
Place of birth for the foreign-born population - Nigeria (%)
Place of birth for the foreign-born population - Senegal (%)
Place of birth for the foreign-born population - Sierra Leone (%)
Place of birth for the foreign-born population - Other Western Africa (%)
Place of birth for the foreign-born population - Australia (%)
Place of birth for the foreign-born population - New Zealand (%)
Place of birth for the foreign-born population - Fiji (%)
Place of birth for the foreign-born population - Micronesia (%)
Place of birth for the foreign-born population - Bahamas (%)
Place of birth for the foreign-born population - Barbados (%)
Place of birth for the foreign-born population - Cuba (%)
Place of birth for the foreign-born population - Dominica (%)
Place of birth for the foreign-born population - Dominican Republic (%)
Place of birth for the foreign-born population - Grenada (%)
Place of birth for the foreign-born population - Haiti (%)
Place of birth for the foreign-born population - Jamaica (%)
Place of birth for the foreign-born population - St. Vincent and the Grenadines (%)
Place of birth for the foreign-born population - Trinidad and Tobago (%)
Place of birth for the foreign-born population - West Indies (%)
Place of birth for the foreign-born population - Other Caribbean (%)
Place of birth for the foreign-born population - Belize (%)
Place of birth for the foreign-born population - Costa Rica (%)
Place of birth for the foreign-born population - El Salvador (%)
Place of birth for the foreign-born population - Guatemala (%)
Place of birth for the foreign-born population - Honduras (%)
Place of birth for the foreign-born population - Mexico (%)
Place of birth for the foreign-born population - Nicaragua (%)
Place of birth for the foreign-born population - Panama (%)
Place of birth for the foreign-born population - Other Central America (%)
Place of birth for the foreign-born population - Argentina (%)
Place of birth for the foreign-born population - Bolivia (%)
Place of birth for the foreign-born population - Brazil (%)
Place of birth for the foreign-born population - Chile (%)
Place of birth for the foreign-born population - Colombia (%)
Place of birth for the foreign-born population - Ecuador (%)
Place of birth for the foreign-born population - Guyana (%)
Place of birth for the foreign-born population - Peru (%)
Place of birth for the foreign-born population - Uruguay (%)
Place of birth for the foreign-born population - Venezuela (%)
Place of birth for the foreign-born population - Other South America (%)
Place of birth for the foreign-born population - Canada (%)
Place of birth for the foreign-born population - Other Northern America (%)
Place of birth for the foreign-born population - Other (%)
Latest news about races in Tillamook, OR collected exclusively by city-data.com from local newspapers, TV, and radio stations
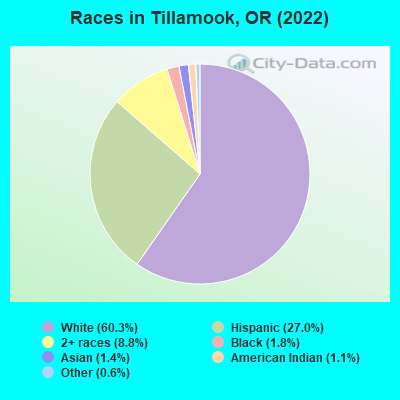
According to 2022 data, the most numerous races in Tillamook, OR are White alone (3,150 residents), Hispanic (1,413 residents), and Two or more races (462 residents). 76.0% of Tillamook residents speak English at home. 13.0% of Tillamook, OR residents are foreign-born (9.7% born in Latin America, 1.3% born in Asia), which is 30.7% greater than the foreign-born rate of 9.0% across the entire state of Oregon.
Race distribution in Tillamook
2000 2022
2,857,616 83.5% White alone 275,314 8.0% Hispanic 100,333 2.9% Asian alone 82,733 2.4% Two or more races 53,325 1.6% Black alone 40,130 1.2% American Indian alone 7,398 0.2% Native Hawaiian and Other 4,550 0.1% Other race alone
3,037,571 71.6% White alone 609,538 14.4% Hispanic 252,744 6.0% Two or more races 191,283 4.5% Asian alone 78,228 1.8% Black alone 29,399 0.7% American Indian alone 25,731 0.6% Other race alone 15,643 0.4% Native Hawaiian and Other
Income and house value in Tillamook Median household income in 2022 $46,155 White non-Hispanic householders$67,978 Some other race householders$66,918 Two or more races householders$102,091 Hispanic or Latino race householdersMedian 2022 house value $288,287 White Non-Hispanic householders$481,466 Some other race householders$270,510 Two or more races householders$430,505 Hispanic or Latino householders
Median age by race in Tillamook
42.5 Median age for White residents38.1 47.0 -664,634,145.7 Median age for Black or African American residents-692,929,292.2 -625,514,402.7 37.0 Median age for American Indian / Alaska Native residents-643,410,852.1 -752,688,171.3 64.6 Median age for Asian residents-696,883,852.0 -681,895,092.4 -764,705,881.6 Median age for Native Hawaiian / Pacific Islander residents-764,119,600.6 -774,891,774.1 15.1 Median age for Other race residents15.0 14.6 20.6 Median age for Two or more races residents20.8 16.1 47.8 Median age for White alone residents41.3 50.3 17.6 Median age for Hispanic or Latino residents19.9 13.4
Owner/renter occupied households by race in Tillamook
House owners and renters - White residents 800 46.5% Owner occupied920 53.5% Renter occupiedHouse owners and renters - Black or African American residents 104 100.0% Renter occupiedHouse owners and renters - American Indian / Alaska Native residents 19 100.0% Renter occupiedHouse owners and renters - Asian residents 33 100.0% Owner occupiedHouse owners and renters - Other race residents 24 31.4% Owner occupied53 68.6% Renter occupiedHouse owners and renters - Two or more races residents 74 42.1% Owner occupied101 57.9% Renter occupiedHouse owners and renters - White alone residents 761 46.6% Owner occupied871 53.4% Renter occupiedHouse owners and renters - Hispanic or Latino residents 69 34.6% Owner occupied130 65.4% Renter occupied
Language usage in Tillamook
English speakers - Total 76.0% of residents of Tillamook speak English at home.
20.1% of residents speak Spanish at home 261 26.2% Speak English very well735 73.8% Speak English less than very well4.6% of residents speak other language at home 195 85.9% Speak English very well32 14.1% Speak English less than very well
English speakers - Born in the United States 93.1% of residents of Tillamook speak English at home.
3.4% of residents speak Spanish at home 36 65.5% Speak English very well19 34.5% Speak English less than very well3.3% of residents speak other language at home 53 100.0% Speak English very well
All residents speak only English at home
English speakers - Foreign-born 14.7% of residents of Tillamook speak English at home.
80.2% of residents speak Spanish at home 69 12.6% Speak English very well477 87.4% Speak English less than very well8.8% of residents speak other language at home 28 46.7% Speak English very well32 53.3% Speak English less than very well
White (Caucasian) - Speak only English Native:
89.2% (2,826)Foreign-born:
32.3% (85)
White (Caucasian) - Speak another language Native:
9.2% (290)Foreign-born:
65.3% (172)
Other race - Speak another language Native:
63.1% (178)Foreign-born:
100.0% (282)
Two or more races - Speak another language Native:
9.0% (69)Foreign-born:
100.0% (38)
White alone - Speak only English Native:
95.7% (2,805)Foreign-born:
100.0% (88)
Hispanic or Latino - Speak another language Native:
54.2% (403)Foreign-born:
99.4% (542)
Foreign-born residents in Tillamook 679 residents are foreign born (9.7% Latin America , 1.3% Asia ).
This city:
13.0%Oregon:
9.8%
Marital status for residents in Tillamook Marital status - White (Caucasian) population 15 years and over
Males 27.2% Never married42.3% Now married2.2% Separated8.1% Widowed20.2% DivorcedFemales 19.4% Never married33.0% Now married1.4% Separated14.7% Widowed31.5% DivorcedWomen who gave birth in the past 12 months Now married:
11.1% (4)Unmarried:
88.9% (30)
Women who did not give birth in the past 12 months Now married:
42.7% (330)Unmarried:
57.3% (444)
Marital status - American Indian / Alaska Native population 15 years and over
Males 0.0% Never married100.0% Now married0.0% Separated0.0% Widowed0.0% DivorcedFemales 43.6% Never married56.4% Now married0.0% Separated0.0% Widowed0.0% DivorcedWomen who did not give birth in the past 12 months Now married:
56.4% (24)Unmarried:
43.6% (19)
Marital status - Asian population 15 years and over
Males 0.0% Never married100.0% Now married0.0% Separated0.0% Widowed0.0% DivorcedFemales 0.0% Never married100.0% Now married0.0% Separated0.0% Widowed0.0% DivorcedMarital status - Other race population 15 years and over
Males 39.4% Never married31.8% Now married0.0% Separated0.0% Widowed28.8% DivorcedFemales 50.7% Never married49.3% Now married0.0% Separated0.0% Widowed0.0% DivorcedWomen who gave birth in the past 12 months Now married:
100.0% (46)Unmarried:
0.0% (0)
Women who did not give birth in the past 12 months Now married:
20.9% (25)Unmarried:
79.1% (93)
Marital status - Two or more races population 15 years and over
Males 81.9% Never married1.5% Now married0.0% Separated0.0% Widowed16.6% DivorcedFemales 27.6% Never married21.2% Now married0.0% Separated21.2% Widowed30.0% DivorcedWomen who did not give birth in the past 12 months Now married:
15.1% (18)Unmarried:
84.9% (99)
Marital status - White alone, not Hispanic / Latino population 15 years and over
Males 28.3% Never married39.8% Now married2.5% Separated9.3% Widowed20.1% DivorcedFemales 19.2% Never married28.9% Now married1.6% Separated16.1% Widowed34.3% DivorcedWomen who gave birth in the past 12 months Now married:
11.1% (4)Unmarried:
88.9% (31)
Women who did not give birth in the past 12 months Now married:
35.5% (238)Unmarried:
64.5% (432)
Marital status - Hispanic or Latino population 15 years and over
Males 52.0% Never married29.4% Now married0.0% Separated0.0% Widowed18.6% DivorcedFemales 35.6% Never married64.4% Now married0.0% Separated0.0% Widowed0.0% DivorcedWomen who gave birth in the past 12 months Now married:
100.0% (36)Unmarried:
0.0% (0)
Women who did not give birth in the past 12 months Now married:
62.1% (133)Unmarried:
37.9% (81)
Ancestries in Tillamook
279 11.1% American257 10.2% Irish174 6.9% English151 6.0% German73 2.9% Scandinavian69 2.7% Polish52 2.1% Norwegian36 1.4% Scotch-Irish31 1.2% European24 1.0% British20 0.8% Scottish19 0.8% Swiss9 0.4% Czechoslovakian9 0.4% French8 0.3% Finnish5 0.2% Dutch5 0.2% Italian3 0.1% Eastern European2 0.08% Danish
Children Nativity (place of birth) in Tillamook
Children under 6 years - Living with two parents Both parents native 155 100.0% NativeBoth parents foreign-born 65 100.0% NativeOne native, one foreign-born parent 19 100.0% NativeChildren under 6 years - Living with one parent Native parent 60 100.0% NativeChildren 6 to 17 years - Living with two parents Both parents native 226 100.0% NativeBoth parents foreign-born 114 50.2% Native113 49.8% Foreign-bornOne native, one foreign-born parent 86 100.0% NativeChildren 6 to 17 years - Living with one parent Native parent 435 100.0% Native
Grandparents responsible for own grandchildren in Tillamook
Grandparents (30 to 59 years) Two or more races 31 100.0% Not responsible for grandchildrenHispanic or Latino 15 100.0% Not responsible for grandchildren
Grandparents (60 years and over)