Races in Timberlane, Louisiana (LA) Detailed Stats
Data:
Races - White alone (%)
Races - White alone (% change since 2000)
Races - Black alone (%)
Races - Black alone (% change since 2000)
Races - American Indian alone (%)
Races - American Indian alone (% change since 2000)
Races - Asian alone (%)
Races - Asian alone (% change since 2000)
Races - Hispanic (%)
Races - Hispanic (% change since 2000)
Races - Native Hawaiian and Other Pacific Islander alone (%)
Races - Native Hawaiian and Other Pacific Islander alone (% change since 2000)
Races - Two or more races(%)
Races - Two or more races(% change since 2000)
Races - Other race alone (%)
Races - Other race alone (% change since 2000)
Racial diversity
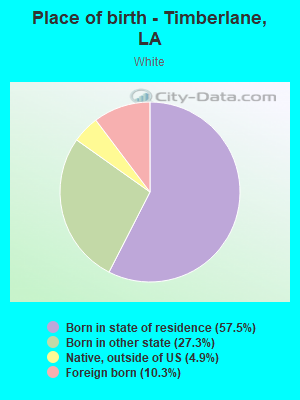
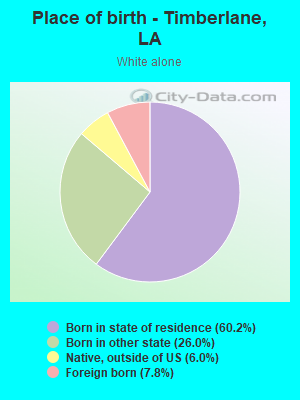
Place of birth - Born in state of residence (%)
Place of birth - Born in state of residence (%) - White
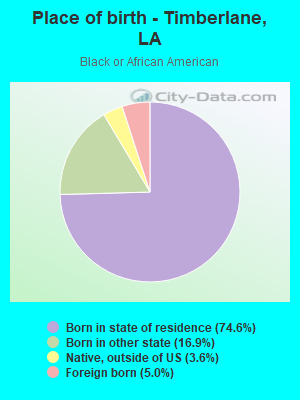
Place of birth - Born in state of residence (%) - Black or African American
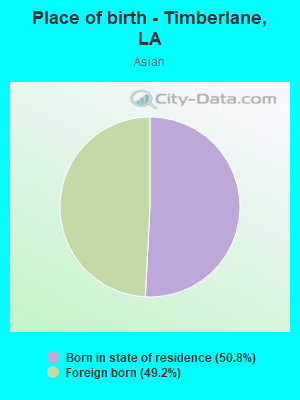
Place of birth - Born in state of residence (%) - Asian
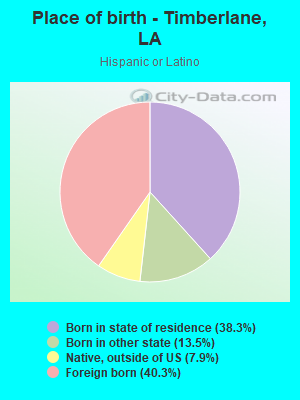
Place of birth - Born in state of residence (%) - Hispanic or Latino
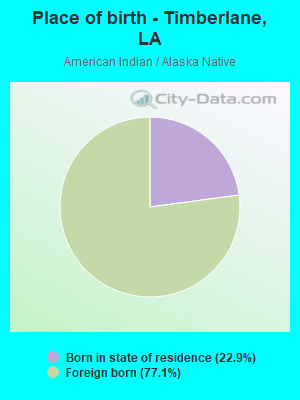
Place of birth - Born in state of residence (%) - American Indian and Alaska Native
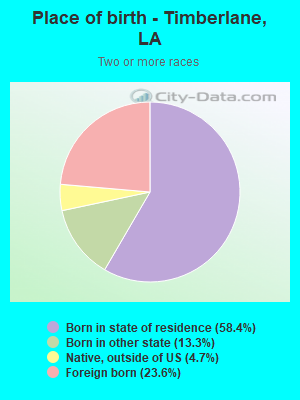
Place of birth - Born in state of residence (%) - Multirace
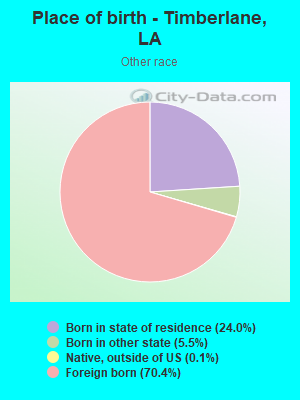
Place of birth - Born in state of residence (%) - Other Race
Place of birth - Born in other state (%)
Place of birth - Born in other state (%) - White
Place of birth - Born in other state (%) - Black or African American
Place of birth - Born in other state (%) - Asian
Place of birth - Born in other state (%) - Hispanic or Latino
Place of birth - Born in other state (%) - American Indian and Alaska Native
Place of birth - Born in other state (%) - Multirace
Place of birth - Born in other state (%) - Other Race
Place of birth - Native, outside of US (%)
Place of birth - Native, outside of US (%) - White
Place of birth - Native, outside of US (%) - Black or African American
Place of birth - Native, outside of US (%) - Asian
Place of birth - Native, outside of US (%) - Hispanic or Latino
Place of birth - Native, outside of US (%) - American Indian and Alaska Native
Place of birth - Native, outside of US (%) - Multirace
Place of birth - Native, outside of US (%) - Other Race
Place of birth - Foreign born (%)
Place of birth - Foreign born (%) - White
Place of birth - Foreign born (%) - Black or African American
Place of birth - Foreign born (%) - Asian
Place of birth - Foreign born (%) - Hispanic or Latino
Place of birth - Foreign born (%) - American Indian and Alaska Native
Place of birth - Foreign born (%) - Multirace
Place of birth - Foreign born (%) - Other Race
Residents speaking English at home (%)
Residents speaking English at home - Born in the United States (%)
Residents speaking English at home - Native, born elsewhere (%)
Residents speaking English at home - Foreign born (%)
Residents speaking Spanish at home (%)
Residents speaking Spanish at home - Born in the United States (%)
Residents speaking Spanish at home - Native, born elsewhere (%)
Residents speaking Spanish at home - Foreign born (%)
Residents speaking other language at home (%)
Residents speaking other language at home - Born in the United States (%)
Residents speaking other language at home - Native, born elsewhere (%)
Residents speaking other language at home - Foreign born (%)
Marital status - Never married (%)
Marital status - Now married (%)
Marital status - Separated (%)
Marital status - Widowed (%)
Marital status - Divorced (%)
Ancestries Reported - Arab (%)
Ancestries Reported - Czech (%)
Ancestries Reported - Danish (%)
Ancestries Reported - Dutch (%)
Ancestries Reported - English (%)
Ancestries Reported - French (%)
Ancestries Reported - French Canadian (%)
Ancestries Reported - German (%)
Ancestries Reported - Greek (%)
Ancestries Reported - Hungarian (%)
Ancestries Reported - Irish (%)
Ancestries Reported - Italian (%)
Ancestries Reported - Lithuanian (%)
Ancestries Reported - Norwegian (%)
Ancestries Reported - Polish (%)
Ancestries Reported - Portuguese (%)
Ancestries Reported - Russian (%)
Ancestries Reported - Scotch-Irish (%)
Ancestries Reported - Scottish (%)
Ancestries Reported - Slovak (%)
Ancestries Reported - Subsaharan African (%)
Ancestries Reported - Swedish (%)
Ancestries Reported - Swiss (%)
Ancestries Reported - Ukrainian (%)
Ancestries Reported - United States (%)
Ancestries Reported - Welsh (%)
Ancestries Reported - West Indian (%)
Ancestries Reported - Other (%)
Geographical mobility - Same house 1 year ago (%)
Geographical mobility - Same house 1 year ago (%) - White
Geographical mobility - Same house 1 year ago (%) - Black or African American
Geographical mobility - Same house 1 year ago (%) - Asian
Geographical mobility - Same house 1 year ago (%) - Hispanic or Latino
Geographical mobility - Same house 1 year ago (%) - American Indian and Alaska Native
Geographical mobility - Same house 1 year ago (%) - Multirace
Geographical mobility - Same house 1 year ago (%) - Other Race
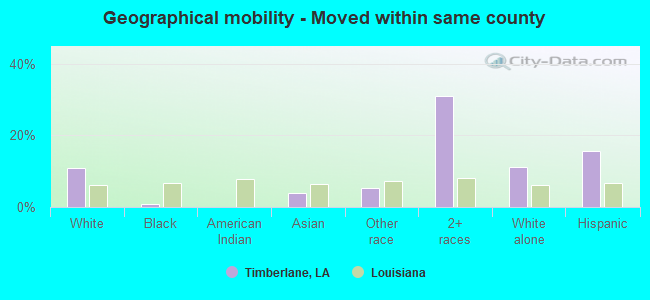
Geographical mobility - Moved within same county (%)
Geographical mobility - Moved within same county (%) - White
Geographical mobility - Moved within same county (%) - Black or African American
Geographical mobility - Moved within same county (%) - Asian
Geographical mobility - Moved within same county (%) - Hispanic or Latino
Geographical mobility - Moved within same county (%) - American Indian and Alaska Native
Geographical mobility - Moved within same county (%) - Multirace
Geographical mobility - Moved within same county (%) - Other Race
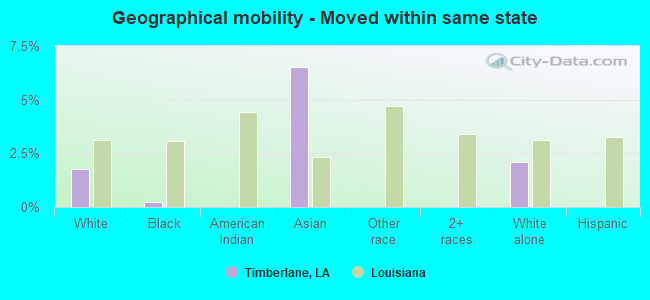
Geographical mobility - Moved from different county within same state (%)
Geographical mobility - Moved from different county within same state (%) - White
Geographical mobility - Moved from different county within same state (%) - Black or African American
Geographical mobility - Moved from different county within same state (%) - Asian
Geographical mobility - Moved from different county within same state (%) - Hispanic or Latino
Geographical mobility - Moved from different county within same state (%) - American Indian and Alaska Native
Geographical mobility - Moved from different county within same state (%) - Multirace
Geographical mobility - Moved from different county within same state (%) - Other Race
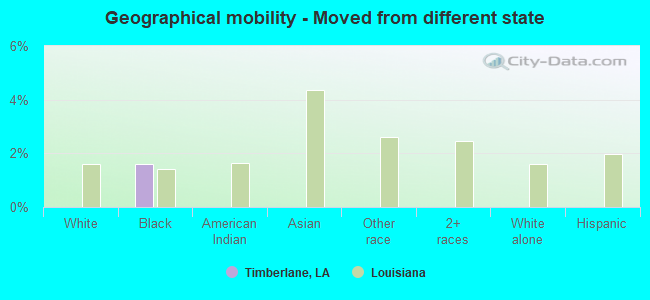
Geographical mobility - Moved from different state (%)
Geographical mobility - Moved from different state (%) - White
Geographical mobility - Moved from different state (%) - Black or African American
Geographical mobility - Moved from different state (%) - Asian
Geographical mobility - Moved from different state (%) - Hispanic or Latino
Geographical mobility - Moved from different state (%) - American Indian and Alaska Native
Geographical mobility - Moved from different state (%) - Multirace
Geographical mobility - Moved from different state (%) - Other Race
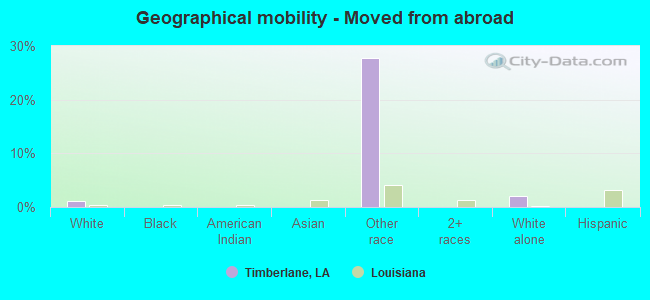
Geographical mobility - Moved from abroad (%)
Geographical mobility - Moved from abroad (%) - White
Geographical mobility - Moved from abroad (%) - Black or African American
Geographical mobility - Moved from abroad (%) - Asian
Geographical mobility - Moved from abroad (%) - Hispanic or Latino
Geographical mobility - Moved from abroad (%) - American Indian and Alaska Native
Geographical mobility - Moved from abroad (%) - Multirace
Geographical mobility - Moved from abroad (%) - Other Race
Place of birth for the foreign-born population - Ireland (%)
Place of birth for the foreign-born population - Denmark (%)
Place of birth for the foreign-born population - Norway (%)
Place of birth for the foreign-born population - Sweden (%)
Place of birth for the foreign-born population - United Kingdom (%)
Place of birth for the foreign-born population - England (%)
Place of birth for the foreign-born population - Scotland (%)
Place of birth for the foreign-born population - Other Northern Europe (%)
Place of birth for the foreign-born population - Austria (%)
Place of birth for the foreign-born population - Belgium (%)
Place of birth for the foreign-born population - France (%)
Place of birth for the foreign-born population - Germany (%)
Place of birth for the foreign-born population - Netherlands (%)
Place of birth for the foreign-born population - Switzerland (%)
Place of birth for the foreign-born population - Other Western Europe (%)
Place of birth for the foreign-born population - Greece (%)
Place of birth for the foreign-born population - Italy (%)
Place of birth for the foreign-born population - Portugal (%)
Place of birth for the foreign-born population - Spain (%)
Place of birth for the foreign-born population - Other Southern Europe (%)
Place of birth for the foreign-born population - Albania (%)
Place of birth for the foreign-born population - Belarus (%)
Place of birth for the foreign-born population - Bosnia and Herzegovina (%)
Place of birth for the foreign-born population - Bulgaria (%)
Place of birth for the foreign-born population - Croatia (%)
Place of birth for the foreign-born population - Czechoslovakia (%)
Place of birth for the foreign-born population - Hungary (%)
Place of birth for the foreign-born population - Latvia (%)
Place of birth for the foreign-born population - Lithuania (%)
Place of birth for the foreign-born population - North Macedonia (Macedonia) (%)
Place of birth for the foreign-born population - Moldova (%)
Place of birth for the foreign-born population - Poland (%)
Place of birth for the foreign-born population - Romania (%)
Place of birth for the foreign-born population - Russia (%)
Place of birth for the foreign-born population - Serbia (%)
Place of birth for the foreign-born population - Ukraine (%)
Place of birth for the foreign-born population - Other Eastern Europe (%)
Place of birth for the foreign-born population - China (%)
Place of birth for the foreign-born population - Hong Kong (%)
Place of birth for the foreign-born population - Taiwan (%)
Place of birth for the foreign-born population - Japan (%)
Place of birth for the foreign-born population - Korea (%)
Place of birth for the foreign-born population - Other Eastern Asia (%)
Place of birth for the foreign-born population - Afghanistan (%)
Place of birth for the foreign-born population - Bangladesh (%)
Place of birth for the foreign-born population - India (%)
Place of birth for the foreign-born population - Iran (%)
Place of birth for the foreign-born population - Kazakhstan (%)
Place of birth for the foreign-born population - Nepal (%)
Place of birth for the foreign-born population - Pakistan (%)
Place of birth for the foreign-born population - Sri Lanka (%)
Place of birth for the foreign-born population - Uzbekistan (%)
Place of birth for the foreign-born population - Other South Central Asia (%)
Place of birth for the foreign-born population - Burma (%)
Place of birth for the foreign-born population - Cambodia (%)
Place of birth for the foreign-born population - Indonesia (%)
Place of birth for the foreign-born population - Laos (%)
Place of birth for the foreign-born population - Malaysia (%)
Place of birth for the foreign-born population - Philippines (%)
Place of birth for the foreign-born population - Singapore (%)
Place of birth for the foreign-born population - Thailand (%)
Place of birth for the foreign-born population - Vietnam (%)
Place of birth for the foreign-born population - Other South Eastern Asia (%)
Place of birth for the foreign-born population - Armenia (%)
Place of birth for the foreign-born population - Iraq (%)
Place of birth for the foreign-born population - Israel (%)
Place of birth for the foreign-born population - Jordan (%)
Place of birth for the foreign-born population - Kuwait (%)
Place of birth for the foreign-born population - Lebanon (%)
Place of birth for the foreign-born population - Saudi Arabia (%)
Place of birth for the foreign-born population - Syria (%)
Place of birth for the foreign-born population - Turkey (%)
Place of birth for the foreign-born population - Yemen (%)
Place of birth for the foreign-born population - Other Western Asia (%)
Place of birth for the foreign-born population - Eritrea (%)
Place of birth for the foreign-born population - Ethiopia (%)
Place of birth for the foreign-born population - Kenya (%)
Place of birth for the foreign-born population - Somalia (%)
Place of birth for the foreign-born population - Uganda (%)
Place of birth for the foreign-born population - Zimbabwe (%)
Place of birth for the foreign-born population - Other Eastern Africa (%)
Place of birth for the foreign-born population - Cameroon (%)
Place of birth for the foreign-born population - Congo (%)
Place of birth for the foreign-born population - Democratic Republic of Congo (Zaire) (%)
Place of birth for the foreign-born population - Other Middle Africa (%)
Place of birth for the foreign-born population - Egypt (%)
Place of birth for the foreign-born population - Morocco (%)
Place of birth for the foreign-born population - Sudan (%)
Place of birth for the foreign-born population - Other Northern Africa (%)
Place of birth for the foreign-born population - South Africa (%)
Place of birth for the foreign-born population - Other Southern Africa (%)
Place of birth for the foreign-born population - Cabo Verde (%)
Place of birth for the foreign-born population - Ghana (%)
Place of birth for the foreign-born population - Liberia (%)
Place of birth for the foreign-born population - Nigeria (%)
Place of birth for the foreign-born population - Senegal (%)
Place of birth for the foreign-born population - Sierra Leone (%)
Place of birth for the foreign-born population - Other Western Africa (%)
Place of birth for the foreign-born population - Australia (%)
Place of birth for the foreign-born population - New Zealand (%)
Place of birth for the foreign-born population - Fiji (%)
Place of birth for the foreign-born population - Micronesia (%)
Place of birth for the foreign-born population - Bahamas (%)
Place of birth for the foreign-born population - Barbados (%)
Place of birth for the foreign-born population - Cuba (%)
Place of birth for the foreign-born population - Dominica (%)
Place of birth for the foreign-born population - Dominican Republic (%)
Place of birth for the foreign-born population - Grenada (%)
Place of birth for the foreign-born population - Haiti (%)
Place of birth for the foreign-born population - Jamaica (%)
Place of birth for the foreign-born population - St. Vincent and the Grenadines (%)
Place of birth for the foreign-born population - Trinidad and Tobago (%)
Place of birth for the foreign-born population - West Indies (%)
Place of birth for the foreign-born population - Other Caribbean (%)
Place of birth for the foreign-born population - Belize (%)
Place of birth for the foreign-born population - Costa Rica (%)
Place of birth for the foreign-born population - El Salvador (%)
Place of birth for the foreign-born population - Guatemala (%)
Place of birth for the foreign-born population - Honduras (%)
Place of birth for the foreign-born population - Mexico (%)
Place of birth for the foreign-born population - Nicaragua (%)
Place of birth for the foreign-born population - Panama (%)
Place of birth for the foreign-born population - Other Central America (%)
Place of birth for the foreign-born population - Argentina (%)
Place of birth for the foreign-born population - Bolivia (%)
Place of birth for the foreign-born population - Brazil (%)
Place of birth for the foreign-born population - Chile (%)
Place of birth for the foreign-born population - Colombia (%)
Place of birth for the foreign-born population - Ecuador (%)
Place of birth for the foreign-born population - Guyana (%)
Place of birth for the foreign-born population - Peru (%)
Place of birth for the foreign-born population - Uruguay (%)
Place of birth for the foreign-born population - Venezuela (%)
Place of birth for the foreign-born population - Other South America (%)
Place of birth for the foreign-born population - Canada (%)
Place of birth for the foreign-born population - Other Northern America (%)
Place of birth for the foreign-born population - Other (%)
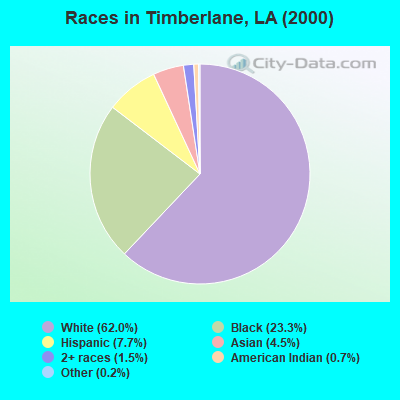
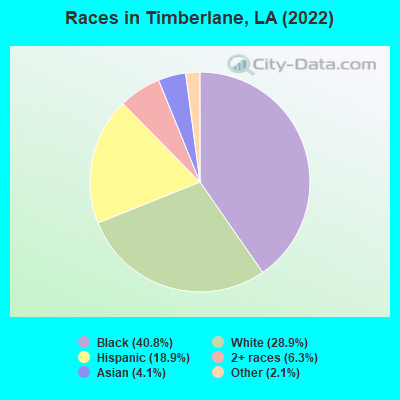
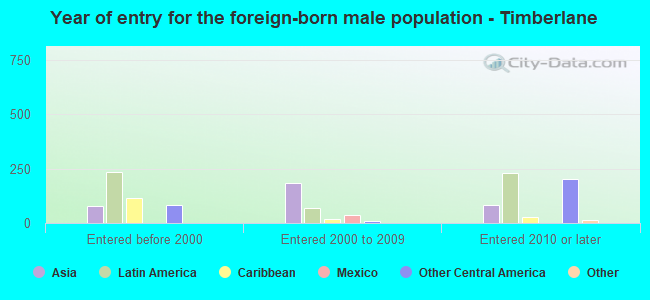
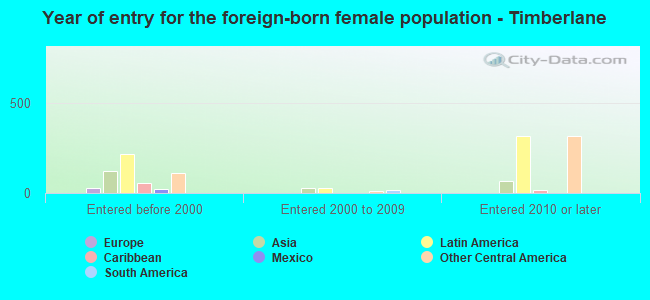
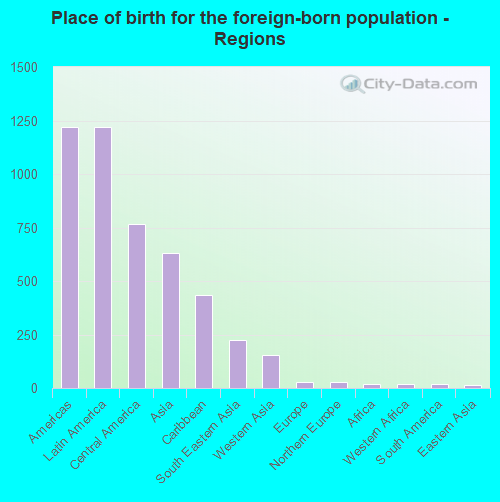
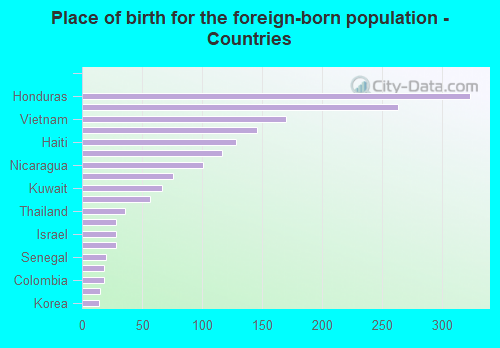
According to 2022 data, the most numerous races in Timberlane, LA are White alone (3,083 residents), Black alone (4,350 residents), and Hispanic (2,010 residents). 69.0% of Timberlane residents speak English at home. 17.8% of Timberlane, LA residents are foreign-born (11.0% born in Latin America, 5.6% born in Asia), which is 77.5% greater than the foreign-born rate of 4.0% across the entire state of Louisiana.
Race distribution in Timberlane
2000 2022
2,794,391 62.5% White alone 1,443,390 32.3% Black alone 107,738 2.4% Hispanic 54,256 1.2% Asian alone 39,260 0.9% Two or more races 24,129 0.5% American Indian alone 4,736 0.1% Other race alone 1,076 0.02% Native Hawaiian and Other
2,603,221 56.7% White alone 1,420,055 30.9% Black alone 262,213 5.7% Hispanic 183,270 4.0% Two or more races 81,169 1.8% Asian alone 19,991 0.4% American Indian alone 18,043 0.4% Other race alone 2,279 0.05% Native Hawaiian and Other
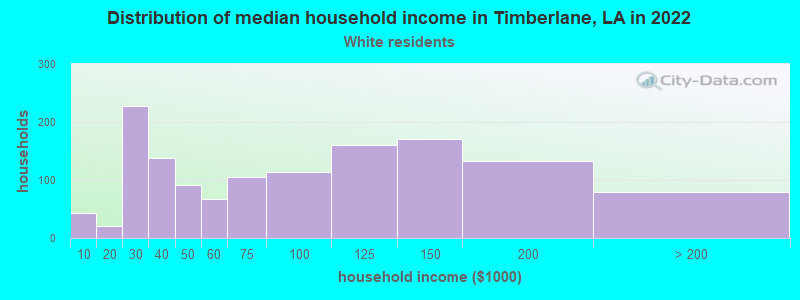
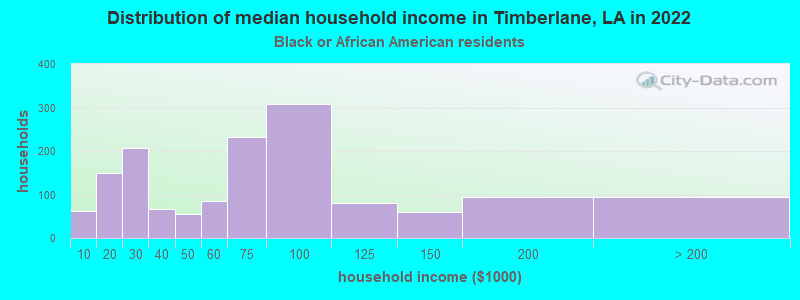
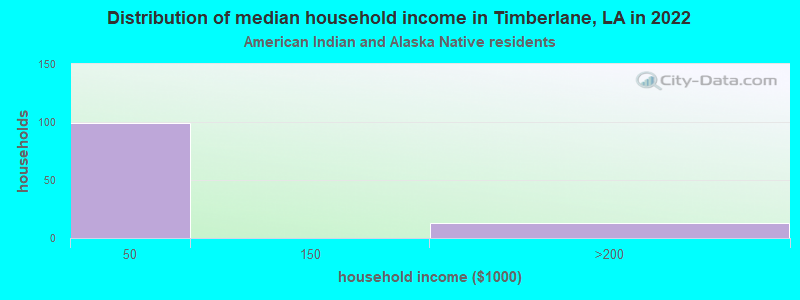
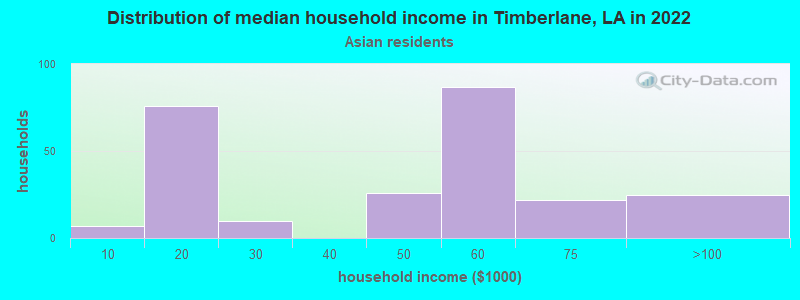
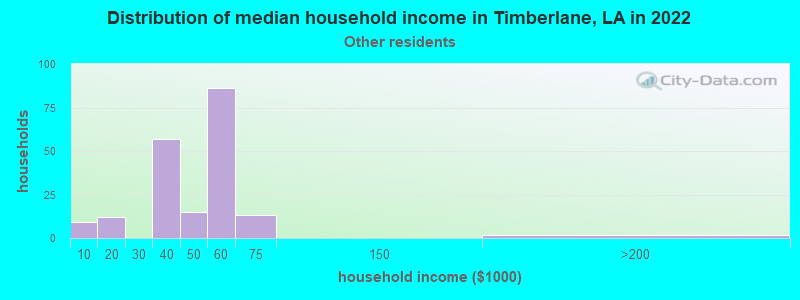
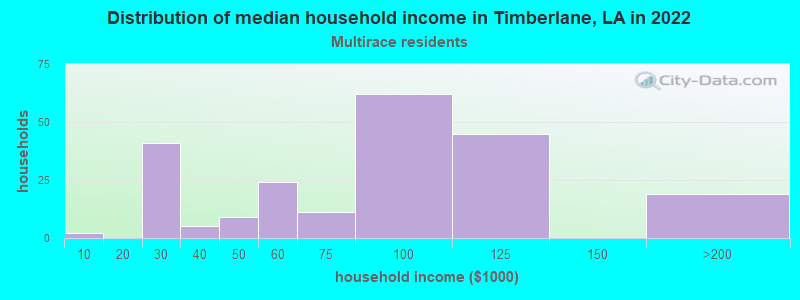
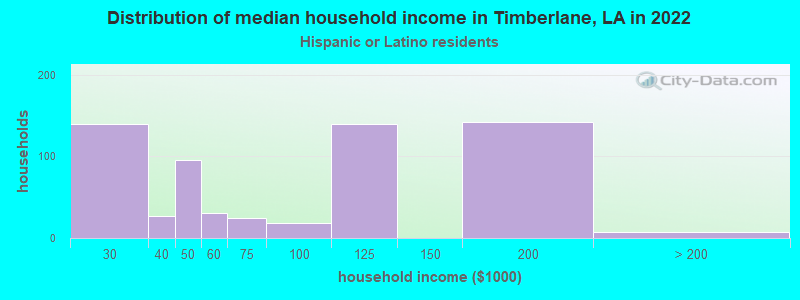
Income and house value in Timberlane Median household income in 2022 $66,108 White non-Hispanic householders$65,996 Black householders$45,041 Asian householders$43,781 Some other race householders$97,364 Two or more races householders$49,114 Hispanic or Latino race householdersMedian 2022 house value $235,405 White Non-Hispanic householders$201,708 Black or African American householders$263,251 American Indian or Alaska Native householders $198,900 Asian householders$128,700 Native Hawaiian and other Pacific Islander householders$167,076 Some other race householders$380,251 Two or more races householders$172,224 Hispanic or Latino householders
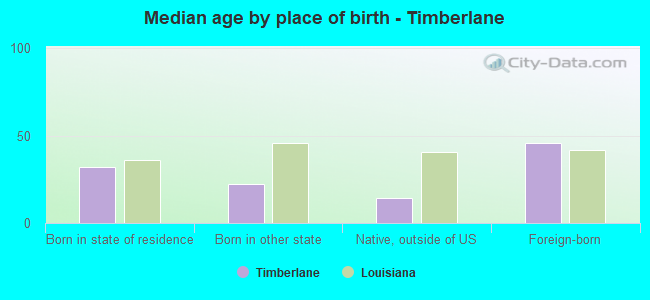
Median age by race in Timberlane
40.4 Median age for White residents39.5 42.6 33.8 Median age for Black or African American residents38.6 30.5 63.0 Median age for American Indian / Alaska Native residents49.6 82.3 32.4 Median age for Asian residents47.0 31.7 -1,031,509,120.0 Median age for Native Hawaiian / Pacific Islander residents-868,167,201.7 -599,999,999.4 37.3 Median age for Other race residents13.3 46.5 24.0 Median age for Two or more races residents22.4 26.2 39.9 Median age for White alone residents39.2 41.6 28.2 Median age for Hispanic or Latino residents37.9 26.5
Owner/renter occupied households by race in Timberlane
House owners and renters - White residents 1,041 75.9% Owner occupied331 24.1% Renter occupiedHouse owners and renters - Black or African American residents 1,183 74.3% Owner occupied410 25.7% Renter occupiedHouse owners and renters - American Indian / Alaska Native residents 47 100.0% Owner occupiedHouse owners and renters - Asian residents 115 53.2% Owner occupied101 46.8% Renter occupiedHouse owners and renters - Other race residents 93 53.8% Owner occupied80 46.2% Renter occupiedHouse owners and renters - Two or more races residents 239 90.2% Owner occupied26 9.8% Renter occupiedHouse owners and renters - White alone residents 912 75.1% Owner occupied302 24.9% Renter occupiedHouse owners and renters - Hispanic or Latino residents 515 82.8% Owner occupied107 17.2% Renter occupied
Language usage in Timberlane
English speakers - Total 69.0% of residents of Timberlane speak English at home.
15.5% of residents speak Spanish at home 949 66.0% Speak English very well489 34.0% Speak English less than very well15.8% of residents speak other language at home 833 56.9% Speak English very well632 43.1% Speak English less than very well
English speakers - Born in the United States 80.7% of residents of Timberlane speak English at home.
7.7% of residents speak Spanish at home 117 100.0% Speak English very well16.3% of residents speak other language at home 196 79.0% Speak English very well52 21.0% Speak English less than very well
English speakers - Native, born elsewhere 15.8% of residents of Timberlane speak English at home.
23.8% of residents speak Spanish at home 69 86.2% Speak English very well11 13.8% Speak English less than very well26.5% of residents speak other language at home 89 100.0% Speak English less than very well
English speakers - Foreign-born 6.3% of residents of Timberlane speak English at home.
55.7% of residents speak Spanish at home 428 47.3% Speak English very well477 52.7% Speak English less than very well40.3% of residents speak other language at home 171 26.1% Speak English very well483 73.9% Speak English less than very well
White (Caucasian) - Speak only English Native:
83.2% (2,290)Foreign-born:
17.3% (62)
White (Caucasian) - Speak another language Native:
13.4% (368)Foreign-born:
77.5% (278)
Black or African American - Speak only English Native:
94.4% (3,401)Foreign-born:
7.5% (18)
Black or African American - Speak another language Native:
6.4% (231)Foreign-born:
93.1% (219)
American Indian / Alaska Native - Speak another language Native:
100.0% (52)Foreign-born:
100.0% (168)
Asian - Speak only English Native:
38.6% (87)Foreign-born:
8.6% (20)
Asian - Speak another language Native:
44.8% (100)Foreign-born:
91.5% (216)
Other race - Speak another language Native:
45.7% (77)Foreign-born:
93.4% (377)
Two or more races - Speak another language Native:
61.7% (596)Foreign-born:
100.0% (337)
White alone - Speak only English Native:
82.9% (2,041)Foreign-born:
14.5% (34)
White alone - Speak another language Native:
15.5% (381)Foreign-born:
87.9% (209)
Hispanic or Latino - Speak another language Native:
51.0% (453)Foreign-born:
97.2% (787)
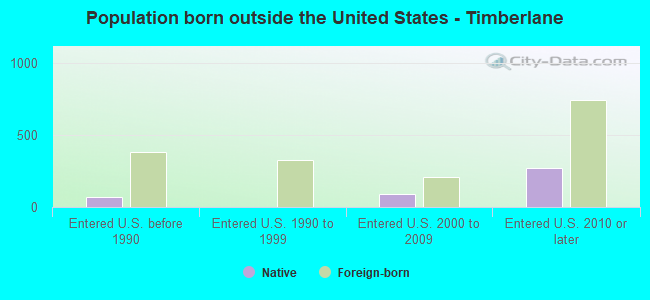
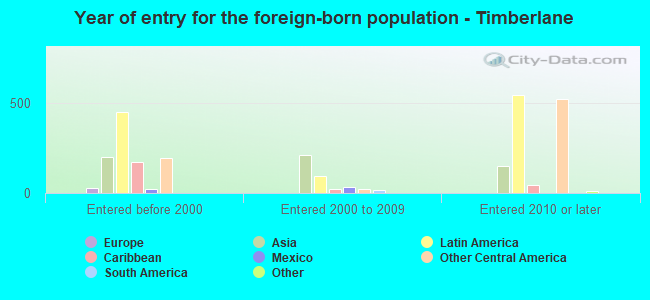
Foreign-born residents in Timberlane 1,898 residents are foreign born (11.0% Latin America , 5.6% Asia ).
This city:
17.8%Louisiana:
4.2%
Marital status for residents in Timberlane Marital status - White (Caucasian) population 15 years and over
Males 23.3% Never married60.7% Now married0.0% Separated3.8% Widowed12.3% DivorcedFemales 16.3% Never married56.3% Now married0.0% Separated12.0% Widowed15.4% DivorcedWomen who gave birth in the past 12 months Now married:
100.0% (30)Unmarried:
0.0% (0)
Women who did not give birth in the past 12 months Now married:
66.5% (433)Unmarried:
33.5% (218)
Marital status - Black or African American population 15 years and over
Males 36.5% Never married48.3% Now married1.2% Separated4.5% Widowed9.5% DivorcedFemales 37.1% Never married37.4% Now married7.0% Separated8.8% Widowed9.6% DivorcedWomen who gave birth in the past 12 months Now married:
10.8% (7)Unmarried:
89.2% (56)
Women who did not give birth in the past 12 months Now married:
48.6% (559)Unmarried:
51.4% (592)
Marital status - American Indian / Alaska Native population 15 years and over
Males 39.6% Never married44.0% Now married0.0% Separated0.0% Widowed16.5% DivorcedFemales 18.8% Never married62.5% Now married0.0% Separated18.8% Widowed0.0% DivorcedWomen who did not give birth in the past 12 months Now married:
76.9% (33)Unmarried:
23.1% (10)
Marital status - Asian population 15 years and over
Males 24.6% Never married36.9% Now married0.0% Separated4.9% Widowed33.6% DivorcedFemales 17.6% Never married38.7% Now married29.9% Separated0.0% Widowed13.7% DivorcedWomen who did not give birth in the past 12 months Now married:
67.1% (116)Unmarried:
32.9% (57)
Marital status - Other race population 15 years and over
Males 24.8% Never married66.9% Now married0.0% Separated8.3% Widowed0.0% DivorcedFemales 54.5% Never married33.3% Now married0.0% Separated7.8% Widowed4.3% DivorcedWomen who did not give birth in the past 12 months Now married:
28.2% (60)Unmarried:
71.8% (153)
Marital status - Two or more races population 15 years and over
Males 16.0% Never married69.2% Now married0.0% Separated0.0% Widowed14.7% DivorcedFemales 54.3% Never married20.1% Now married3.5% Separated6.9% Widowed15.2% DivorcedWomen who did not give birth in the past 12 months Now married:
8.1% (38)Unmarried:
91.9% (430)
Marital status - White alone, not Hispanic / Latino population 15 years and over
Males 21.5% Never married62.4% Now married0.0% Separated3.7% Widowed12.4% DivorcedFemales 17.7% Never married51.6% Now married0.0% Separated13.5% Widowed17.2% DivorcedWomen who gave birth in the past 12 months Now married:
100.0% (32)Unmarried:
0.0% (0)
Women who did not give birth in the past 12 months Now married:
59.3% (341)Unmarried:
40.7% (234)
Marital status - Hispanic or Latino population 15 years and over
Males 24.5% Never married61.9% Now married0.0% Separated3.1% Widowed10.4% DivorcedFemales 25.7% Never married61.4% Now married2.6% Separated7.2% Widowed3.1% DivorcedWomen who did not give birth in the past 12 months Now married:
60.0% (246)Unmarried:
40.0% (164)
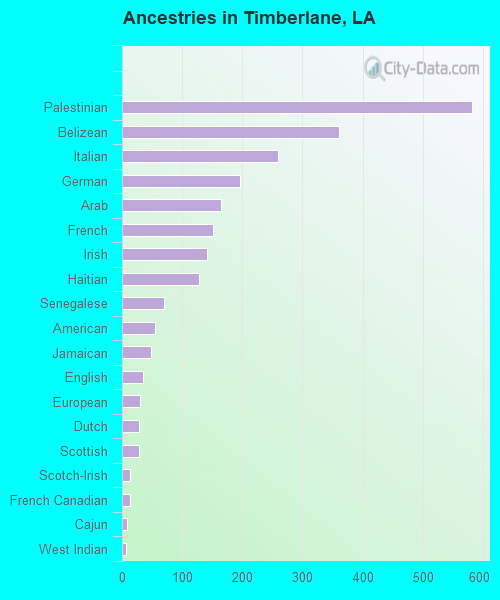
Ancestries in Timberlane
581 8.8% Palestinian360 5.5% Belizean259 3.9% Italian196 3.0% German165 2.5% Arab151 2.3% French142 2.2% Irish128 1.9% Haitian69 1.0% Senegalese55 0.8% American49 0.7% Jamaican35 0.5% English30 0.5% European29 0.4% Dutch28 0.4% Scottish14 0.2% Scotch-Irish13 0.2% French Canadian9 0.1% Cajun6 0.09% West Indian
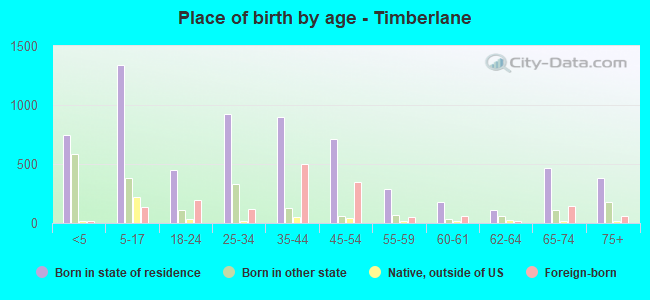
Children Nativity (place of birth) in Timberlane
Children under 6 years - Living with two parents Both parents native 578 100.0% NativeBoth parents foreign-born 384 100.0% NativeOne native, one foreign-born parent 100 100.0% NativeChildren under 6 years - Living with one parent Native parent 294 100.0% NativeForeign-born parent 41 100.0% NativeChildren 6 to 17 years - Living with two parents Both parents native 648 100.0% NativeBoth parents foreign-born 280 100.0% NativeOne native, one foreign-born parent 278 95.1% Native14 4.9% Foreign-bornChildren 6 to 17 years - Living with one parent Native parent 326 85.9% Native54 14.1% Foreign-bornForeign-born parent 195 76.9% Native58 23.1% Foreign-born
Grandparents responsible for own grandchildren in Timberlane
Grandparents (30 to 59 years) White / Caucasian 26 64.6% Responsible for grandchildren14 35.4% Not responsible for grandchildrenBlack or African American 7 12.3% Responsible for grandchildren51 87.7% Not responsible for grandchildrenTwo or more races 20 57.2% Responsible for grandchildren15 42.8% Not responsible for grandchildrenWhite alone, not Hispanic / Latino 33 62.7% Responsible for grandchildren19 37.3% Not responsible for grandchildren
Grandparents (60 years and over) White / Caucasian 12 100.0% Not responsible for grandchildrenBlack or African American 51 100.0% Not responsible for grandchildrenWhite alone, not Hispanic / Latino 14 100.0% Not responsible for grandchildren