Races in Tiverton, Rhode Island (RI) Detailed Stats
Data:
Races - White alone (%)
Races - White alone (% change since 2000)
Races - Black alone (%)
Races - Black alone (% change since 2000)
Races - American Indian alone (%)
Races - American Indian alone (% change since 2000)
Races - Asian alone (%)
Races - Asian alone (% change since 2000)
Races - Hispanic (%)
Races - Hispanic (% change since 2000)
Races - Native Hawaiian and Other Pacific Islander alone (%)
Races - Native Hawaiian and Other Pacific Islander alone (% change since 2000)
Races - Two or more races(%)
Races - Two or more races(% change since 2000)
Races - Other race alone (%)
Races - Other race alone (% change since 2000)
Racial diversity
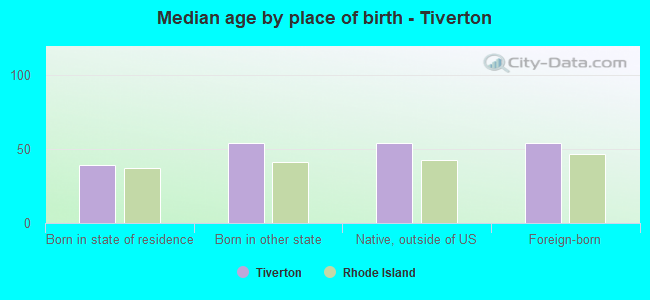
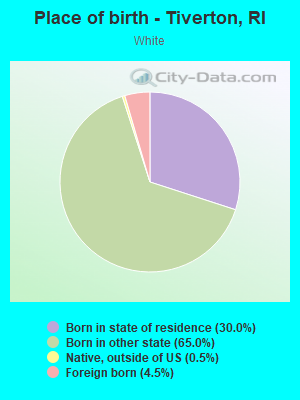
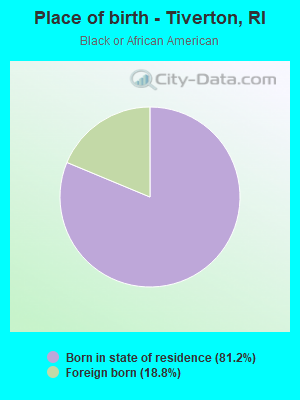
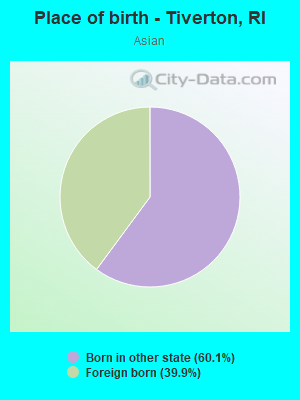
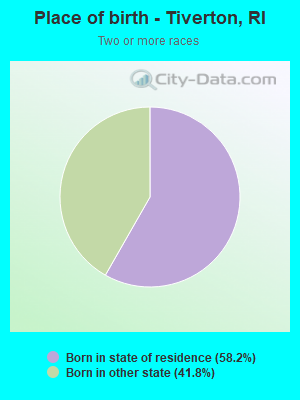
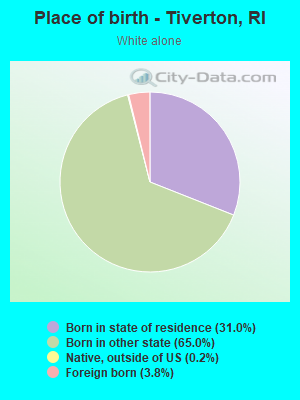
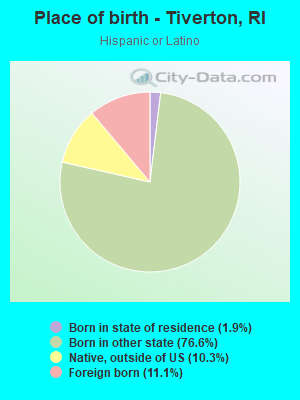
Place of birth - Born in state of residence (%)
Place of birth - Born in state of residence (%) - White
Place of birth - Born in state of residence (%) - Black or African American
Place of birth - Born in state of residence (%) - Asian
Place of birth - Born in state of residence (%) - Hispanic or Latino
Place of birth - Born in state of residence (%) - American Indian and Alaska Native
Place of birth - Born in state of residence (%) - Multirace
Place of birth - Born in state of residence (%) - Other Race
Place of birth - Born in other state (%)
Place of birth - Born in other state (%) - White
Place of birth - Born in other state (%) - Black or African American
Place of birth - Born in other state (%) - Asian
Place of birth - Born in other state (%) - Hispanic or Latino
Place of birth - Born in other state (%) - American Indian and Alaska Native
Place of birth - Born in other state (%) - Multirace
Place of birth - Born in other state (%) - Other Race
Place of birth - Native, outside of US (%)
Place of birth - Native, outside of US (%) - White
Place of birth - Native, outside of US (%) - Black or African American
Place of birth - Native, outside of US (%) - Asian
Place of birth - Native, outside of US (%) - Hispanic or Latino
Place of birth - Native, outside of US (%) - American Indian and Alaska Native
Place of birth - Native, outside of US (%) - Multirace
Place of birth - Native, outside of US (%) - Other Race
Place of birth - Foreign born (%)
Place of birth - Foreign born (%) - White
Place of birth - Foreign born (%) - Black or African American
Place of birth - Foreign born (%) - Asian
Place of birth - Foreign born (%) - Hispanic or Latino
Place of birth - Foreign born (%) - American Indian and Alaska Native
Place of birth - Foreign born (%) - Multirace
Place of birth - Foreign born (%) - Other Race
Residents speaking English at home (%)
Residents speaking English at home - Born in the United States (%)
Residents speaking English at home - Native, born elsewhere (%)
Residents speaking English at home - Foreign born (%)
Residents speaking Spanish at home (%)
Residents speaking Spanish at home - Born in the United States (%)
Residents speaking Spanish at home - Native, born elsewhere (%)
Residents speaking Spanish at home - Foreign born (%)
Residents speaking other language at home (%)
Residents speaking other language at home - Born in the United States (%)
Residents speaking other language at home - Native, born elsewhere (%)
Residents speaking other language at home - Foreign born (%)
Marital status - Never married (%)
Marital status - Now married (%)
Marital status - Separated (%)
Marital status - Widowed (%)
Marital status - Divorced (%)
Ancestries Reported - Arab (%)
Ancestries Reported - Czech (%)
Ancestries Reported - Danish (%)
Ancestries Reported - Dutch (%)
Ancestries Reported - English (%)
Ancestries Reported - French (%)
Ancestries Reported - French Canadian (%)
Ancestries Reported - German (%)
Ancestries Reported - Greek (%)
Ancestries Reported - Hungarian (%)
Ancestries Reported - Irish (%)
Ancestries Reported - Italian (%)
Ancestries Reported - Lithuanian (%)
Ancestries Reported - Norwegian (%)
Ancestries Reported - Polish (%)
Ancestries Reported - Portuguese (%)
Ancestries Reported - Russian (%)
Ancestries Reported - Scotch-Irish (%)
Ancestries Reported - Scottish (%)
Ancestries Reported - Slovak (%)
Ancestries Reported - Subsaharan African (%)
Ancestries Reported - Swedish (%)
Ancestries Reported - Swiss (%)
Ancestries Reported - Ukrainian (%)
Ancestries Reported - United States (%)
Ancestries Reported - Welsh (%)
Ancestries Reported - West Indian (%)
Ancestries Reported - Other (%)
Geographical mobility - Same house 1 year ago (%)
Geographical mobility - Same house 1 year ago (%) - White
Geographical mobility - Same house 1 year ago (%) - Black or African American
Geographical mobility - Same house 1 year ago (%) - Asian
Geographical mobility - Same house 1 year ago (%) - Hispanic or Latino
Geographical mobility - Same house 1 year ago (%) - American Indian and Alaska Native
Geographical mobility - Same house 1 year ago (%) - Multirace
Geographical mobility - Same house 1 year ago (%) - Other Race
Geographical mobility - Moved within same county (%)
Geographical mobility - Moved within same county (%) - White
Geographical mobility - Moved within same county (%) - Black or African American
Geographical mobility - Moved within same county (%) - Asian
Geographical mobility - Moved within same county (%) - Hispanic or Latino
Geographical mobility - Moved within same county (%) - American Indian and Alaska Native
Geographical mobility - Moved within same county (%) - Multirace
Geographical mobility - Moved within same county (%) - Other Race
Geographical mobility - Moved from different county within same state (%)
Geographical mobility - Moved from different county within same state (%) - White
Geographical mobility - Moved from different county within same state (%) - Black or African American
Geographical mobility - Moved from different county within same state (%) - Asian
Geographical mobility - Moved from different county within same state (%) - Hispanic or Latino
Geographical mobility - Moved from different county within same state (%) - American Indian and Alaska Native
Geographical mobility - Moved from different county within same state (%) - Multirace
Geographical mobility - Moved from different county within same state (%) - Other Race
Geographical mobility - Moved from different state (%)
Geographical mobility - Moved from different state (%) - White
Geographical mobility - Moved from different state (%) - Black or African American
Geographical mobility - Moved from different state (%) - Asian
Geographical mobility - Moved from different state (%) - Hispanic or Latino
Geographical mobility - Moved from different state (%) - American Indian and Alaska Native
Geographical mobility - Moved from different state (%) - Multirace
Geographical mobility - Moved from different state (%) - Other Race
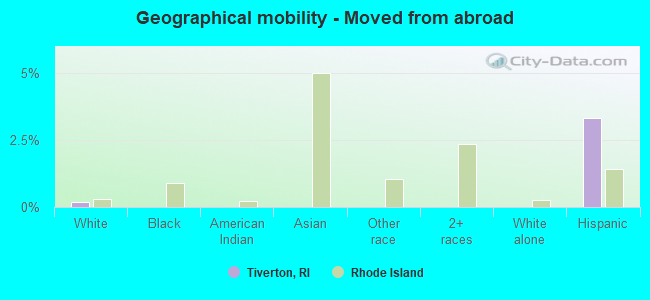
Geographical mobility - Moved from abroad (%)
Geographical mobility - Moved from abroad (%) - White
Geographical mobility - Moved from abroad (%) - Black or African American
Geographical mobility - Moved from abroad (%) - Asian
Geographical mobility - Moved from abroad (%) - Hispanic or Latino
Geographical mobility - Moved from abroad (%) - American Indian and Alaska Native
Geographical mobility - Moved from abroad (%) - Multirace
Geographical mobility - Moved from abroad (%) - Other Race
Place of birth for the foreign-born population - Ireland (%)
Place of birth for the foreign-born population - Denmark (%)
Place of birth for the foreign-born population - Norway (%)
Place of birth for the foreign-born population - Sweden (%)
Place of birth for the foreign-born population - United Kingdom (%)
Place of birth for the foreign-born population - England (%)
Place of birth for the foreign-born population - Scotland (%)
Place of birth for the foreign-born population - Other Northern Europe (%)
Place of birth for the foreign-born population - Austria (%)
Place of birth for the foreign-born population - Belgium (%)
Place of birth for the foreign-born population - France (%)
Place of birth for the foreign-born population - Germany (%)
Place of birth for the foreign-born population - Netherlands (%)
Place of birth for the foreign-born population - Switzerland (%)
Place of birth for the foreign-born population - Other Western Europe (%)
Place of birth for the foreign-born population - Greece (%)
Place of birth for the foreign-born population - Italy (%)
Place of birth for the foreign-born population - Portugal (%)
Place of birth for the foreign-born population - Spain (%)
Place of birth for the foreign-born population - Other Southern Europe (%)
Place of birth for the foreign-born population - Albania (%)
Place of birth for the foreign-born population - Belarus (%)
Place of birth for the foreign-born population - Bosnia and Herzegovina (%)
Place of birth for the foreign-born population - Bulgaria (%)
Place of birth for the foreign-born population - Croatia (%)
Place of birth for the foreign-born population - Czechoslovakia (%)
Place of birth for the foreign-born population - Hungary (%)
Place of birth for the foreign-born population - Latvia (%)
Place of birth for the foreign-born population - Lithuania (%)
Place of birth for the foreign-born population - North Macedonia (Macedonia) (%)
Place of birth for the foreign-born population - Moldova (%)
Place of birth for the foreign-born population - Poland (%)
Place of birth for the foreign-born population - Romania (%)
Place of birth for the foreign-born population - Russia (%)
Place of birth for the foreign-born population - Serbia (%)
Place of birth for the foreign-born population - Ukraine (%)
Place of birth for the foreign-born population - Other Eastern Europe (%)
Place of birth for the foreign-born population - China (%)
Place of birth for the foreign-born population - Hong Kong (%)
Place of birth for the foreign-born population - Taiwan (%)
Place of birth for the foreign-born population - Japan (%)
Place of birth for the foreign-born population - Korea (%)
Place of birth for the foreign-born population - Other Eastern Asia (%)
Place of birth for the foreign-born population - Afghanistan (%)
Place of birth for the foreign-born population - Bangladesh (%)
Place of birth for the foreign-born population - India (%)
Place of birth for the foreign-born population - Iran (%)
Place of birth for the foreign-born population - Kazakhstan (%)
Place of birth for the foreign-born population - Nepal (%)
Place of birth for the foreign-born population - Pakistan (%)
Place of birth for the foreign-born population - Sri Lanka (%)
Place of birth for the foreign-born population - Uzbekistan (%)
Place of birth for the foreign-born population - Other South Central Asia (%)
Place of birth for the foreign-born population - Burma (%)
Place of birth for the foreign-born population - Cambodia (%)
Place of birth for the foreign-born population - Indonesia (%)
Place of birth for the foreign-born population - Laos (%)
Place of birth for the foreign-born population - Malaysia (%)
Place of birth for the foreign-born population - Philippines (%)
Place of birth for the foreign-born population - Singapore (%)
Place of birth for the foreign-born population - Thailand (%)
Place of birth for the foreign-born population - Vietnam (%)
Place of birth for the foreign-born population - Other South Eastern Asia (%)
Place of birth for the foreign-born population - Armenia (%)
Place of birth for the foreign-born population - Iraq (%)
Place of birth for the foreign-born population - Israel (%)
Place of birth for the foreign-born population - Jordan (%)
Place of birth for the foreign-born population - Kuwait (%)
Place of birth for the foreign-born population - Lebanon (%)
Place of birth for the foreign-born population - Saudi Arabia (%)
Place of birth for the foreign-born population - Syria (%)
Place of birth for the foreign-born population - Turkey (%)
Place of birth for the foreign-born population - Yemen (%)
Place of birth for the foreign-born population - Other Western Asia (%)
Place of birth for the foreign-born population - Eritrea (%)
Place of birth for the foreign-born population - Ethiopia (%)
Place of birth for the foreign-born population - Kenya (%)
Place of birth for the foreign-born population - Somalia (%)
Place of birth for the foreign-born population - Uganda (%)
Place of birth for the foreign-born population - Zimbabwe (%)
Place of birth for the foreign-born population - Other Eastern Africa (%)
Place of birth for the foreign-born population - Cameroon (%)
Place of birth for the foreign-born population - Congo (%)
Place of birth for the foreign-born population - Democratic Republic of Congo (Zaire) (%)
Place of birth for the foreign-born population - Other Middle Africa (%)
Place of birth for the foreign-born population - Egypt (%)
Place of birth for the foreign-born population - Morocco (%)
Place of birth for the foreign-born population - Sudan (%)
Place of birth for the foreign-born population - Other Northern Africa (%)
Place of birth for the foreign-born population - South Africa (%)
Place of birth for the foreign-born population - Other Southern Africa (%)
Place of birth for the foreign-born population - Cabo Verde (%)
Place of birth for the foreign-born population - Ghana (%)
Place of birth for the foreign-born population - Liberia (%)
Place of birth for the foreign-born population - Nigeria (%)
Place of birth for the foreign-born population - Senegal (%)
Place of birth for the foreign-born population - Sierra Leone (%)
Place of birth for the foreign-born population - Other Western Africa (%)
Place of birth for the foreign-born population - Australia (%)
Place of birth for the foreign-born population - New Zealand (%)
Place of birth for the foreign-born population - Fiji (%)
Place of birth for the foreign-born population - Micronesia (%)
Place of birth for the foreign-born population - Bahamas (%)
Place of birth for the foreign-born population - Barbados (%)
Place of birth for the foreign-born population - Cuba (%)
Place of birth for the foreign-born population - Dominica (%)
Place of birth for the foreign-born population - Dominican Republic (%)
Place of birth for the foreign-born population - Grenada (%)
Place of birth for the foreign-born population - Haiti (%)
Place of birth for the foreign-born population - Jamaica (%)
Place of birth for the foreign-born population - St. Vincent and the Grenadines (%)
Place of birth for the foreign-born population - Trinidad and Tobago (%)
Place of birth for the foreign-born population - West Indies (%)
Place of birth for the foreign-born population - Other Caribbean (%)
Place of birth for the foreign-born population - Belize (%)
Place of birth for the foreign-born population - Costa Rica (%)
Place of birth for the foreign-born population - El Salvador (%)
Place of birth for the foreign-born population - Guatemala (%)
Place of birth for the foreign-born population - Honduras (%)
Place of birth for the foreign-born population - Mexico (%)
Place of birth for the foreign-born population - Nicaragua (%)
Place of birth for the foreign-born population - Panama (%)
Place of birth for the foreign-born population - Other Central America (%)
Place of birth for the foreign-born population - Argentina (%)
Place of birth for the foreign-born population - Bolivia (%)
Place of birth for the foreign-born population - Brazil (%)
Place of birth for the foreign-born population - Chile (%)
Place of birth for the foreign-born population - Colombia (%)
Place of birth for the foreign-born population - Ecuador (%)
Place of birth for the foreign-born population - Guyana (%)
Place of birth for the foreign-born population - Peru (%)
Place of birth for the foreign-born population - Uruguay (%)
Place of birth for the foreign-born population - Venezuela (%)
Place of birth for the foreign-born population - Other South America (%)
Place of birth for the foreign-born population - Canada (%)
Place of birth for the foreign-born population - Other Northern America (%)
Place of birth for the foreign-born population - Other (%)
Latest news about races in Tiverton, RI collected exclusively by city-data.com from local newspapers, TV, and radio stations
According to 2022 data, the most numerous races in Tiverton, RI are White alone (7,132 residents), Hispanic (616 residents), and Two or more races (138 residents). 90.8% of Tiverton residents speak English at home. 4.4% of Tiverton, RI residents are foreign-born (2.7% born in Europe, 1.0% born in Latin America), which is 220.4% less than the foreign-born rate of 14.0% across the entire state of Rhode Island.
Race distribution in Tiverton
2000 2022
858,433 81.9% White alone 90,820 8.7% Hispanic 41,922 4.0% Black alone 23,416 2.2% Asian alone 20,816 2.0% Two or more races 8,411 0.8% Other race alone 4,181 0.4% American Indian alone 320 0.03% Native Hawaiian and Other
745,825 68.2% White alone 191,979 17.6% Hispanic 56,738 5.2% Two or more races 51,326 4.7% Black alone 37,234 3.4% Asian alone 9,514 0.9% Other race alone 978 0.09% American Indian alone 140 0.01% Native Hawaiian and Other
Income and house value in Tiverton Median household income in 2022 $83,812 White non-Hispanic householdersover $200,000 Black householdersMedian 2022 house value $413,953 White Non-Hispanic householders$508,446 Black or African American householders$297,245 American Indian or Alaska Native householders$352,001 Two or more races householders$555,380 Hispanic or Latino householders
Median age by race in Tiverton
49.8 Median age for White residents46.4 52.9 37.0 Median age for Black or African American residents30.6 -773,255,813.2 -628,930,817.0 Median age for American Indian / Alaska Native residents-743,837,083.9 -606,811,144.9 -737,899,542.6 Median age for Asian residents-665,028,664.4 -679,558,010.4 -713,991,768.8 Median age for Native Hawaiian / Pacific Islander residents-666,666,666.0 -666,666,666.0 37.5 Median age for Other race residents-679,487,178.8 4.6 6.9 Median age for Two or more races residents-737,484,736.7 7.6 49.9 Median age for White alone residents45.5 55.1 39.0 Median age for Hispanic or Latino residents37.5 9.1
Owner/renter occupied households by race in Tiverton
House owners and renters - White residents 2,401 69.0% Owner occupied1,081 31.0% Renter occupiedHouse owners and renters - Black or African American residents 71 92.9% Owner occupied5 7.1% Renter occupiedHouse owners and renters - American Indian / Alaska Native residents 6 100.0% Renter occupiedHouse owners and renters - Asian residents 15 100.0% Renter occupiedHouse owners and renters - Two or more races residents 11 100.0% Owner occupiedHouse owners and renters - White alone residents 2,382 71.2% Owner occupied965 28.8% Renter occupiedHouse owners and renters - Hispanic or Latino residents 34 23.4% Owner occupied110 76.6% Renter occupied
Language usage in Tiverton
English speakers - Total 90.8% of residents of Tiverton speak English at home.
4.0% of residents speak Spanish at home 230 75.4% Speak English very well75 24.6% Speak English less than very well4.2% of residents speak other language at home 269 82.8% Speak English very well56 17.2% Speak English less than very well
English speakers - Born in the United States 95.6% of residents of Tiverton speak English at home.
3.1% of residents speak Spanish at home 144 94.1% Speak English very well9 5.9% Speak English less than very well1.7% of residents speak other language at home 66 77.6% Speak English very well19 22.4% Speak English less than very well
English speakers - Native, born elsewhere 26.7% of residents of Tiverton speak English at home.
72.0% of residents speak Spanish at home 54 100.0% Speak English very well
English speakers - Foreign-born 36.6% of residents of Tiverton speak English at home.
11.1% of residents speak Spanish at home 12 24.5% Speak English very well37 75.5% Speak English less than very well33.4% of residents speak other language at home 115 77.7% Speak English very well33 22.3% Speak English less than very well
White (Caucasian) - Speak only English Native:
97.6% (6,647)Foreign-born:
35.8% (119)
White (Caucasian) - Speak another language Native:
2.4% (165)Foreign-born:
59.0% (197)
Black or African American - Speak only English Native:
100.0% (40)Foreign-born:
100.0% (22)
White alone - Speak only English Native:
97.9% (6,508)Foreign-born:
44.2% (119)
White alone - Speak another language Native:
2.1% (141)Foreign-born:
41.0% (111)
Hispanic or Latino - Speak another language Native:
77.9% (271)Foreign-born:
98.4% (84)
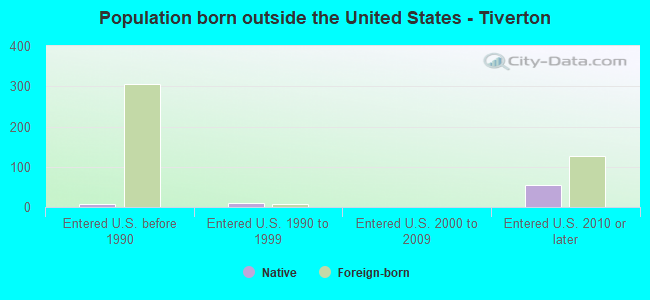
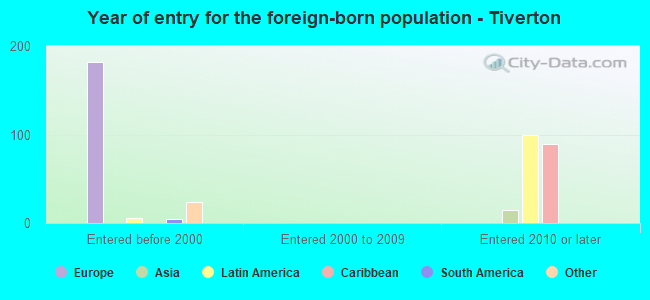
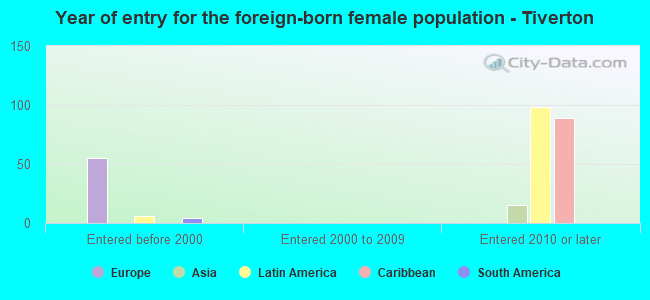
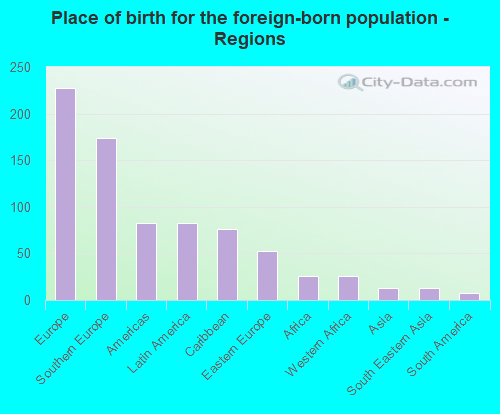
Foreign-born residents in Tiverton 350 residents are foreign born (2.7% Europe , 1.0% Latin America ).
This city:
4.4%Rhode Island:
14.4%
Marital status for residents in Tiverton Marital status - White (Caucasian) population 15 years and over
Males 42.1% Never married47.3% Now married0.0% Separated0.9% Widowed9.7% DivorcedFemales 23.8% Never married47.1% Now married1.8% Separated14.6% Widowed12.8% DivorcedWomen who gave birth in the past 12 months Now married:
31.8% (13)Unmarried:
68.2% (27)
Women who did not give birth in the past 12 months Now married:
46.4% (611)Unmarried:
53.6% (706)
Marital status - Black or African American population 15 years and over
Males 20.4% Never married79.6% Now married0.0% Separated0.0% Widowed0.0% DivorcedFemales 100.0% Never married0.0% Now married0.0% Separated0.0% Widowed0.0% DivorcedWomen who did not give birth in the past 12 months Now married:
0.0% (0)Unmarried:
100.0% (10)
Marital status - Asian population 15 years and over
Males 100.0% Never married0.0% Now married0.0% Separated0.0% Widowed0.0% DivorcedFemales 0.0% Never married100.0% Now married0.0% Separated0.0% Widowed0.0% DivorcedWomen who did not give birth in the past 12 months Now married:
100.0% (15)Unmarried:
0.0% (0)
Marital status - Other race population 15 years and over
Males 0.0% Never married100.0% Now married0.0% Separated0.0% Widowed0.0% DivorcedFemales 0.0% Never married100.0% Now married0.0% Separated0.0% Widowed0.0% DivorcedMarital status - White alone, not Hispanic / Latino population 15 years and over
Males 42.9% Never married48.9% Now married0.0% Separated0.4% Widowed7.8% DivorcedFemales 24.2% Never married48.0% Now married1.9% Separated12.7% Widowed13.2% DivorcedWomen who gave birth in the past 12 months Now married:
31.8% (13)Unmarried:
68.2% (28)
Women who did not give birth in the past 12 months Now married:
49.0% (627)Unmarried:
51.0% (651)
Marital status - Hispanic or Latino population 15 years and over
Males 13.2% Never married48.6% Now married0.0% Separated7.4% Widowed30.9% DivorcedFemales 7.9% Never married33.1% Now married0.0% Separated59.1% Widowed0.0% DivorcedWomen who did not give birth in the past 12 months Now married:
7.6% (7)Unmarried:
92.4% (88)
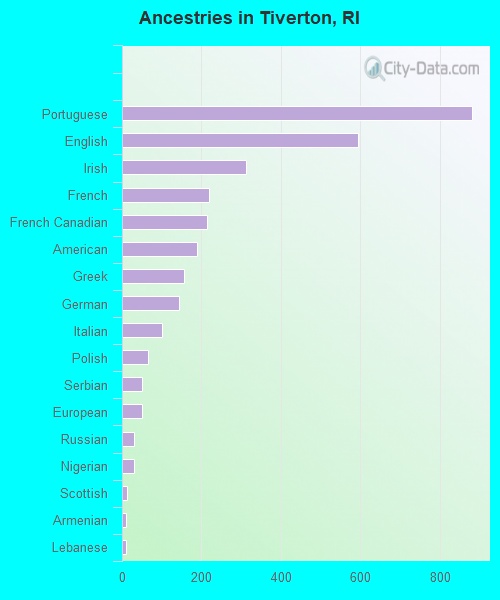
Ancestries in Tiverton
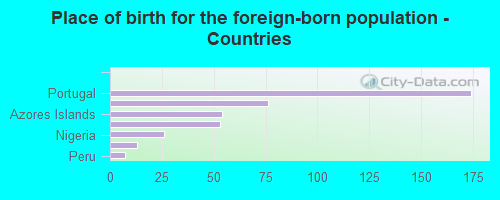
880 26.1% Portuguese595 17.7% English311 9.2% Irish220 6.5% French215 6.4% French Canadian189 5.6% American157 4.7% Greek143 4.2% German100 3.0% Italian65 1.9% Polish51 1.5% Serbian50 1.5% European31 0.9% Russian30 0.9% Nigerian13 0.4% Scottish11 0.3% Armenian9 0.3% Lebanese5 0.1% Scotch-Irish
Children Nativity (place of birth) in Tiverton
Children under 6 years - Living with two parents Both parents native 195 100.0% NativeOne native, one foreign-born parent 24 100.0% NativeChildren under 6 years - Living with one parent Native parent 86 100.0% Native
Children 6 to 17 years - Living with two parents Both parents native 294 100.0% NativeOne native, one foreign-born parent 128 100.0% NativeChildren 6 to 17 years - Living with one parent Native parent 291 100.0% Native
Grandparents responsible for own grandchildren in Tiverton
Grandparents (30 to 59 years) White / Caucasian 35 36.2% Responsible for grandchildren61 63.8% Not responsible for grandchildrenWhite alone, not Hispanic / Latino 42 38.1% Responsible for grandchildren68 61.9% Not responsible for grandchildrenGrandparents (60 years and over) White / Caucasian 26 45.2% Responsible for grandchildren32 54.8% Not responsible for grandchildrenWhite alone, not Hispanic / Latino 28 60.2% Responsible for grandchildren18 39.8% Not responsible for grandchildren