Races in Toms River, New Jersey (NJ) Detailed Stats
Data:
Races - White alone (%)
Races - White alone (% change since 2000)
Races - Black alone (%)
Races - Black alone (% change since 2000)
Races - American Indian alone (%)
Races - American Indian alone (% change since 2000)
Races - Asian alone (%)
Races - Asian alone (% change since 2000)
Races - Hispanic (%)
Races - Hispanic (% change since 2000)
Races - Native Hawaiian and Other Pacific Islander alone (%)
Races - Native Hawaiian and Other Pacific Islander alone (% change since 2000)
Races - Two or more races(%)
Races - Two or more races(% change since 2000)
Races - Other race alone (%)
Races - Other race alone (% change since 2000)
Racial diversity
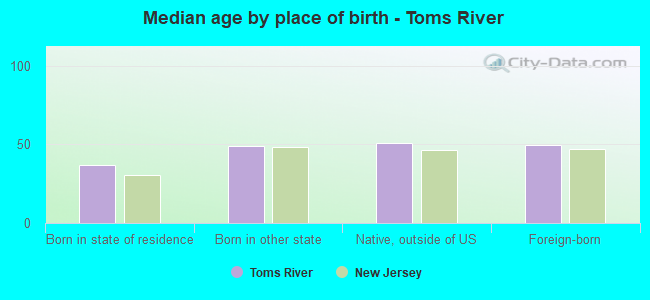
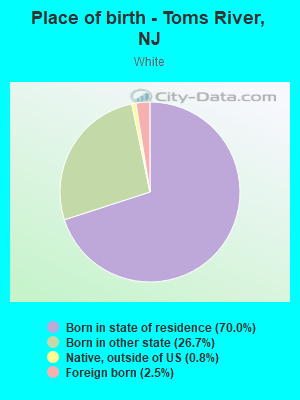
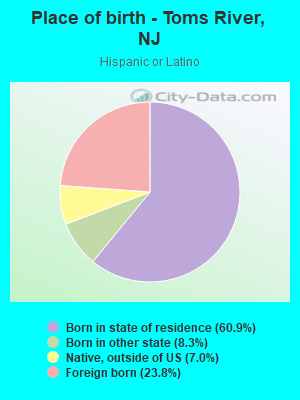
Place of birth - Born in state of residence (%)
Place of birth - Born in state of residence (%) - White
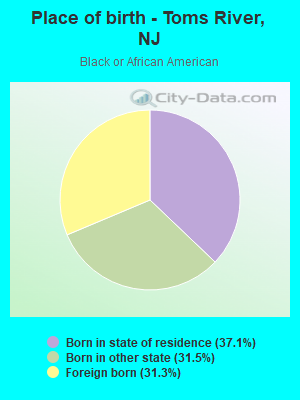
Place of birth - Born in state of residence (%) - Black or African American
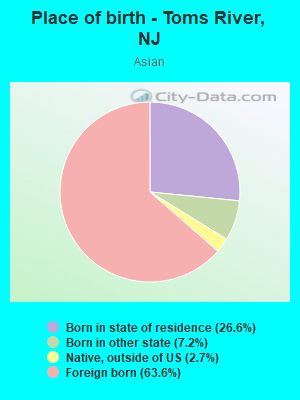
Place of birth - Born in state of residence (%) - Asian
Place of birth - Born in state of residence (%) - Hispanic or Latino
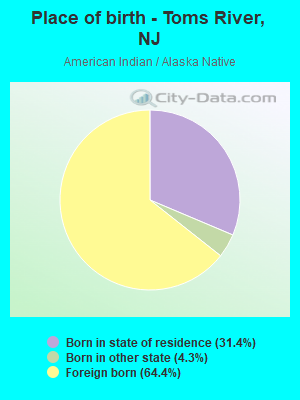
Place of birth - Born in state of residence (%) - American Indian and Alaska Native
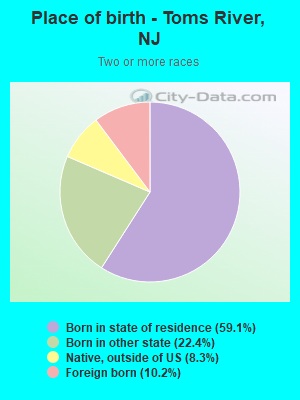
Place of birth - Born in state of residence (%) - Multirace
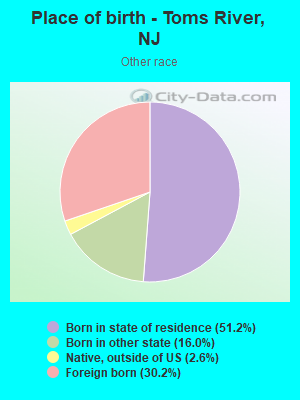
Place of birth - Born in state of residence (%) - Other Race
Place of birth - Born in other state (%)
Place of birth - Born in other state (%) - White
Place of birth - Born in other state (%) - Black or African American
Place of birth - Born in other state (%) - Asian
Place of birth - Born in other state (%) - Hispanic or Latino
Place of birth - Born in other state (%) - American Indian and Alaska Native
Place of birth - Born in other state (%) - Multirace
Place of birth - Born in other state (%) - Other Race
Place of birth - Native, outside of US (%)
Place of birth - Native, outside of US (%) - White
Place of birth - Native, outside of US (%) - Black or African American
Place of birth - Native, outside of US (%) - Asian
Place of birth - Native, outside of US (%) - Hispanic or Latino
Place of birth - Native, outside of US (%) - American Indian and Alaska Native
Place of birth - Native, outside of US (%) - Multirace
Place of birth - Native, outside of US (%) - Other Race
Place of birth - Foreign born (%)
Place of birth - Foreign born (%) - White
Place of birth - Foreign born (%) - Black or African American
Place of birth - Foreign born (%) - Asian
Place of birth - Foreign born (%) - Hispanic or Latino
Place of birth - Foreign born (%) - American Indian and Alaska Native
Place of birth - Foreign born (%) - Multirace
Place of birth - Foreign born (%) - Other Race
Residents speaking English at home (%)
Residents speaking English at home - Born in the United States (%)
Residents speaking English at home - Native, born elsewhere (%)
Residents speaking English at home - Foreign born (%)
Residents speaking Spanish at home (%)
Residents speaking Spanish at home - Born in the United States (%)
Residents speaking Spanish at home - Native, born elsewhere (%)
Residents speaking Spanish at home - Foreign born (%)
Residents speaking other language at home (%)
Residents speaking other language at home - Born in the United States (%)
Residents speaking other language at home - Native, born elsewhere (%)
Residents speaking other language at home - Foreign born (%)
Marital status - Never married (%)
Marital status - Now married (%)
Marital status - Separated (%)
Marital status - Widowed (%)
Marital status - Divorced (%)
Ancestries Reported - Arab (%)
Ancestries Reported - Czech (%)
Ancestries Reported - Danish (%)
Ancestries Reported - Dutch (%)
Ancestries Reported - English (%)
Ancestries Reported - French (%)
Ancestries Reported - French Canadian (%)
Ancestries Reported - German (%)
Ancestries Reported - Greek (%)
Ancestries Reported - Hungarian (%)
Ancestries Reported - Irish (%)
Ancestries Reported - Italian (%)
Ancestries Reported - Lithuanian (%)
Ancestries Reported - Norwegian (%)
Ancestries Reported - Polish (%)
Ancestries Reported - Portuguese (%)
Ancestries Reported - Russian (%)
Ancestries Reported - Scotch-Irish (%)
Ancestries Reported - Scottish (%)
Ancestries Reported - Slovak (%)
Ancestries Reported - Subsaharan African (%)
Ancestries Reported - Swedish (%)
Ancestries Reported - Swiss (%)
Ancestries Reported - Ukrainian (%)
Ancestries Reported - United States (%)
Ancestries Reported - Welsh (%)
Ancestries Reported - West Indian (%)
Ancestries Reported - Other (%)
Geographical mobility - Same house 1 year ago (%)
Geographical mobility - Same house 1 year ago (%) - White
Geographical mobility - Same house 1 year ago (%) - Black or African American
Geographical mobility - Same house 1 year ago (%) - Asian
Geographical mobility - Same house 1 year ago (%) - Hispanic or Latino
Geographical mobility - Same house 1 year ago (%) - American Indian and Alaska Native
Geographical mobility - Same house 1 year ago (%) - Multirace
Geographical mobility - Same house 1 year ago (%) - Other Race
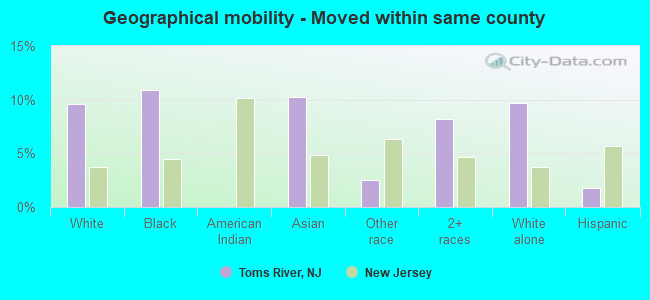
Geographical mobility - Moved within same county (%)
Geographical mobility - Moved within same county (%) - White
Geographical mobility - Moved within same county (%) - Black or African American
Geographical mobility - Moved within same county (%) - Asian
Geographical mobility - Moved within same county (%) - Hispanic or Latino
Geographical mobility - Moved within same county (%) - American Indian and Alaska Native
Geographical mobility - Moved within same county (%) - Multirace
Geographical mobility - Moved within same county (%) - Other Race
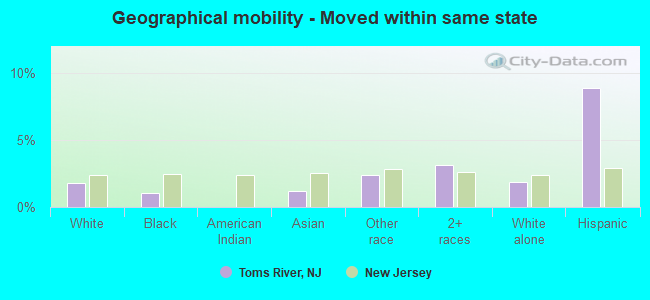
Geographical mobility - Moved from different county within same state (%)
Geographical mobility - Moved from different county within same state (%) - White
Geographical mobility - Moved from different county within same state (%) - Black or African American
Geographical mobility - Moved from different county within same state (%) - Asian
Geographical mobility - Moved from different county within same state (%) - Hispanic or Latino
Geographical mobility - Moved from different county within same state (%) - American Indian and Alaska Native
Geographical mobility - Moved from different county within same state (%) - Multirace
Geographical mobility - Moved from different county within same state (%) - Other Race
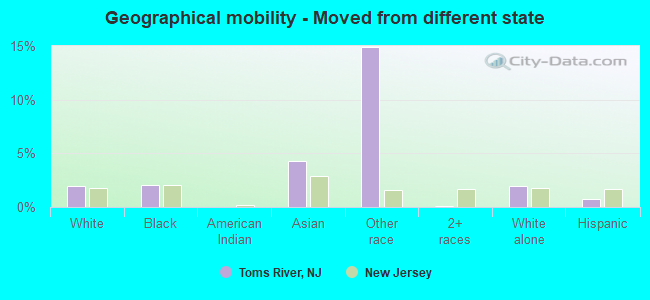
Geographical mobility - Moved from different state (%)
Geographical mobility - Moved from different state (%) - White
Geographical mobility - Moved from different state (%) - Black or African American
Geographical mobility - Moved from different state (%) - Asian
Geographical mobility - Moved from different state (%) - Hispanic or Latino
Geographical mobility - Moved from different state (%) - American Indian and Alaska Native
Geographical mobility - Moved from different state (%) - Multirace
Geographical mobility - Moved from different state (%) - Other Race
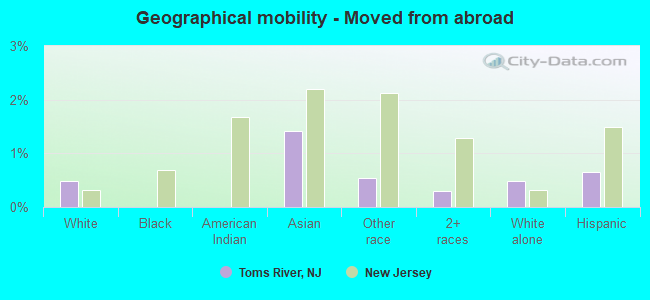
Geographical mobility - Moved from abroad (%)
Geographical mobility - Moved from abroad (%) - White
Geographical mobility - Moved from abroad (%) - Black or African American
Geographical mobility - Moved from abroad (%) - Asian
Geographical mobility - Moved from abroad (%) - Hispanic or Latino
Geographical mobility - Moved from abroad (%) - American Indian and Alaska Native
Geographical mobility - Moved from abroad (%) - Multirace
Geographical mobility - Moved from abroad (%) - Other Race
Place of birth for the foreign-born population - Ireland (%)
Place of birth for the foreign-born population - Denmark (%)
Place of birth for the foreign-born population - Norway (%)
Place of birth for the foreign-born population - Sweden (%)
Place of birth for the foreign-born population - United Kingdom (%)
Place of birth for the foreign-born population - England (%)
Place of birth for the foreign-born population - Scotland (%)
Place of birth for the foreign-born population - Other Northern Europe (%)
Place of birth for the foreign-born population - Austria (%)
Place of birth for the foreign-born population - Belgium (%)
Place of birth for the foreign-born population - France (%)
Place of birth for the foreign-born population - Germany (%)
Place of birth for the foreign-born population - Netherlands (%)
Place of birth for the foreign-born population - Switzerland (%)
Place of birth for the foreign-born population - Other Western Europe (%)
Place of birth for the foreign-born population - Greece (%)
Place of birth for the foreign-born population - Italy (%)
Place of birth for the foreign-born population - Portugal (%)
Place of birth for the foreign-born population - Spain (%)
Place of birth for the foreign-born population - Other Southern Europe (%)
Place of birth for the foreign-born population - Albania (%)
Place of birth for the foreign-born population - Belarus (%)
Place of birth for the foreign-born population - Bosnia and Herzegovina (%)
Place of birth for the foreign-born population - Bulgaria (%)
Place of birth for the foreign-born population - Croatia (%)
Place of birth for the foreign-born population - Czechoslovakia (%)
Place of birth for the foreign-born population - Hungary (%)
Place of birth for the foreign-born population - Latvia (%)
Place of birth for the foreign-born population - Lithuania (%)
Place of birth for the foreign-born population - North Macedonia (Macedonia) (%)
Place of birth for the foreign-born population - Moldova (%)
Place of birth for the foreign-born population - Poland (%)
Place of birth for the foreign-born population - Romania (%)
Place of birth for the foreign-born population - Russia (%)
Place of birth for the foreign-born population - Serbia (%)
Place of birth for the foreign-born population - Ukraine (%)
Place of birth for the foreign-born population - Other Eastern Europe (%)
Place of birth for the foreign-born population - China (%)
Place of birth for the foreign-born population - Hong Kong (%)
Place of birth for the foreign-born population - Taiwan (%)
Place of birth for the foreign-born population - Japan (%)
Place of birth for the foreign-born population - Korea (%)
Place of birth for the foreign-born population - Other Eastern Asia (%)
Place of birth for the foreign-born population - Afghanistan (%)
Place of birth for the foreign-born population - Bangladesh (%)
Place of birth for the foreign-born population - India (%)
Place of birth for the foreign-born population - Iran (%)
Place of birth for the foreign-born population - Kazakhstan (%)
Place of birth for the foreign-born population - Nepal (%)
Place of birth for the foreign-born population - Pakistan (%)
Place of birth for the foreign-born population - Sri Lanka (%)
Place of birth for the foreign-born population - Uzbekistan (%)
Place of birth for the foreign-born population - Other South Central Asia (%)
Place of birth for the foreign-born population - Burma (%)
Place of birth for the foreign-born population - Cambodia (%)
Place of birth for the foreign-born population - Indonesia (%)
Place of birth for the foreign-born population - Laos (%)
Place of birth for the foreign-born population - Malaysia (%)
Place of birth for the foreign-born population - Philippines (%)
Place of birth for the foreign-born population - Singapore (%)
Place of birth for the foreign-born population - Thailand (%)
Place of birth for the foreign-born population - Vietnam (%)
Place of birth for the foreign-born population - Other South Eastern Asia (%)
Place of birth for the foreign-born population - Armenia (%)
Place of birth for the foreign-born population - Iraq (%)
Place of birth for the foreign-born population - Israel (%)
Place of birth for the foreign-born population - Jordan (%)
Place of birth for the foreign-born population - Kuwait (%)
Place of birth for the foreign-born population - Lebanon (%)
Place of birth for the foreign-born population - Saudi Arabia (%)
Place of birth for the foreign-born population - Syria (%)
Place of birth for the foreign-born population - Turkey (%)
Place of birth for the foreign-born population - Yemen (%)
Place of birth for the foreign-born population - Other Western Asia (%)
Place of birth for the foreign-born population - Eritrea (%)
Place of birth for the foreign-born population - Ethiopia (%)
Place of birth for the foreign-born population - Kenya (%)
Place of birth for the foreign-born population - Somalia (%)
Place of birth for the foreign-born population - Uganda (%)
Place of birth for the foreign-born population - Zimbabwe (%)
Place of birth for the foreign-born population - Other Eastern Africa (%)
Place of birth for the foreign-born population - Cameroon (%)
Place of birth for the foreign-born population - Congo (%)
Place of birth for the foreign-born population - Democratic Republic of Congo (Zaire) (%)
Place of birth for the foreign-born population - Other Middle Africa (%)
Place of birth for the foreign-born population - Egypt (%)
Place of birth for the foreign-born population - Morocco (%)
Place of birth for the foreign-born population - Sudan (%)
Place of birth for the foreign-born population - Other Northern Africa (%)
Place of birth for the foreign-born population - South Africa (%)
Place of birth for the foreign-born population - Other Southern Africa (%)
Place of birth for the foreign-born population - Cabo Verde (%)
Place of birth for the foreign-born population - Ghana (%)
Place of birth for the foreign-born population - Liberia (%)
Place of birth for the foreign-born population - Nigeria (%)
Place of birth for the foreign-born population - Senegal (%)
Place of birth for the foreign-born population - Sierra Leone (%)
Place of birth for the foreign-born population - Other Western Africa (%)
Place of birth for the foreign-born population - Australia (%)
Place of birth for the foreign-born population - New Zealand (%)
Place of birth for the foreign-born population - Fiji (%)
Place of birth for the foreign-born population - Micronesia (%)
Place of birth for the foreign-born population - Bahamas (%)
Place of birth for the foreign-born population - Barbados (%)
Place of birth for the foreign-born population - Cuba (%)
Place of birth for the foreign-born population - Dominica (%)
Place of birth for the foreign-born population - Dominican Republic (%)
Place of birth for the foreign-born population - Grenada (%)
Place of birth for the foreign-born population - Haiti (%)
Place of birth for the foreign-born population - Jamaica (%)
Place of birth for the foreign-born population - St. Vincent and the Grenadines (%)
Place of birth for the foreign-born population - Trinidad and Tobago (%)
Place of birth for the foreign-born population - West Indies (%)
Place of birth for the foreign-born population - Other Caribbean (%)
Place of birth for the foreign-born population - Belize (%)
Place of birth for the foreign-born population - Costa Rica (%)
Place of birth for the foreign-born population - El Salvador (%)
Place of birth for the foreign-born population - Guatemala (%)
Place of birth for the foreign-born population - Honduras (%)
Place of birth for the foreign-born population - Mexico (%)
Place of birth for the foreign-born population - Nicaragua (%)
Place of birth for the foreign-born population - Panama (%)
Place of birth for the foreign-born population - Other Central America (%)
Place of birth for the foreign-born population - Argentina (%)
Place of birth for the foreign-born population - Bolivia (%)
Place of birth for the foreign-born population - Brazil (%)
Place of birth for the foreign-born population - Chile (%)
Place of birth for the foreign-born population - Colombia (%)
Place of birth for the foreign-born population - Ecuador (%)
Place of birth for the foreign-born population - Guyana (%)
Place of birth for the foreign-born population - Peru (%)
Place of birth for the foreign-born population - Uruguay (%)
Place of birth for the foreign-born population - Venezuela (%)
Place of birth for the foreign-born population - Other South America (%)
Place of birth for the foreign-born population - Canada (%)
Place of birth for the foreign-born population - Other Northern America (%)
Place of birth for the foreign-born population - Other (%)
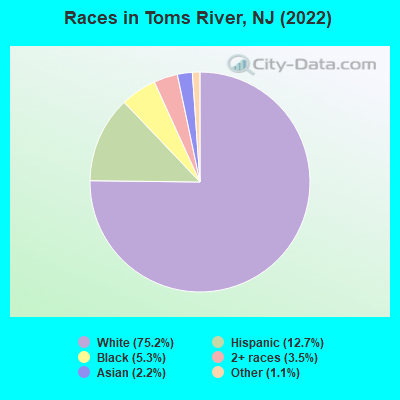
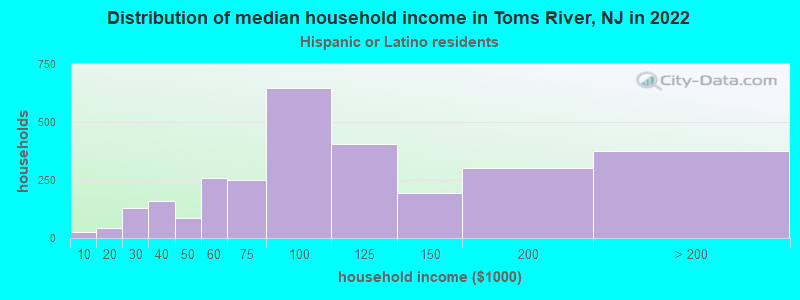
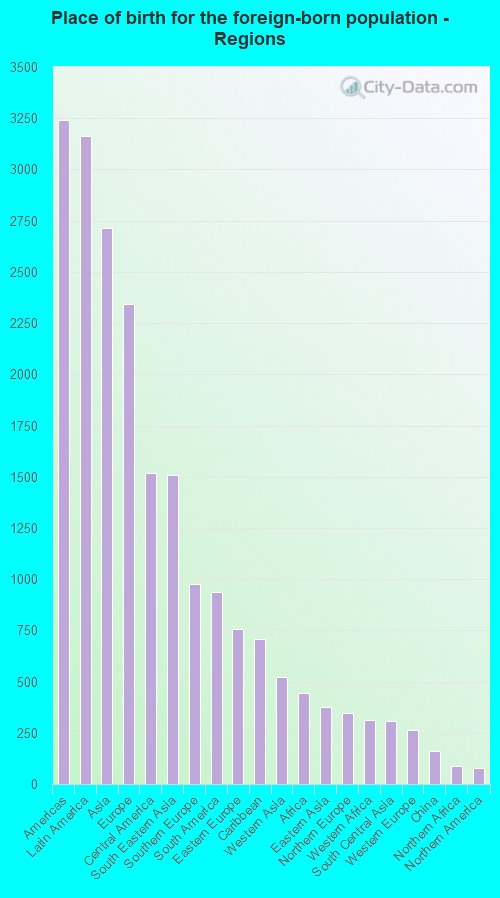
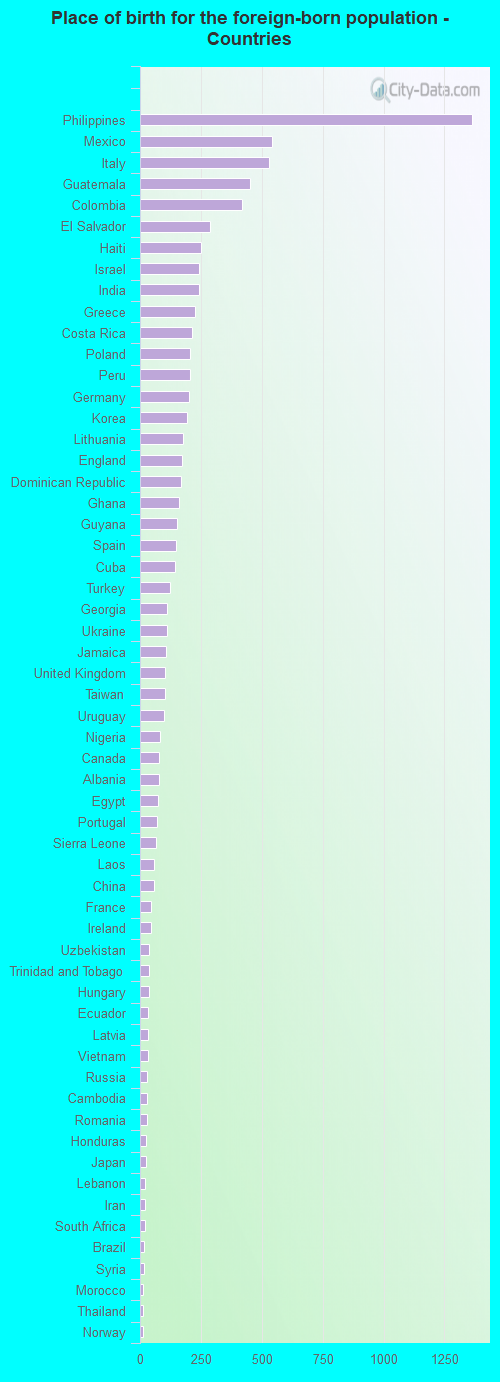
According to 2022 data, the most numerous races in Toms River, NJ are White alone (71,420 residents), Hispanic (12,033 residents), and Black alone (5,034 residents). 87.2% of Toms River residents speak English at home. 9.2% of Toms River, NJ residents are foreign-born (3.3% born in Latin America, 2.9% born in Asia, 2.5% born in Europe), which is 150.9% less than the foreign-born rate of 23.0% across the entire state of New Jersey.
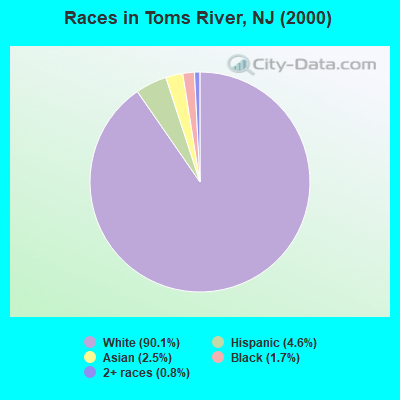
Race distribution in Toms River
2000 2022
77,807 90.1% White alone 4,010 4.6% Hispanic 2,185 2.5% Asian alone 1,487 1.7% Black alone 704 0.8% Two or more races 68 0.08% American Indian alone 51 0.06% Other race alone 15 0.02% Native Hawaiian and Other
71,420 75.2% White alone 12,033 12.7% Hispanic 5,034 5.3% Black alone 3,345 3.5% Two or more races 2,117 2.2% Asian alone 1,072 1.1% Other race alone
2000 2022
5,557,209 66.0% White alone 1,117,191 13.3% Hispanic 1,096,171 13.0% Black alone 477,012 5.7% Asian alone 133,689 1.6% Two or more races 19,565 0.2% Other race alone 11,338 0.1% American Indian alone 2,175 0.03% Native Hawaiian and Other
4,766,476 51.5% White alone 2,028,470 21.9% Hispanic 1,111,632 12.0% Black alone 923,546 10.0% Asian alone 332,237 3.6% Two or more races 89,847 1.0% Other race alone 8,557 0.09% American Indian alone 934 0.01% Native Hawaiian and Other
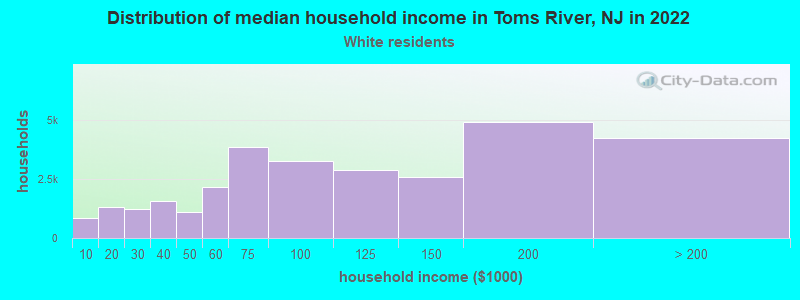
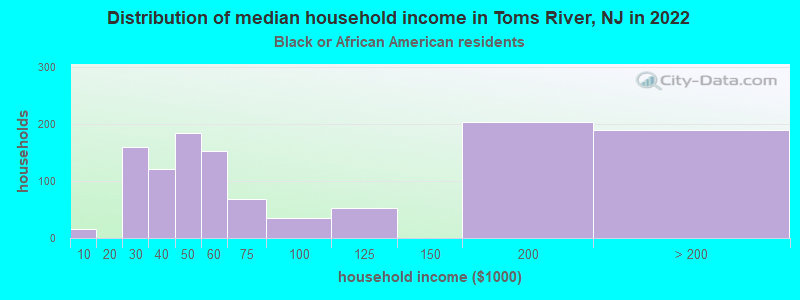
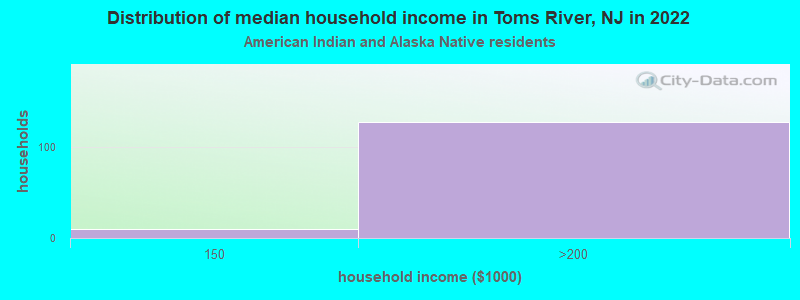
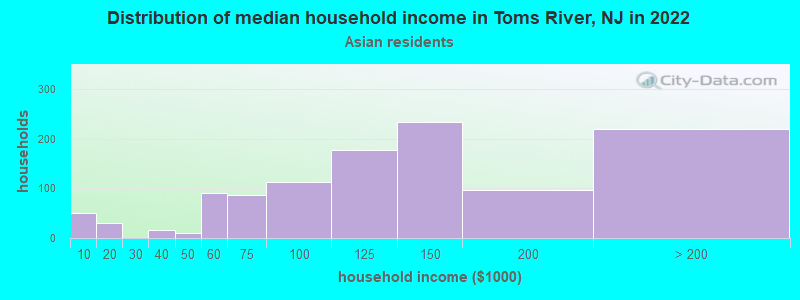
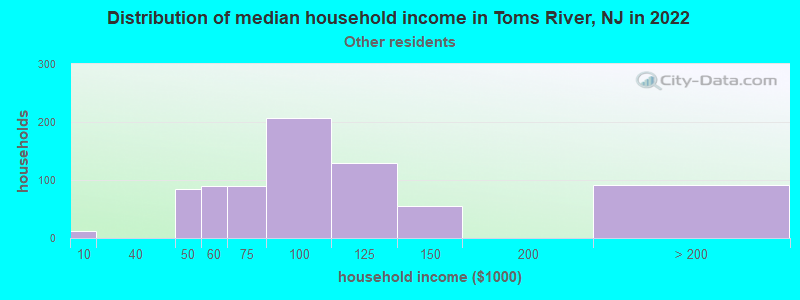
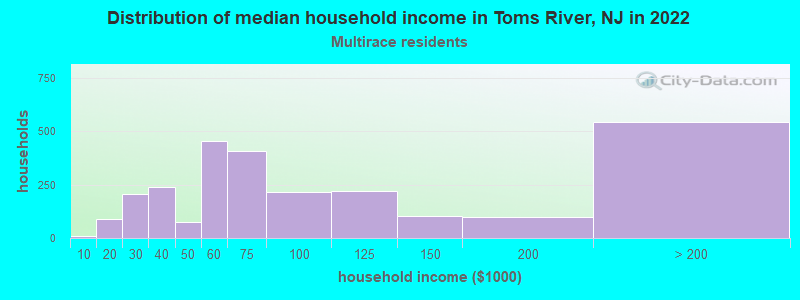
Income and house value in Toms River Median household income in 2022 $96,020 White non-Hispanic householders$51,941 Black householders$143,191 Asian householders$79,420 Some other race householders$61,383 Two or more races householders$79,127 Hispanic or Latino race householdersMedian 2022 house value $395,217 White Non-Hispanic householders$380,323 Black or African American householders$338,567 American Indian or Alaska Native householders $452,664 Asian householders$410,376 Some other race householders$362,503 Two or more races householders$407,451 Hispanic or Latino householders
Median age by race in Toms River
46.8 Median age for White residents45.0 48.1 30.0 Median age for Black or African American residents29.5 30.5 -666,666,666.0 Median age for American Indian / Alaska Native residents-666,666,666.0 -666,666,666.0 49.4 Median age for Asian residents47.5 49.5 -666,666,666.0 Median age for Native Hawaiian / Pacific Islander residents-666,666,666.0 -666,666,666.0 22.5 Median age for Other race residents20.9 22.7 30.0 Median age for Two or more races residents34.0 23.8 47.8 Median age for White alone residents46.2 48.8 25.9 Median age for Hispanic or Latino residents25.5 29.7
Owner/renter occupied households by race in Toms River
House owners and renters - White residents 25,567 85.5% Owner occupied4,329 14.5% Renter occupiedHouse owners and renters - Black or African American residents 540 46.3% Owner occupied626 53.7% Renter occupiedHouse owners and renters - American Indian / Alaska Native residents 115 89.9% Owner occupied13 10.1% Renter occupiedHouse owners and renters - Asian residents 593 82.1% Owner occupied129 17.9% Renter occupiedHouse owners and renters - Other race residents 967 86.6% Owner occupied150 13.4% Renter occupiedHouse owners and renters - Two or more races residents 1,610 75.9% Owner occupied512 24.1% Renter occupiedHouse owners and renters - White alone residents 25,058 85.7% Owner occupied4,180 14.3% Renter occupiedHouse owners and renters - Hispanic or Latino residents 2,131 74.0% Owner occupied749 26.0% Renter occupied
Language usage in Toms River
English speakers - Total 87.2% of residents of Toms River speak English at home.
7.0% of residents speak Spanish at home 3,318 53.0% Speak English very well2,939 47.0% Speak English less than very well5.7% of residents speak other language at home 3,770 74.0% Speak English very well1,326 26.0% Speak English less than very well
English speakers - Born in the United States 93.2% of residents of Toms River speak English at home.
2.5% of residents speak Spanish at home 461 83.8% Speak English very well89 16.2% Speak English less than very well4.4% of residents speak other language at home 884 91.3% Speak English very well84 8.7% Speak English less than very well
English speakers - Native, born elsewhere 40.8% of residents of Toms River speak English at home.
52.7% of residents speak Spanish at home 319 43.5% Speak English very well414 56.5% Speak English less than very well6.5% of residents speak other language at home 91 100.0% Speak English very well
English speakers - Foreign-born 22.8% of residents of Toms River speak English at home.
33.1% of residents speak Spanish at home 1,178 43.8% Speak English very well1,509 56.2% Speak English less than very well44.1% of residents speak other language at home 2,397 66.8% Speak English very well1,190 33.2% Speak English less than very well
White (Caucasian) - Speak only English Native:
97.4% (66,025)Foreign-born:
47.0% (855)
White (Caucasian) - Speak another language Native:
2.6% (1,738)Foreign-born:
53.0% (964)
Black or African American - Speak only English Native:
95.3% (2,676)Foreign-born:
41.1% (280)
Black or African American - Speak another language Native:
4.8% (135)Foreign-born:
58.6% (399)
American Indian / Alaska Native - Speak another language Native:
100.0% (136)Foreign-born:
97.6% (257)
Asian - Speak only English Native:
89.9% (968)Foreign-born:
15.2% (263)
Asian - Speak another language Native:
13.8% (149)Foreign-born:
84.9% (1,467)
Other race - Speak only English Native:
38.9% (1,191)Foreign-born:
10.2% (209)
Other race - Speak another language Native:
61.1% (1,867)Foreign-born:
89.8% (1,845)
Two or more races - Speak only English Native:
80.3% (5,747)Foreign-born:
23.6% (193)
Two or more races - Speak another language Native:
19.7% (1,414)Foreign-born:
76.4% (626)
White alone - Speak only English Native:
97.5% (65,008)Foreign-born:
49.3% (855)
White alone - Speak another language Native:
2.5% (1,663)Foreign-born:
50.7% (879)
Hispanic or Latino - Speak only English Native:
57.6% (4,489)Foreign-born:
9.5% (273)
Hispanic or Latino - Speak another language Native:
42.4% (3,308)Foreign-born:
90.5% (2,596)
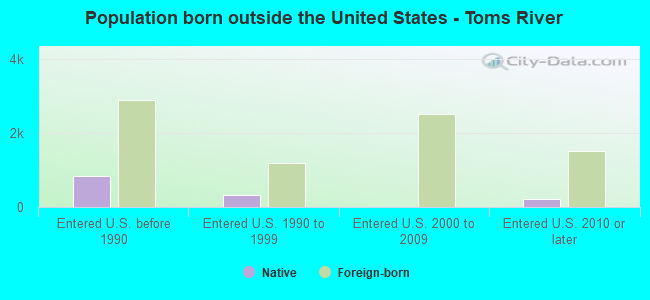
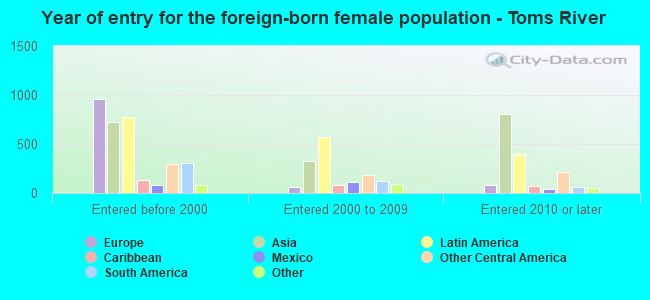
Foreign-born residents in Toms River 8,738 residents are foreign born (3.3% Latin America , 2.9% Asia , 2.5% Europe ).
This city:
9.2%New Jersey:
23.2%
Marital status for residents in Toms River Marital status - White (Caucasian) population 15 years and over
Males 34.9% Never married54.4% Now married0.6% Separated2.2% Widowed7.9% DivorcedFemales 28.7% Never married47.0% Now married1.1% Separated11.7% Widowed11.4% DivorcedWomen who gave birth in the past 12 months Now married:
83.8% (565)Unmarried:
16.2% (109)
Women who did not give birth in the past 12 months Now married:
38.9% (5,461)Unmarried:
61.1% (8,588)
Marital status - Black or African American population 15 years and over
Males 55.3% Never married39.1% Now married0.0% Separated0.3% Widowed5.4% DivorcedFemales 49.8% Never married28.5% Now married0.8% Separated9.4% Widowed11.5% DivorcedWomen who gave birth in the past 12 months Now married:
81.0% (65)Unmarried:
19.0% (15)
Women who did not give birth in the past 12 months Now married:
26.2% (233)Unmarried:
73.8% (657)
Marital status - American Indian / Alaska Native population 15 years and over
Males 43.6% Never married51.5% Now married4.9% Separated0.0% Widowed0.0% DivorcedFemales 0.0% Never married94.0% Now married0.0% Separated0.0% Widowed6.0% DivorcedWomen who did not give birth in the past 12 months Now married:
100.0% (9)Unmarried:
0.0% (0)
Marital status - Asian population 15 years and over
Males 42.8% Never married49.9% Now married4.3% Separated0.3% Widowed2.6% DivorcedFemales 33.0% Never married58.3% Now married0.0% Separated6.9% Widowed1.7% DivorcedWomen who gave birth in the past 12 months Now married:
0.0% (0)Unmarried:
100.0% (16)
Women who did not give birth in the past 12 months Now married:
46.3% (457)Unmarried:
53.7% (529)
Marital status - Other race population 15 years and over
Males 17.7% Never married65.5% Now married0.0% Separated0.0% Widowed16.9% DivorcedFemales 37.2% Never married59.5% Now married0.0% Separated1.5% Widowed1.7% DivorcedWomen who gave birth in the past 12 months Now married:
100.0% (73)Unmarried:
0.0% (0)
Women who did not give birth in the past 12 months Now married:
56.8% (653)Unmarried:
43.2% (496)
Marital status - Two or more races population 15 years and over
Males 78.2% Never married21.8% Now married0.0% Separated0.0% Widowed0.0% DivorcedFemales 43.0% Never married43.6% Now married0.0% Separated2.3% Widowed11.0% DivorcedWomen who gave birth in the past 12 months Now married:
37.5% (21)Unmarried:
62.5% (35)
Women who did not give birth in the past 12 months Now married:
23.8% (387)Unmarried:
76.2% (1,238)
Marital status - White alone, not Hispanic / Latino population 15 years and over
Males 34.6% Never married54.5% Now married0.6% Separated2.2% Widowed8.1% DivorcedFemales 28.6% Never married47.0% Now married1.1% Separated11.9% Widowed11.4% DivorcedWomen who gave birth in the past 12 months Now married:
83.8% (565)Unmarried:
16.2% (109)
Women who did not give birth in the past 12 months Now married:
38.3% (5,231)Unmarried:
61.7% (8,439)
Marital status - Hispanic or Latino population 15 years and over
Males 48.1% Never married35.0% Now married0.0% Separated0.0% Widowed16.9% DivorcedFemales 50.3% Never married39.6% Now married0.0% Separated0.5% Widowed9.6% DivorcedWomen who gave birth in the past 12 months Now married:
78.1% (61)Unmarried:
21.9% (17)
Women who did not give birth in the past 12 months Now married:
42.2% (1,104)Unmarried:
57.8% (1,509)
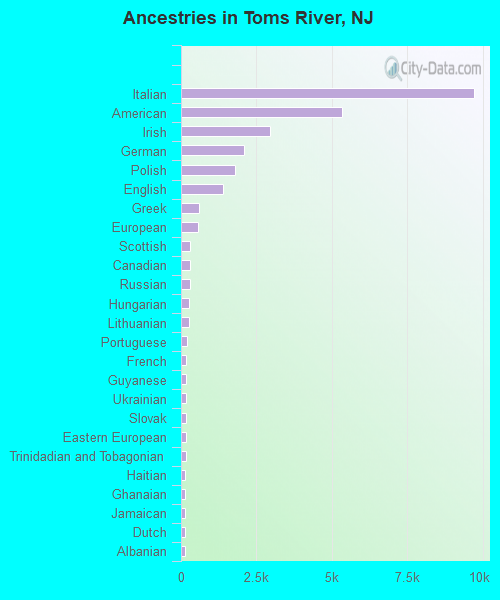
Ancestries in Toms River
9,719 24.1% Italian5,344 13.2% American2,933 7.3% Irish2,100 5.2% German1,799 4.5% Polish1,377 3.4% English582 1.4% Greek552 1.4% European306 0.8% Scottish285 0.7% Canadian285 0.7% Russian256 0.6% Hungarian251 0.6% Lithuanian183 0.5% Portuguese181 0.4% French166 0.4% Guyanese159 0.4% Ukrainian152 0.4% Slovak152 0.4% Eastern European150 0.4% Trinidadian and Tobagonian146 0.4% Haitian143 0.4% Ghanaian141 0.3% Jamaican140 0.3% Dutch116 0.3% Albanian100 0.2% Scandinavian99 0.2% Turkish90 0.2% Egyptian88 0.2% Norwegian88 0.2% Israeli82 0.2% Scotch-Irish66 0.2% Swedish59 0.1% Austrian55 0.1% Latvian55 0.1% Armenian53 0.1% Lebanese52 0.1% Czechoslovakian49 0.1% Welsh46 0.1% Czech43 0.1% Iranian39 0.10% British29 0.07% Brazilian28 0.07% Slavic23 0.06% Croatian18 0.04% Cypriot17 0.04% African16 0.04% French Canadian16 0.04% Moroccan14 0.03% Celtic13 0.03% Bahamian10 0.02% Pennsylvania German10 0.02% Romanian10 0.02% South African9 0.02% Maltese8 0.02% Basque7 0.02% Danish7 0.02% Serbian7 0.02% Swiss6 0.01% Northern European4 0.01% Icelander3 0.01% Estonian3 0.01% Assyrian
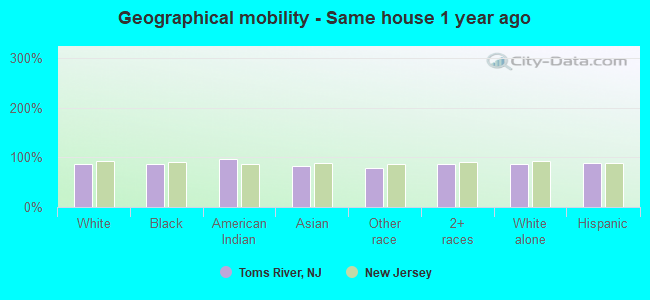
Geographical mobility in Toms River Same house 1 year ago 62,186 86.2% White (Caucasian)3,470 86.2% Black or African American391 96.6% American Indian / Alaska Native2,730 82.0% Asian3,321 79.4% Other race7,048 85.7% Two or more races60,796 86.0% White alone, not Hispanic / Latino10,587 88.0% Hispanic or LatinoMoved within same county 6,950 9.6% White / Caucasian437 10.9% Black or African American342 10.3% Asian104 2.5% Other race676 8.2% Two or more races6,867 9.7% White alone, not Hispanic / Latino210 1.7% Hispanic or LatinoMoved within same state 1,304 1.8% White / Caucasian43 1.1% Black or African American40 1.2% Asian99 2.4% Other race260 3.2% Two or more races1,304 1.8% White alone, not Hispanic / Latino1,066 8.9% Hispanic or LatinoMoved from different state 1,383 1.9% White / Caucasian81 2.0% Black or African American143 4.3% Asian624 14.9% Other race4 0.0% Two or more races1,383 2.0% White alone, not Hispanic / Latino92 0.8% Hispanic or LatinoMoved from abroad 348 0.5% White47 1.4% Asian23 0.5% Other race24 0.3% Two or more races348 0.5% White alone, not Hispanic / Latino78 0.6% Hispanic or Latino
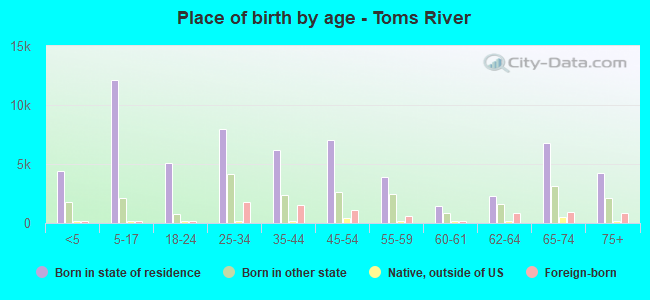
Children Nativity (place of birth) in Toms River
Children under 6 years - Living with two parents Both parents native 3,621 100.0% NativeBoth parents foreign-born 446 100.0% NativeOne native, one foreign-born parent 381 100.0% NativeChildren under 6 years - Living with one parent Native parent 914 100.0% NativeForeign-born parent 230 100.0% NativeChildren 6 to 17 years - Living with two parents Both parents native 8,542 100.0% NativeBoth parents foreign-born 435 58.1% Native314 41.9% Foreign-bornOne native, one foreign-born parent 966 77.8% Native275 22.2% Foreign-bornChildren 6 to 17 years - Living with one parent Native parent 3,061 100.0% NativeForeign-born parent 1,122 52.0% Native1,034 48.0% Foreign-born
Grandparents responsible for own grandchildren in Toms River
Grandparents (30 to 59 years) White / Caucasian 51 21.9% Responsible for grandchildren180 78.1% Not responsible for grandchildrenBlack or African American 48 100.0% Not responsible for grandchildrenOther race 30 100.0% Not responsible for grandchildrenWhite alone, not Hispanic / Latino 60 28.9% Responsible for grandchildren147 71.1% Not responsible for grandchildrenHispanic or Latino 72 100.0% Not responsible for grandchildrenGrandparents (60 years and over) White / Caucasian 354 30.9% Responsible for grandchildren792 69.1% Not responsible for grandchildrenBlack or African American 12 21.8% Responsible for grandchildren43 78.2% Not responsible for grandchildrenOther race 23 100.0% Not responsible for grandchildrenWhite alone, not Hispanic / Latino 394 32.9% Responsible for grandchildren801 67.1% Not responsible for grandchildrenHispanic or Latino 7 10.8% Responsible for grandchildren59 89.2% Not responsible for grandchildren