Races in Tracyton, Washington (WA) Detailed Stats
Data:
Races - White alone (%)
Races - White alone (% change since 2000)
Races - Black alone (%)
Races - Black alone (% change since 2000)
Races - American Indian alone (%)
Races - American Indian alone (% change since 2000)
Races - Asian alone (%)
Races - Asian alone (% change since 2000)
Races - Hispanic (%)
Races - Hispanic (% change since 2000)
Races - Native Hawaiian and Other Pacific Islander alone (%)
Races - Native Hawaiian and Other Pacific Islander alone (% change since 2000)
Races - Two or more races(%)
Races - Two or more races(% change since 2000)
Races - Other race alone (%)
Races - Other race alone (% change since 2000)
Racial diversity
Place of birth - Born in state of residence (%)
Place of birth - Born in state of residence (%) - White
Place of birth - Born in state of residence (%) - Black or African American
Place of birth - Born in state of residence (%) - Asian
Place of birth - Born in state of residence (%) - Hispanic or Latino
Place of birth - Born in state of residence (%) - American Indian and Alaska Native
Place of birth - Born in state of residence (%) - Multirace
Place of birth - Born in state of residence (%) - Other Race
Place of birth - Born in other state (%)
Place of birth - Born in other state (%) - White
Place of birth - Born in other state (%) - Black or African American
Place of birth - Born in other state (%) - Asian
Place of birth - Born in other state (%) - Hispanic or Latino
Place of birth - Born in other state (%) - American Indian and Alaska Native
Place of birth - Born in other state (%) - Multirace
Place of birth - Born in other state (%) - Other Race
Place of birth - Native, outside of US (%)
Place of birth - Native, outside of US (%) - White
Place of birth - Native, outside of US (%) - Black or African American
Place of birth - Native, outside of US (%) - Asian
Place of birth - Native, outside of US (%) - Hispanic or Latino
Place of birth - Native, outside of US (%) - American Indian and Alaska Native
Place of birth - Native, outside of US (%) - Multirace
Place of birth - Native, outside of US (%) - Other Race
Place of birth - Foreign born (%)
Place of birth - Foreign born (%) - White
Place of birth - Foreign born (%) - Black or African American
Place of birth - Foreign born (%) - Asian
Place of birth - Foreign born (%) - Hispanic or Latino
Place of birth - Foreign born (%) - American Indian and Alaska Native
Place of birth - Foreign born (%) - Multirace
Place of birth - Foreign born (%) - Other Race
Residents speaking English at home (%)
Residents speaking English at home - Born in the United States (%)
Residents speaking English at home - Native, born elsewhere (%)
Residents speaking English at home - Foreign born (%)
Residents speaking Spanish at home (%)
Residents speaking Spanish at home - Born in the United States (%)
Residents speaking Spanish at home - Native, born elsewhere (%)
Residents speaking Spanish at home - Foreign born (%)
Residents speaking other language at home (%)
Residents speaking other language at home - Born in the United States (%)
Residents speaking other language at home - Native, born elsewhere (%)
Residents speaking other language at home - Foreign born (%)
Marital status - Never married (%)
Marital status - Now married (%)
Marital status - Separated (%)
Marital status - Widowed (%)
Marital status - Divorced (%)
Ancestries Reported - Arab (%)
Ancestries Reported - Czech (%)
Ancestries Reported - Danish (%)
Ancestries Reported - Dutch (%)
Ancestries Reported - English (%)
Ancestries Reported - French (%)
Ancestries Reported - French Canadian (%)
Ancestries Reported - German (%)
Ancestries Reported - Greek (%)
Ancestries Reported - Hungarian (%)
Ancestries Reported - Irish (%)
Ancestries Reported - Italian (%)
Ancestries Reported - Lithuanian (%)
Ancestries Reported - Norwegian (%)
Ancestries Reported - Polish (%)
Ancestries Reported - Portuguese (%)
Ancestries Reported - Russian (%)
Ancestries Reported - Scotch-Irish (%)
Ancestries Reported - Scottish (%)
Ancestries Reported - Slovak (%)
Ancestries Reported - Subsaharan African (%)
Ancestries Reported - Swedish (%)
Ancestries Reported - Swiss (%)
Ancestries Reported - Ukrainian (%)
Ancestries Reported - United States (%)
Ancestries Reported - Welsh (%)
Ancestries Reported - West Indian (%)
Ancestries Reported - Other (%)
Geographical mobility - Same house 1 year ago (%)
Geographical mobility - Same house 1 year ago (%) - White
Geographical mobility - Same house 1 year ago (%) - Black or African American
Geographical mobility - Same house 1 year ago (%) - Asian
Geographical mobility - Same house 1 year ago (%) - Hispanic or Latino
Geographical mobility - Same house 1 year ago (%) - American Indian and Alaska Native
Geographical mobility - Same house 1 year ago (%) - Multirace
Geographical mobility - Same house 1 year ago (%) - Other Race
Geographical mobility - Moved within same county (%)
Geographical mobility - Moved within same county (%) - White
Geographical mobility - Moved within same county (%) - Black or African American
Geographical mobility - Moved within same county (%) - Asian
Geographical mobility - Moved within same county (%) - Hispanic or Latino
Geographical mobility - Moved within same county (%) - American Indian and Alaska Native
Geographical mobility - Moved within same county (%) - Multirace
Geographical mobility - Moved within same county (%) - Other Race
Geographical mobility - Moved from different county within same state (%)
Geographical mobility - Moved from different county within same state (%) - White
Geographical mobility - Moved from different county within same state (%) - Black or African American
Geographical mobility - Moved from different county within same state (%) - Asian
Geographical mobility - Moved from different county within same state (%) - Hispanic or Latino
Geographical mobility - Moved from different county within same state (%) - American Indian and Alaska Native
Geographical mobility - Moved from different county within same state (%) - Multirace
Geographical mobility - Moved from different county within same state (%) - Other Race
Geographical mobility - Moved from different state (%)
Geographical mobility - Moved from different state (%) - White
Geographical mobility - Moved from different state (%) - Black or African American
Geographical mobility - Moved from different state (%) - Asian
Geographical mobility - Moved from different state (%) - Hispanic or Latino
Geographical mobility - Moved from different state (%) - American Indian and Alaska Native
Geographical mobility - Moved from different state (%) - Multirace
Geographical mobility - Moved from different state (%) - Other Race
Geographical mobility - Moved from abroad (%)
Geographical mobility - Moved from abroad (%) - White
Geographical mobility - Moved from abroad (%) - Black or African American
Geographical mobility - Moved from abroad (%) - Asian
Geographical mobility - Moved from abroad (%) - Hispanic or Latino
Geographical mobility - Moved from abroad (%) - American Indian and Alaska Native
Geographical mobility - Moved from abroad (%) - Multirace
Geographical mobility - Moved from abroad (%) - Other Race
Place of birth for the foreign-born population - Ireland (%)
Place of birth for the foreign-born population - Denmark (%)
Place of birth for the foreign-born population - Norway (%)
Place of birth for the foreign-born population - Sweden (%)
Place of birth for the foreign-born population - United Kingdom (%)
Place of birth for the foreign-born population - England (%)
Place of birth for the foreign-born population - Scotland (%)
Place of birth for the foreign-born population - Other Northern Europe (%)
Place of birth for the foreign-born population - Austria (%)
Place of birth for the foreign-born population - Belgium (%)
Place of birth for the foreign-born population - France (%)
Place of birth for the foreign-born population - Germany (%)
Place of birth for the foreign-born population - Netherlands (%)
Place of birth for the foreign-born population - Switzerland (%)
Place of birth for the foreign-born population - Other Western Europe (%)
Place of birth for the foreign-born population - Greece (%)
Place of birth for the foreign-born population - Italy (%)
Place of birth for the foreign-born population - Portugal (%)
Place of birth for the foreign-born population - Spain (%)
Place of birth for the foreign-born population - Other Southern Europe (%)
Place of birth for the foreign-born population - Albania (%)
Place of birth for the foreign-born population - Belarus (%)
Place of birth for the foreign-born population - Bosnia and Herzegovina (%)
Place of birth for the foreign-born population - Bulgaria (%)
Place of birth for the foreign-born population - Croatia (%)
Place of birth for the foreign-born population - Czechoslovakia (%)
Place of birth for the foreign-born population - Hungary (%)
Place of birth for the foreign-born population - Latvia (%)
Place of birth for the foreign-born population - Lithuania (%)
Place of birth for the foreign-born population - North Macedonia (Macedonia) (%)
Place of birth for the foreign-born population - Moldova (%)
Place of birth for the foreign-born population - Poland (%)
Place of birth for the foreign-born population - Romania (%)
Place of birth for the foreign-born population - Russia (%)
Place of birth for the foreign-born population - Serbia (%)
Place of birth for the foreign-born population - Ukraine (%)
Place of birth for the foreign-born population - Other Eastern Europe (%)
Place of birth for the foreign-born population - China (%)
Place of birth for the foreign-born population - Hong Kong (%)
Place of birth for the foreign-born population - Taiwan (%)
Place of birth for the foreign-born population - Japan (%)
Place of birth for the foreign-born population - Korea (%)
Place of birth for the foreign-born population - Other Eastern Asia (%)
Place of birth for the foreign-born population - Afghanistan (%)
Place of birth for the foreign-born population - Bangladesh (%)
Place of birth for the foreign-born population - India (%)
Place of birth for the foreign-born population - Iran (%)
Place of birth for the foreign-born population - Kazakhstan (%)
Place of birth for the foreign-born population - Nepal (%)
Place of birth for the foreign-born population - Pakistan (%)
Place of birth for the foreign-born population - Sri Lanka (%)
Place of birth for the foreign-born population - Uzbekistan (%)
Place of birth for the foreign-born population - Other South Central Asia (%)
Place of birth for the foreign-born population - Burma (%)
Place of birth for the foreign-born population - Cambodia (%)
Place of birth for the foreign-born population - Indonesia (%)
Place of birth for the foreign-born population - Laos (%)
Place of birth for the foreign-born population - Malaysia (%)
Place of birth for the foreign-born population - Philippines (%)
Place of birth for the foreign-born population - Singapore (%)
Place of birth for the foreign-born population - Thailand (%)
Place of birth for the foreign-born population - Vietnam (%)
Place of birth for the foreign-born population - Other South Eastern Asia (%)
Place of birth for the foreign-born population - Armenia (%)
Place of birth for the foreign-born population - Iraq (%)
Place of birth for the foreign-born population - Israel (%)
Place of birth for the foreign-born population - Jordan (%)
Place of birth for the foreign-born population - Kuwait (%)
Place of birth for the foreign-born population - Lebanon (%)
Place of birth for the foreign-born population - Saudi Arabia (%)
Place of birth for the foreign-born population - Syria (%)
Place of birth for the foreign-born population - Turkey (%)
Place of birth for the foreign-born population - Yemen (%)
Place of birth for the foreign-born population - Other Western Asia (%)
Place of birth for the foreign-born population - Eritrea (%)
Place of birth for the foreign-born population - Ethiopia (%)
Place of birth for the foreign-born population - Kenya (%)
Place of birth for the foreign-born population - Somalia (%)
Place of birth for the foreign-born population - Uganda (%)
Place of birth for the foreign-born population - Zimbabwe (%)
Place of birth for the foreign-born population - Other Eastern Africa (%)
Place of birth for the foreign-born population - Cameroon (%)
Place of birth for the foreign-born population - Congo (%)
Place of birth for the foreign-born population - Democratic Republic of Congo (Zaire) (%)
Place of birth for the foreign-born population - Other Middle Africa (%)
Place of birth for the foreign-born population - Egypt (%)
Place of birth for the foreign-born population - Morocco (%)
Place of birth for the foreign-born population - Sudan (%)
Place of birth for the foreign-born population - Other Northern Africa (%)
Place of birth for the foreign-born population - South Africa (%)
Place of birth for the foreign-born population - Other Southern Africa (%)
Place of birth for the foreign-born population - Cabo Verde (%)
Place of birth for the foreign-born population - Ghana (%)
Place of birth for the foreign-born population - Liberia (%)
Place of birth for the foreign-born population - Nigeria (%)
Place of birth for the foreign-born population - Senegal (%)
Place of birth for the foreign-born population - Sierra Leone (%)
Place of birth for the foreign-born population - Other Western Africa (%)
Place of birth for the foreign-born population - Australia (%)
Place of birth for the foreign-born population - New Zealand (%)
Place of birth for the foreign-born population - Fiji (%)
Place of birth for the foreign-born population - Micronesia (%)
Place of birth for the foreign-born population - Bahamas (%)
Place of birth for the foreign-born population - Barbados (%)
Place of birth for the foreign-born population - Cuba (%)
Place of birth for the foreign-born population - Dominica (%)
Place of birth for the foreign-born population - Dominican Republic (%)
Place of birth for the foreign-born population - Grenada (%)
Place of birth for the foreign-born population - Haiti (%)
Place of birth for the foreign-born population - Jamaica (%)
Place of birth for the foreign-born population - St. Vincent and the Grenadines (%)
Place of birth for the foreign-born population - Trinidad and Tobago (%)
Place of birth for the foreign-born population - West Indies (%)
Place of birth for the foreign-born population - Other Caribbean (%)
Place of birth for the foreign-born population - Belize (%)
Place of birth for the foreign-born population - Costa Rica (%)
Place of birth for the foreign-born population - El Salvador (%)
Place of birth for the foreign-born population - Guatemala (%)
Place of birth for the foreign-born population - Honduras (%)
Place of birth for the foreign-born population - Mexico (%)
Place of birth for the foreign-born population - Nicaragua (%)
Place of birth for the foreign-born population - Panama (%)
Place of birth for the foreign-born population - Other Central America (%)
Place of birth for the foreign-born population - Argentina (%)
Place of birth for the foreign-born population - Bolivia (%)
Place of birth for the foreign-born population - Brazil (%)
Place of birth for the foreign-born population - Chile (%)
Place of birth for the foreign-born population - Colombia (%)
Place of birth for the foreign-born population - Ecuador (%)
Place of birth for the foreign-born population - Guyana (%)
Place of birth for the foreign-born population - Peru (%)
Place of birth for the foreign-born population - Uruguay (%)
Place of birth for the foreign-born population - Venezuela (%)
Place of birth for the foreign-born population - Other South America (%)
Place of birth for the foreign-born population - Canada (%)
Place of birth for the foreign-born population - Other Northern America (%)
Place of birth for the foreign-born population - Other (%)
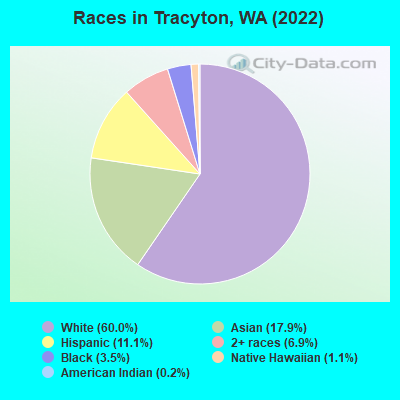
According to 2022 data, the most numerous races in Tracyton, WA are White alone (3,398 residents), Hispanic (626 residents), and Asian alone (1,013 residents). 77.5% of Tracyton residents speak English at home. 17.4% of Tracyton, WA residents are foreign-born (12.2% born in Asia, 2.6% born in Latin America, 1.9% born in Europe), which is 13.7% greater than the foreign-born rate of 15.0% across the entire state of Washington.
Race distribution in Tracyton
2000 2022
4,652,490 78.9% White alone 441,509 7.5% Hispanic 319,401 5.4% Asian alone 184,631 3.1% Black alone 175,926 3.0% Two or more races 85,396 1.4% American Indian alone 22,779 0.4% Native Hawaiian and Other 11,989 0.2% Other race alone
4,941,456 63.5% White alone 1,093,313 14.0% Hispanic 755,832 9.7% Asian alone 523,448 6.7% Two or more races 299,537 3.8% Black alone 69,024 0.9% American Indian alone 52,231 0.7% Native Hawaiian and Other 50,945 0.7% Other race alone
Income and house value in Tracyton Median household income in 2022 $86,513 White non-Hispanic householders$176,167 Black householders$105,883 Asian householders$144,589 Native Hawaiian and other Pacific Islander householders$93,590 Some other race householders$76,476 Two or more races householders$105,152 Hispanic or Latino race householdersMedian 2022 house value $467,570 White Non-Hispanic householders$475,524 Black or African American householders $489,012 Asian householders$475,524 Native Hawaiian and other Pacific Islander householders$389,065 Some other race householders$342,031 Two or more races householders$356,557 Hispanic or Latino householders
Median age by race in Tracyton
41.2 Median age for White residents39.7 47.3 32.5 Median age for Black or African American residents29.5 64.7 43.6 Median age for American Indian / Alaska Native residents47.4 -649,076,516.5 45.9 Median age for Asian residents34.8 55.9 54.9 Median age for Native Hawaiian / Pacific Islander residents29.6 61.9 25.8 Median age for Other race residents27.1 17.9 22.5 Median age for Two or more races residents11.5 29.8 41.9 Median age for White alone residents40.4 47.6 27.2 Median age for Hispanic or Latino residents26.3 27.9
Owner/renter occupied households by race in Tracyton
House owners and renters - White residents 1,173 86.0% Owner occupied192 14.0% Renter occupiedHouse owners and renters - Black or African American residents 43 78.3% Owner occupied12 21.7% Renter occupiedHouse owners and renters - American Indian / Alaska Native residents 6 62.2% Owner occupied4 37.8% Renter occupiedHouse owners and renters - Asian residents 215 67.3% Owner occupied105 32.7% Renter occupiedHouse owners and renters - Native Hawaiian / Pacific Islander residents 63 93.2% Owner occupied5 6.8% Renter occupiedHouse owners and renters - Other race residents 71 85.7% Owner occupied12 14.3% Renter occupiedHouse owners and renters - Two or more races residents 59 35.4% Owner occupied108 64.6% Renter occupiedHouse owners and renters - White alone residents 1,164 86.8% Owner occupied178 13.2% Renter occupiedHouse owners and renters - Hispanic or Latino residents 93 50.1% Owner occupied93 49.9% Renter occupied
Language usage in Tracyton
English speakers - Total 77.5% of residents of Tracyton speak English at home.
6.3% of residents speak Spanish at home 144 41.9% Speak English very well200 58.1% Speak English less than very well17.6% of residents speak other language at home 615 64.3% Speak English very well342 35.7% Speak English less than very well
English speakers - Born in the United States 95.1% of residents of Tracyton speak English at home.
3.4% of residents speak Spanish at home 28 35.4% Speak English very well51 64.6% Speak English less than very well2.0% of residents speak other language at home 46 100.0% Speak English very well
English speakers - Native, born elsewhere 89.7% of residents of Tracyton speak English at home.
12.7% of residents speak other language at home 7 33.3% Speak English very well14 66.7% Speak English less than very well
English speakers - Foreign-born 6.3% of residents of Tracyton speak English at home.
27.7% of residents speak Spanish at home 117 40.2% Speak English very well174 59.8% Speak English less than very well67.7% of residents speak other language at home 402 56.5% Speak English very well310 43.5% Speak English less than very well
White (Caucasian) - Speak only English Native:
98.2% (3,283)Foreign-born:
33.7% (7)
White (Caucasian) - Speak another language Native:
1.8% (60)Foreign-born:
71.6% (16)
Asian - Speak only English Native:
41.5% (147)Foreign-born:
3.4% (23)
Asian - Speak another language Native:
42.9% (152)Foreign-born:
95.1% (631)
Native Hawaiian / Pacific Islander - Speak only English Native:
82.8% (68)Foreign-born:
100.0% (2)
Other race - Speak only English Native:
53.6% (48)Foreign-born:
20.9% (40)
Other race - Speak another language Native:
46.7% (42)Foreign-born:
81.0% (154)
White alone - Speak only English Native:
99.0% (3,229)Foreign-born:
31.0% (7)
White alone - Speak another language Native:
1.0% (33)Foreign-born:
79.8% (19)
Hispanic or Latino - Speak only English Native:
75.9% (207)Foreign-born:
9.7% (34)
Hispanic or Latino - Speak another language Native:
24.0% (66)Foreign-born:
90.0% (314)
Foreign-born residents in Tracyton 984 residents are foreign born (12.2% Asia , 2.6% Latin America , 1.9% Europe ).
This city:
17.4%Washington:
14.9%
Marital status for residents in Tracyton Marital status - White (Caucasian) population 15 years and over
Males 30.2% Never married56.9% Now married1.6% Separated0.8% Widowed10.5% DivorcedFemales 26.6% Never married46.6% Now married0.7% Separated15.9% Widowed10.2% DivorcedWomen who gave birth in the past 12 months Now married:
100.0% (19)Unmarried:
0.0% (0)
Women who did not give birth in the past 12 months Now married:
43.8% (279)Unmarried:
56.2% (358)
Marital status - Black or African American population 15 years and over
Males 56.7% Never married43.3% Now married0.0% Separated0.0% Widowed0.0% DivorcedFemales 42.5% Never married18.8% Now married0.0% Separated0.0% Widowed38.8% DivorcedWomen who did not give birth in the past 12 months Now married:
33.3% (15)Unmarried:
66.7% (30)
Marital status - American Indian / Alaska Native population 15 years and over
Males 25.0% Never married75.0% Now married0.0% Separated0.0% Widowed0.0% DivorcedFemales 0.0% Never married100.0% Now married0.0% Separated0.0% Widowed0.0% DivorcedMarital status - Asian population 15 years and over
Males 27.8% Never married63.8% Now married0.0% Separated0.0% Widowed8.4% DivorcedFemales 1.1% Never married63.2% Now married0.0% Separated5.4% Widowed30.4% DivorcedWomen who gave birth in the past 12 months Now married:
100.0% (16)Unmarried:
0.0% (0)
Women who did not give birth in the past 12 months Now married:
77.6% (136)Unmarried:
22.4% (39)
Marital status - Native Hawaiian / Pacific Islander population 15 years and over
Males 43.3% Never married56.7% Now married0.0% Separated0.0% Widowed0.0% DivorcedFemales 27.1% Never married72.9% Now married0.0% Separated0.0% Widowed0.0% DivorcedWomen who gave birth in the past 12 months Now married:
100.0% (4)Unmarried:
0.0% (0)
Women who did not give birth in the past 12 months Now married:
13.3% (2)Unmarried:
86.7% (14)
Marital status - Other race population 15 years and over
Males 66.4% Never married33.6% Now married0.0% Separated0.0% Widowed0.0% DivorcedFemales 64.1% Never married35.9% Now married0.0% Separated0.0% Widowed0.0% DivorcedWomen who did not give birth in the past 12 months Now married:
35.9% (43)Unmarried:
64.1% (77)
Marital status - Two or more races population 15 years and over
Males 45.5% Never married45.5% Now married0.0% Separated9.1% Widowed0.0% DivorcedFemales 67.5% Never married25.1% Now married0.0% Separated7.1% Widowed0.4% DivorcedWomen who gave birth in the past 12 months Now married:
100.0% (14)Unmarried:
0.0% (0)
Women who did not give birth in the past 12 months Now married:
21.5% (58)Unmarried:
78.5% (213)
Marital status - White alone, not Hispanic / Latino population 15 years and over
Males 28.9% Never married58.7% Now married1.7% Separated0.8% Widowed9.9% DivorcedFemales 26.9% Never married46.1% Now married0.7% Separated16.0% Widowed10.3% DivorcedWomen who gave birth in the past 12 months Now married:
100.0% (19)Unmarried:
0.0% (0)
Women who did not give birth in the past 12 months Now married:
43.1% (272)Unmarried:
56.9% (359)
Marital status - Hispanic or Latino population 15 years and over
Males 62.7% Never married29.4% Now married0.0% Separated0.0% Widowed7.8% DivorcedFemales 68.9% Never married23.2% Now married0.0% Separated0.0% Widowed7.8% DivorcedWomen who gave birth in the past 12 months Now married:
100.0% (11)Unmarried:
0.0% (0)
Women who did not give birth in the past 12 months Now married:
20.2% (53)Unmarried:
79.8% (208)
Ancestries in Tracyton
264 9.7% American210 7.7% English160 5.9% German119 4.4% Norwegian75 2.7% Scottish71 2.6% African47 1.7% European25 0.9% Russian22 0.8% Italian21 0.8% Irish20 0.7% French Canadian17 0.6% Scotch-Irish12 0.4% Finnish10 0.4% Polish8 0.3% Swiss7 0.3% French6 0.2% Turkish4 0.1% Nigerian
Children Nativity (place of birth) in Tracyton
Children under 6 years - Living with two parents Both parents native 146 100.0% NativeBoth parents foreign-born 21 100.0% NativeOne native, one foreign-born parent 31 100.0% NativeChildren under 6 years - Living with one parent Native parent 101 100.0% NativeChildren 6 to 17 years - Living with two parents Both parents native 420 100.0% NativeBoth parents foreign-born 126 69.0% Native57 31.0% Foreign-bornOne native, one foreign-born parent 7 100.0% NativeChildren 6 to 17 years - Living with one parent Native parent 144 100.0% NativeForeign-born parent 36 54.3% Native30 45.7% Foreign-born
Grandparents responsible for own grandchildren in Tracyton
Grandparents (30 to 59 years) White / Caucasian 6 100.0% Responsible for grandchildrenAsian 7 13.2% Responsible for grandchildren46 86.8% Not responsible for grandchildrenNative Hawaiian / Pacific Islander 1 100.0% Responsible for grandchildrenOther race 54 100.0% Responsible for grandchildrenTwo or more races 17 100.0% Not responsible for grandchildrenWhite alone, not Hispanic / Latino 6 100.0% Responsible for grandchildrenHispanic or Latino 75 100.0% Responsible for grandchildrenGrandparents (60 years and over) White / Caucasian 30 100.0% Not responsible for grandchildrenAsian 108 94.8% Responsible for grandchildren6 5.2% Not responsible for grandchildrenTwo or more races 10 100.0% Not responsible for grandchildrenWhite alone, not Hispanic / Latino 18 100.0% Not responsible for grandchildrenHispanic or Latino 11 100.0% Not responsible for grandchildren