Races in Trophy Club, Texas (TX) Detailed Stats
Data:
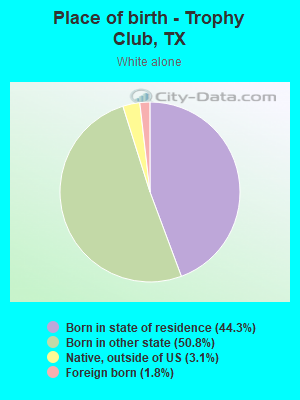
Races - White alone (%)
Races - White alone (% change since 2000)
Races - Black alone (%)
Races - Black alone (% change since 2000)
Races - American Indian alone (%)
Races - American Indian alone (% change since 2000)
Races - Asian alone (%)
Races - Asian alone (% change since 2000)
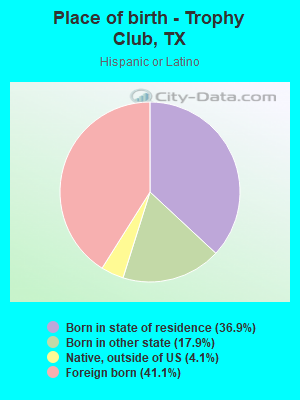
Races - Hispanic (%)
Races - Hispanic (% change since 2000)
Races - Native Hawaiian and Other Pacific Islander alone (%)
Races - Native Hawaiian and Other Pacific Islander alone (% change since 2000)
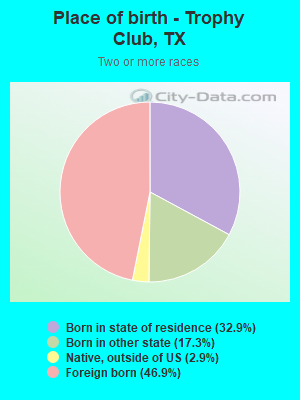
Races - Two or more races(%)
Races - Two or more races(% change since 2000)
Races - Other race alone (%)
Races - Other race alone (% change since 2000)
Racial diversity
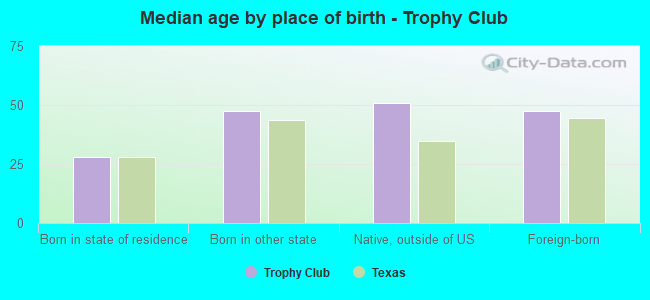
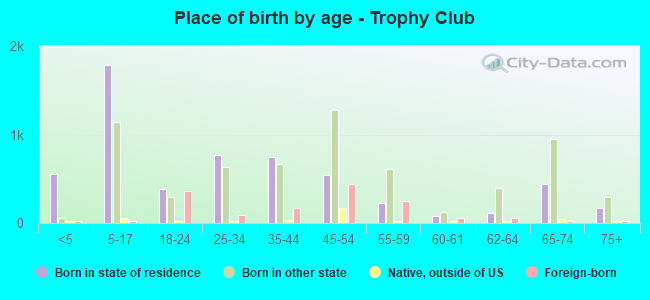
Place of birth - Born in state of residence (%)
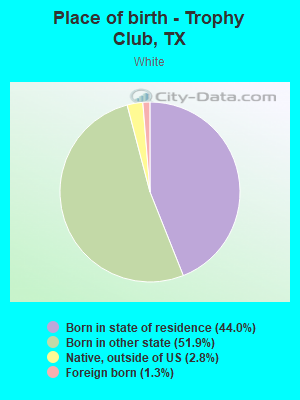
Place of birth - Born in state of residence (%) - White
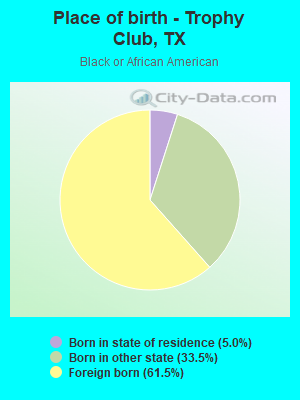
Place of birth - Born in state of residence (%) - Black or African American
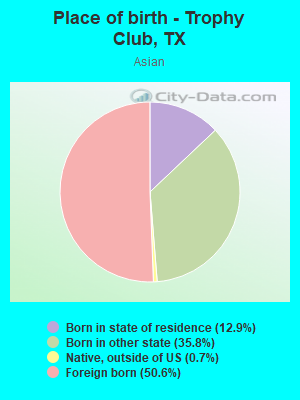
Place of birth - Born in state of residence (%) - Asian
Place of birth - Born in state of residence (%) - Hispanic or Latino
Place of birth - Born in state of residence (%) - American Indian and Alaska Native
Place of birth - Born in state of residence (%) - Multirace
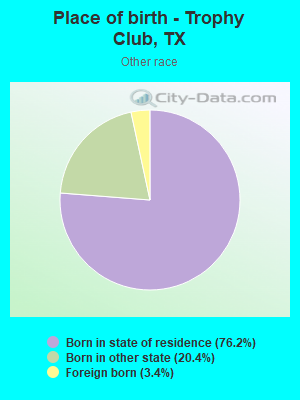
Place of birth - Born in state of residence (%) - Other Race
Place of birth - Born in other state (%)
Place of birth - Born in other state (%) - White
Place of birth - Born in other state (%) - Black or African American
Place of birth - Born in other state (%) - Asian
Place of birth - Born in other state (%) - Hispanic or Latino
Place of birth - Born in other state (%) - American Indian and Alaska Native
Place of birth - Born in other state (%) - Multirace
Place of birth - Born in other state (%) - Other Race
Place of birth - Native, outside of US (%)
Place of birth - Native, outside of US (%) - White
Place of birth - Native, outside of US (%) - Black or African American
Place of birth - Native, outside of US (%) - Asian
Place of birth - Native, outside of US (%) - Hispanic or Latino
Place of birth - Native, outside of US (%) - American Indian and Alaska Native
Place of birth - Native, outside of US (%) - Multirace
Place of birth - Native, outside of US (%) - Other Race
Place of birth - Foreign born (%)
Place of birth - Foreign born (%) - White
Place of birth - Foreign born (%) - Black or African American
Place of birth - Foreign born (%) - Asian
Place of birth - Foreign born (%) - Hispanic or Latino
Place of birth - Foreign born (%) - American Indian and Alaska Native
Place of birth - Foreign born (%) - Multirace
Place of birth - Foreign born (%) - Other Race
Residents speaking English at home (%)
Residents speaking English at home - Born in the United States (%)
Residents speaking English at home - Native, born elsewhere (%)
Residents speaking English at home - Foreign born (%)
Residents speaking Spanish at home (%)
Residents speaking Spanish at home - Born in the United States (%)
Residents speaking Spanish at home - Native, born elsewhere (%)
Residents speaking Spanish at home - Foreign born (%)
Residents speaking other language at home (%)
Residents speaking other language at home - Born in the United States (%)
Residents speaking other language at home - Native, born elsewhere (%)
Residents speaking other language at home - Foreign born (%)
Marital status - Never married (%)
Marital status - Now married (%)
Marital status - Separated (%)
Marital status - Widowed (%)
Marital status - Divorced (%)
Ancestries Reported - Arab (%)
Ancestries Reported - Czech (%)
Ancestries Reported - Danish (%)
Ancestries Reported - Dutch (%)
Ancestries Reported - English (%)
Ancestries Reported - French (%)
Ancestries Reported - French Canadian (%)
Ancestries Reported - German (%)
Ancestries Reported - Greek (%)
Ancestries Reported - Hungarian (%)
Ancestries Reported - Irish (%)
Ancestries Reported - Italian (%)
Ancestries Reported - Lithuanian (%)
Ancestries Reported - Norwegian (%)
Ancestries Reported - Polish (%)
Ancestries Reported - Portuguese (%)
Ancestries Reported - Russian (%)
Ancestries Reported - Scotch-Irish (%)
Ancestries Reported - Scottish (%)
Ancestries Reported - Slovak (%)
Ancestries Reported - Subsaharan African (%)
Ancestries Reported - Swedish (%)
Ancestries Reported - Swiss (%)
Ancestries Reported - Ukrainian (%)
Ancestries Reported - United States (%)
Ancestries Reported - Welsh (%)
Ancestries Reported - West Indian (%)
Ancestries Reported - Other (%)
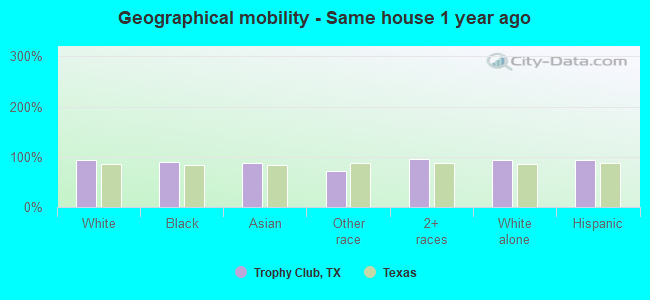
Geographical mobility - Same house 1 year ago (%)
Geographical mobility - Same house 1 year ago (%) - White
Geographical mobility - Same house 1 year ago (%) - Black or African American
Geographical mobility - Same house 1 year ago (%) - Asian
Geographical mobility - Same house 1 year ago (%) - Hispanic or Latino
Geographical mobility - Same house 1 year ago (%) - American Indian and Alaska Native
Geographical mobility - Same house 1 year ago (%) - Multirace
Geographical mobility - Same house 1 year ago (%) - Other Race
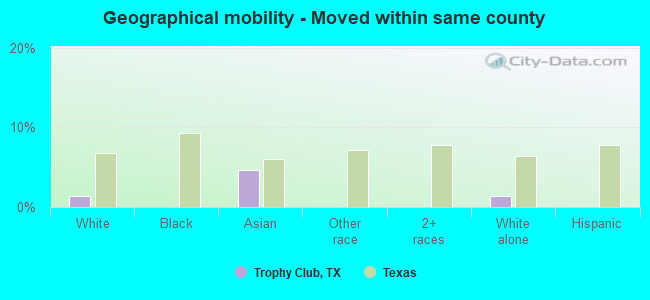
Geographical mobility - Moved within same county (%)
Geographical mobility - Moved within same county (%) - White
Geographical mobility - Moved within same county (%) - Black or African American
Geographical mobility - Moved within same county (%) - Asian
Geographical mobility - Moved within same county (%) - Hispanic or Latino
Geographical mobility - Moved within same county (%) - American Indian and Alaska Native
Geographical mobility - Moved within same county (%) - Multirace
Geographical mobility - Moved within same county (%) - Other Race
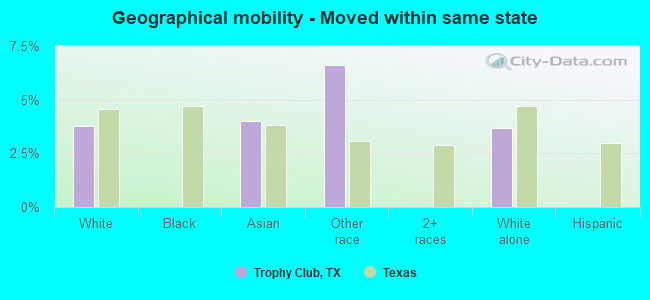
Geographical mobility - Moved from different county within same state (%)
Geographical mobility - Moved from different county within same state (%) - White
Geographical mobility - Moved from different county within same state (%) - Black or African American
Geographical mobility - Moved from different county within same state (%) - Asian
Geographical mobility - Moved from different county within same state (%) - Hispanic or Latino
Geographical mobility - Moved from different county within same state (%) - American Indian and Alaska Native
Geographical mobility - Moved from different county within same state (%) - Multirace
Geographical mobility - Moved from different county within same state (%) - Other Race
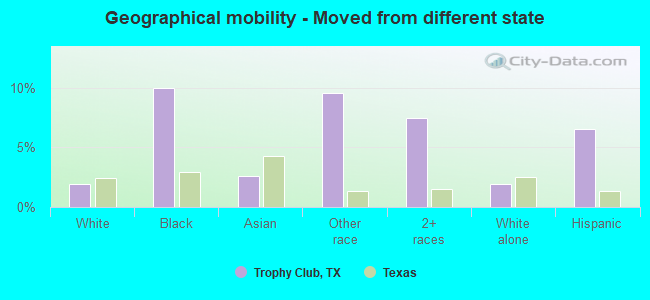
Geographical mobility - Moved from different state (%)
Geographical mobility - Moved from different state (%) - White
Geographical mobility - Moved from different state (%) - Black or African American
Geographical mobility - Moved from different state (%) - Asian
Geographical mobility - Moved from different state (%) - Hispanic or Latino
Geographical mobility - Moved from different state (%) - American Indian and Alaska Native
Geographical mobility - Moved from different state (%) - Multirace
Geographical mobility - Moved from different state (%) - Other Race
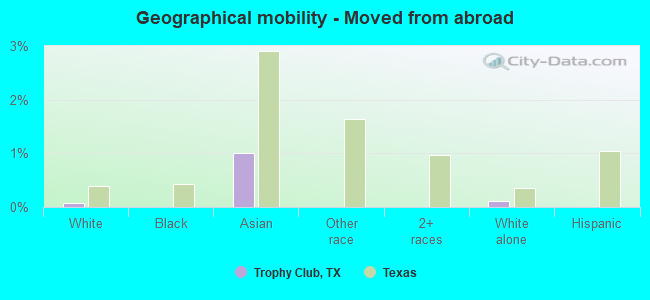
Geographical mobility - Moved from abroad (%)
Geographical mobility - Moved from abroad (%) - White
Geographical mobility - Moved from abroad (%) - Black or African American
Geographical mobility - Moved from abroad (%) - Asian
Geographical mobility - Moved from abroad (%) - Hispanic or Latino
Geographical mobility - Moved from abroad (%) - American Indian and Alaska Native
Geographical mobility - Moved from abroad (%) - Multirace
Geographical mobility - Moved from abroad (%) - Other Race
Place of birth for the foreign-born population - Ireland (%)
Place of birth for the foreign-born population - Denmark (%)
Place of birth for the foreign-born population - Norway (%)
Place of birth for the foreign-born population - Sweden (%)
Place of birth for the foreign-born population - United Kingdom (%)
Place of birth for the foreign-born population - England (%)
Place of birth for the foreign-born population - Scotland (%)
Place of birth for the foreign-born population - Other Northern Europe (%)
Place of birth for the foreign-born population - Austria (%)
Place of birth for the foreign-born population - Belgium (%)
Place of birth for the foreign-born population - France (%)
Place of birth for the foreign-born population - Germany (%)
Place of birth for the foreign-born population - Netherlands (%)
Place of birth for the foreign-born population - Switzerland (%)
Place of birth for the foreign-born population - Other Western Europe (%)
Place of birth for the foreign-born population - Greece (%)
Place of birth for the foreign-born population - Italy (%)
Place of birth for the foreign-born population - Portugal (%)
Place of birth for the foreign-born population - Spain (%)
Place of birth for the foreign-born population - Other Southern Europe (%)
Place of birth for the foreign-born population - Albania (%)
Place of birth for the foreign-born population - Belarus (%)
Place of birth for the foreign-born population - Bosnia and Herzegovina (%)
Place of birth for the foreign-born population - Bulgaria (%)
Place of birth for the foreign-born population - Croatia (%)
Place of birth for the foreign-born population - Czechoslovakia (%)
Place of birth for the foreign-born population - Hungary (%)
Place of birth for the foreign-born population - Latvia (%)
Place of birth for the foreign-born population - Lithuania (%)
Place of birth for the foreign-born population - North Macedonia (Macedonia) (%)
Place of birth for the foreign-born population - Moldova (%)
Place of birth for the foreign-born population - Poland (%)
Place of birth for the foreign-born population - Romania (%)
Place of birth for the foreign-born population - Russia (%)
Place of birth for the foreign-born population - Serbia (%)
Place of birth for the foreign-born population - Ukraine (%)
Place of birth for the foreign-born population - Other Eastern Europe (%)
Place of birth for the foreign-born population - China (%)
Place of birth for the foreign-born population - Hong Kong (%)
Place of birth for the foreign-born population - Taiwan (%)
Place of birth for the foreign-born population - Japan (%)
Place of birth for the foreign-born population - Korea (%)
Place of birth for the foreign-born population - Other Eastern Asia (%)
Place of birth for the foreign-born population - Afghanistan (%)
Place of birth for the foreign-born population - Bangladesh (%)
Place of birth for the foreign-born population - India (%)
Place of birth for the foreign-born population - Iran (%)
Place of birth for the foreign-born population - Kazakhstan (%)
Place of birth for the foreign-born population - Nepal (%)
Place of birth for the foreign-born population - Pakistan (%)
Place of birth for the foreign-born population - Sri Lanka (%)
Place of birth for the foreign-born population - Uzbekistan (%)
Place of birth for the foreign-born population - Other South Central Asia (%)
Place of birth for the foreign-born population - Burma (%)
Place of birth for the foreign-born population - Cambodia (%)
Place of birth for the foreign-born population - Indonesia (%)
Place of birth for the foreign-born population - Laos (%)
Place of birth for the foreign-born population - Malaysia (%)
Place of birth for the foreign-born population - Philippines (%)
Place of birth for the foreign-born population - Singapore (%)
Place of birth for the foreign-born population - Thailand (%)
Place of birth for the foreign-born population - Vietnam (%)
Place of birth for the foreign-born population - Other South Eastern Asia (%)
Place of birth for the foreign-born population - Armenia (%)
Place of birth for the foreign-born population - Iraq (%)
Place of birth for the foreign-born population - Israel (%)
Place of birth for the foreign-born population - Jordan (%)
Place of birth for the foreign-born population - Kuwait (%)
Place of birth for the foreign-born population - Lebanon (%)
Place of birth for the foreign-born population - Saudi Arabia (%)
Place of birth for the foreign-born population - Syria (%)
Place of birth for the foreign-born population - Turkey (%)
Place of birth for the foreign-born population - Yemen (%)
Place of birth for the foreign-born population - Other Western Asia (%)
Place of birth for the foreign-born population - Eritrea (%)
Place of birth for the foreign-born population - Ethiopia (%)
Place of birth for the foreign-born population - Kenya (%)
Place of birth for the foreign-born population - Somalia (%)
Place of birth for the foreign-born population - Uganda (%)
Place of birth for the foreign-born population - Zimbabwe (%)
Place of birth for the foreign-born population - Other Eastern Africa (%)
Place of birth for the foreign-born population - Cameroon (%)
Place of birth for the foreign-born population - Congo (%)
Place of birth for the foreign-born population - Democratic Republic of Congo (Zaire) (%)
Place of birth for the foreign-born population - Other Middle Africa (%)
Place of birth for the foreign-born population - Egypt (%)
Place of birth for the foreign-born population - Morocco (%)
Place of birth for the foreign-born population - Sudan (%)
Place of birth for the foreign-born population - Other Northern Africa (%)
Place of birth for the foreign-born population - South Africa (%)
Place of birth for the foreign-born population - Other Southern Africa (%)
Place of birth for the foreign-born population - Cabo Verde (%)
Place of birth for the foreign-born population - Ghana (%)
Place of birth for the foreign-born population - Liberia (%)
Place of birth for the foreign-born population - Nigeria (%)
Place of birth for the foreign-born population - Senegal (%)
Place of birth for the foreign-born population - Sierra Leone (%)
Place of birth for the foreign-born population - Other Western Africa (%)
Place of birth for the foreign-born population - Australia (%)
Place of birth for the foreign-born population - New Zealand (%)
Place of birth for the foreign-born population - Fiji (%)
Place of birth for the foreign-born population - Micronesia (%)
Place of birth for the foreign-born population - Bahamas (%)
Place of birth for the foreign-born population - Barbados (%)
Place of birth for the foreign-born population - Cuba (%)
Place of birth for the foreign-born population - Dominica (%)
Place of birth for the foreign-born population - Dominican Republic (%)
Place of birth for the foreign-born population - Grenada (%)
Place of birth for the foreign-born population - Haiti (%)
Place of birth for the foreign-born population - Jamaica (%)
Place of birth for the foreign-born population - St. Vincent and the Grenadines (%)
Place of birth for the foreign-born population - Trinidad and Tobago (%)
Place of birth for the foreign-born population - West Indies (%)
Place of birth for the foreign-born population - Other Caribbean (%)
Place of birth for the foreign-born population - Belize (%)
Place of birth for the foreign-born population - Costa Rica (%)
Place of birth for the foreign-born population - El Salvador (%)
Place of birth for the foreign-born population - Guatemala (%)
Place of birth for the foreign-born population - Honduras (%)
Place of birth for the foreign-born population - Mexico (%)
Place of birth for the foreign-born population - Nicaragua (%)
Place of birth for the foreign-born population - Panama (%)
Place of birth for the foreign-born population - Other Central America (%)
Place of birth for the foreign-born population - Argentina (%)
Place of birth for the foreign-born population - Bolivia (%)
Place of birth for the foreign-born population - Brazil (%)
Place of birth for the foreign-born population - Chile (%)
Place of birth for the foreign-born population - Colombia (%)
Place of birth for the foreign-born population - Ecuador (%)
Place of birth for the foreign-born population - Guyana (%)
Place of birth for the foreign-born population - Peru (%)
Place of birth for the foreign-born population - Uruguay (%)
Place of birth for the foreign-born population - Venezuela (%)
Place of birth for the foreign-born population - Other South America (%)
Place of birth for the foreign-born population - Canada (%)
Place of birth for the foreign-born population - Other Northern America (%)
Place of birth for the foreign-born population - Other (%)
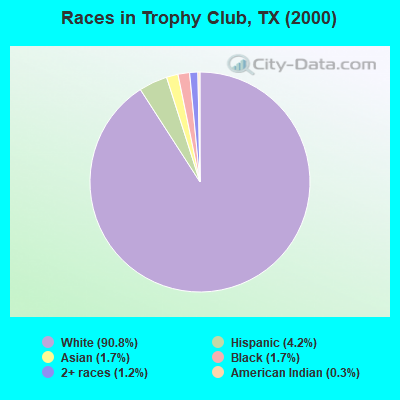
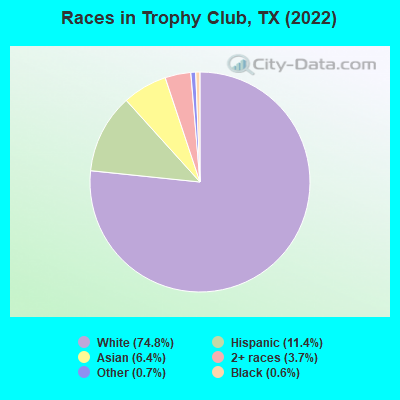
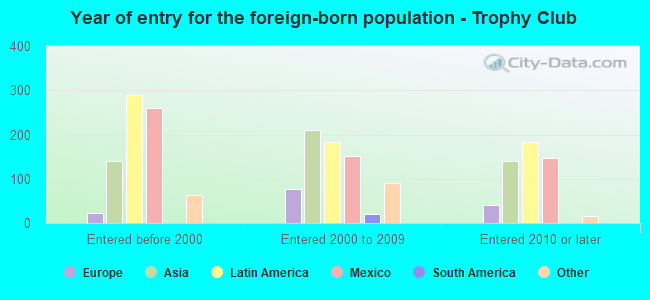
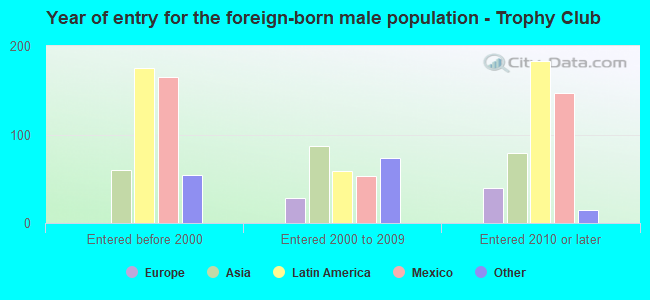
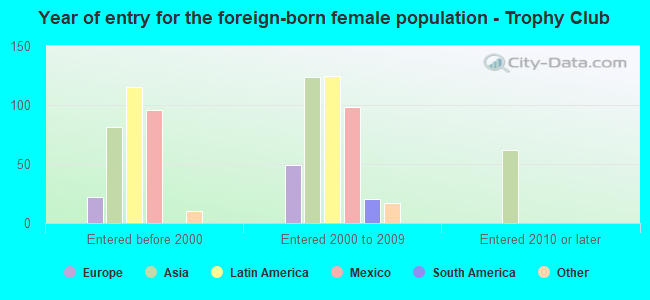
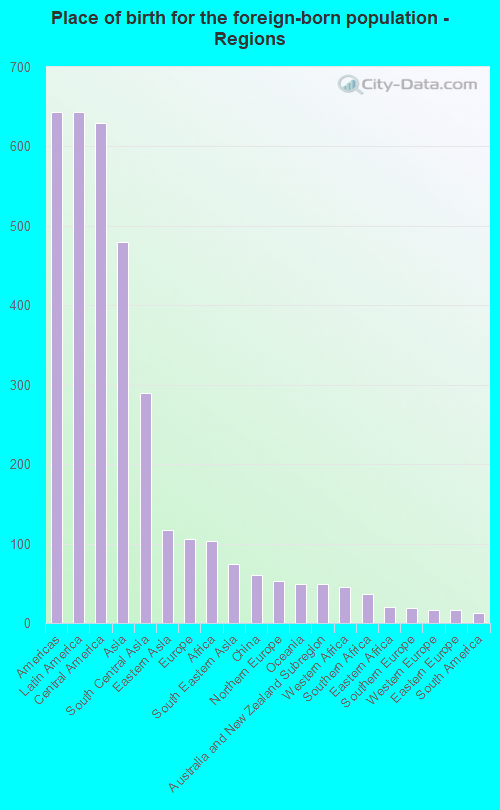
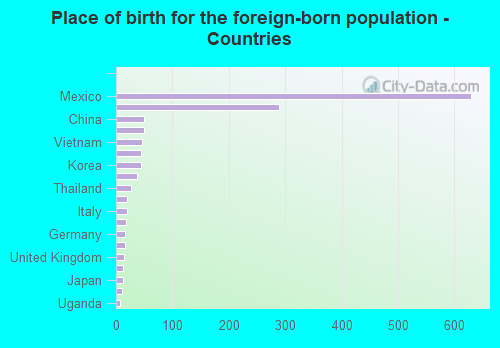
According to 2022 data, the most numerous races in Trophy Club, TX are Hispanic (1,612 residents), White alone (10,587 residents), and Black alone (84 residents). 89.9% of Trophy Club residents speak English at home. 9.8% of Trophy Club, TX residents are foreign-born (4.7% born in Latin America, 3.5% born in Asia), which is 73.9% less than the foreign-born rate of 17.0% across the entire state of Texas.
Race distribution in Trophy Club
2000 2022
10,933,313 52.4% White alone 6,669,666 32.0% Hispanic 2,364,255 11.3% Black alone 554,445 2.7% Asian alone 230,567 1.1% Two or more races 68,859 0.3% American Indian alone 19,958 0.10% Other race alone 10,757 0.05% Native Hawaiian and Other
12,070,642 40.2% Hispanic 11,683,430 38.9% White alone 3,508,706 11.7% Black alone 1,608,173 5.4% Asian alone 956,560 3.2% Two or more races 125,763 0.4% Other race alone 47,023 0.2% American Indian alone 29,275 0.10% Native Hawaiian and Other
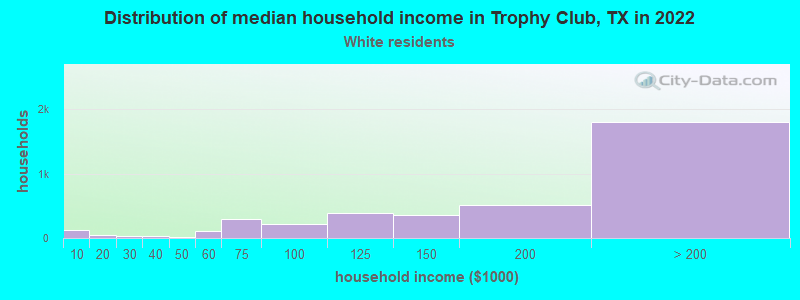
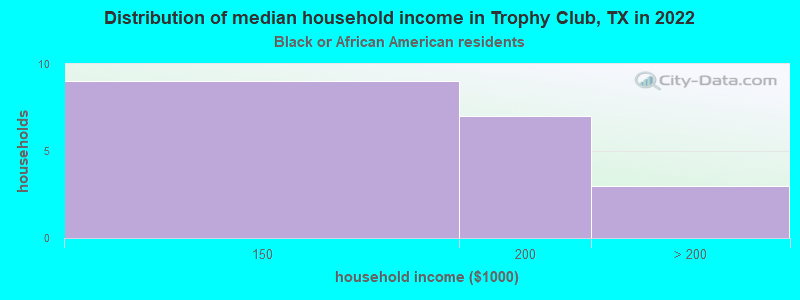
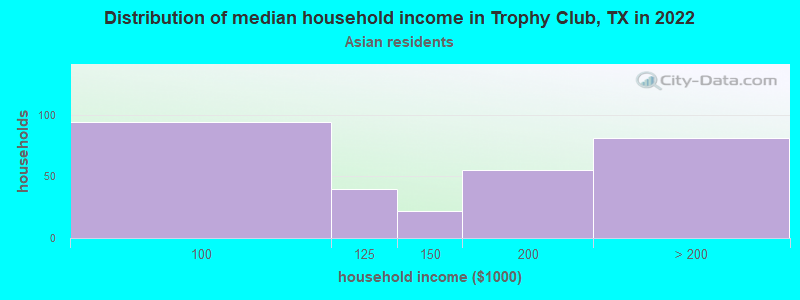
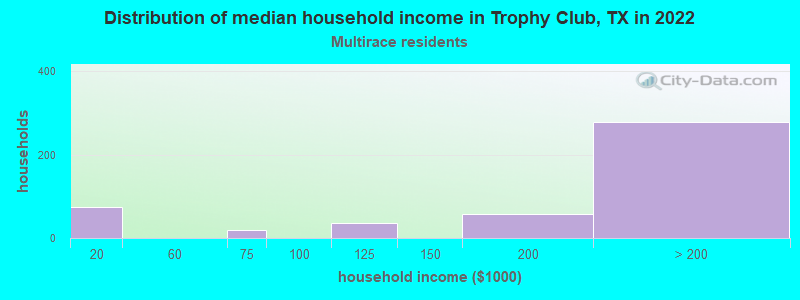
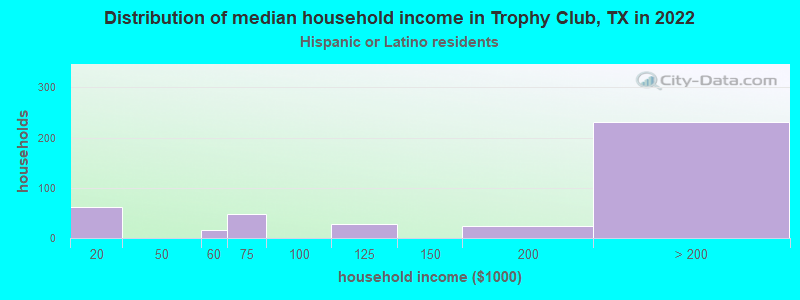
Income and house value in Trophy Club Median household income in 2022 $183,025 White non-Hispanic householders$152,224 Black householders$158,525 Asian householdersover $200,000 Two or more races householdersover $200,000 Hispanic or Latino race householdersMedian 2022 house value $673,618 White Non-Hispanic householders$610,747 Black or African American householders$421,011 American Indian or Alaska Native householders $610,373 Asian householders$608,128 Some other race householders$290,030 Two or more races householders$613,367 Hispanic or Latino householders
Median age by race in Trophy Club
44.8 Median age for White residents44.4 44.9 52.6 Median age for Black or African American residents28.2 54.9 -689,873,417.0 Median age for American Indian / Alaska Native residents-700,803,212.2 -734,693,876.8 40.4 Median age for Asian residents42.7 31.8 -305,343,511.1 Median age for Native Hawaiian / Pacific Islander residents-601,801,801.2 -656,771,799.0 29.5 Median age for Other race residents40.1 28.3 25.5 Median age for Two or more races residents26.9 24.9 44.4 Median age for White alone residents43.7 44.4 25.6 Median age for Hispanic or Latino residents30.9 23.4
Owner/renter occupied households by race in Trophy Club
House owners and renters - White residents 3,527 90.8% Owner occupied359 9.2% Renter occupiedHouse owners and renters - Black or African American residents 11 54.6% Owner occupied9 45.4% Renter occupiedHouse owners and renters - Asian residents 299 100.0% Owner occupiedHouse owners and renters - Other race residents 37 100.0% Owner occupiedHouse owners and renters - Two or more races residents 448 93.6% Owner occupied31 6.4% Renter occupiedHouse owners and renters - White alone residents 3,592 91.7% Owner occupied325 8.3% Renter occupiedHouse owners and renters - Hispanic or Latino residents 330 85.5% Owner occupied56 14.5% Renter occupied
Language usage in Trophy Club
English speakers - Total 89.9% of residents of Trophy Club speak English at home.
4.2% of residents speak Spanish at home 545 96.1% Speak English very well22 3.9% Speak English less than very well5.6% of residents speak other language at home 654 85.5% Speak English very well111 14.5% Speak English less than very well
English speakers - Born in the United States 98.0% of residents of Trophy Club speak English at home.
0.8% of residents speak Spanish at home 37 77.1% Speak English very well11 22.9% Speak English less than very well0.9% of residents speak other language at home 35 61.4% Speak English very well22 38.6% Speak English less than very well
English speakers - Native, born elsewhere 85.8% of residents of Trophy Club speak English at home.
16.5% of residents speak Spanish at home 52 80.0% Speak English very well13 20.0% Speak English less than very well1.0% of residents speak other language at home 4 100.0% Speak English very well
English speakers - Foreign-born 33.9% of residents of Trophy Club speak English at home.
26.1% of residents speak Spanish at home 385 100.0% Speak English very well38.0% of residents speak other language at home 490 87.3% Speak English very well71 12.7% Speak English less than very well
White (Caucasian) - Speak only English Native:
100.0% (9,680)Foreign-born:
100.0% (131)
White (Caucasian) - Speak another language Native:
1.3% (127)Foreign-born:
15.8% (21)
Black or African American - Speak only English Native:
100.0% (34)Foreign-born:
38.1% (21)
Asian - Speak another language Native:
25.1% (112)Foreign-born:
98.4% (466)
Two or more races - Speak only English Native:
95.4% (1,040)Foreign-born:
29.1% (303)
Two or more races - Speak another language Native:
6.3% (69)Foreign-born:
56.9% (591)
White alone - Speak only English Native:
98.6% (9,766)Foreign-born:
82.6% (159)
White alone - Speak another language Native:
1.4% (142)Foreign-born:
19.7% (38)
Hispanic or Latino - Speak only English Native:
90.0% (809)Foreign-born:
25.9% (172)
Hispanic or Latino - Speak another language Native:
12.8% (115)Foreign-born:
60.8% (404)
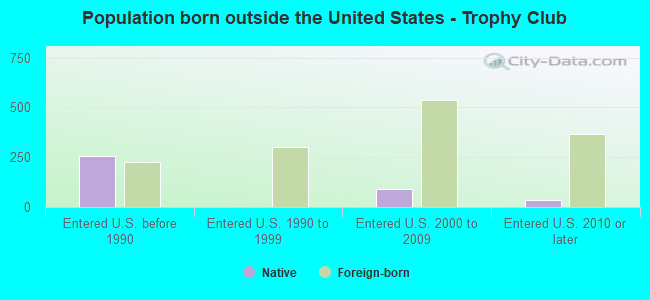
Foreign-born residents in Trophy Club 1,384 residents are foreign born (4.7% Latin America , 3.5% Asia ).
This city:
9.8%Texas:
17.1%
Marital status for residents in Trophy Club Marital status - White (Caucasian) population 15 years and over
Males 17.4% Never married72.0% Now married0.0% Separated2.9% Widowed7.7% DivorcedFemales 17.9% Never married68.4% Now married0.0% Separated4.0% Widowed9.7% DivorcedWomen who gave birth in the past 12 months Now married:
77.8% (69)Unmarried:
22.2% (20)
Women who did not give birth in the past 12 months Now married:
65.5% (1,273)Unmarried:
34.5% (670)
Marital status - Black or African American population 15 years and over
Males 73.0% Never married27.0% Now married0.0% Separated0.0% Widowed0.0% DivorcedFemales 0.0% Never married72.4% Now married0.0% Separated0.0% Widowed27.6% DivorcedMarital status - Asian population 15 years and over
Males 16.5% Never married83.5% Now married0.0% Separated0.0% Widowed0.0% DivorcedFemales 54.3% Never married41.1% Now married0.0% Separated1.5% Widowed3.1% DivorcedWomen who gave birth in the past 12 months Now married:
100.0% (17)Unmarried:
0.0% (0)
Women who did not give birth in the past 12 months Now married:
33.7% (147)Unmarried:
66.3% (290)
Marital status - Other race population 15 years and over
Males 8.5% Never married61.0% Now married0.0% Separated0.0% Widowed30.5% DivorcedFemales 76.8% Never married0.0% Now married0.0% Separated0.0% Widowed23.2% DivorcedWomen who did not give birth in the past 12 months Now married:
0.0% (0)Unmarried:
100.0% (128)
Marital status - Two or more races population 15 years and over
Males 26.6% Never married73.4% Now married0.0% Separated0.0% Widowed0.0% DivorcedFemales 38.0% Never married49.1% Now married0.0% Separated6.5% Widowed6.3% DivorcedWomen who did not give birth in the past 12 months Now married:
35.2% (169)Unmarried:
64.8% (312)
Marital status - White alone, not Hispanic / Latino population 15 years and over
Males 17.9% Never married71.2% Now married0.0% Separated3.0% Widowed8.0% DivorcedFemales 17.8% Never married68.3% Now married0.0% Separated4.0% Widowed9.9% DivorcedWomen who gave birth in the past 12 months Now married:
75.6% (67)Unmarried:
24.4% (22)
Women who did not give birth in the past 12 months Now married:
65.8% (1,377)Unmarried:
34.2% (715)
Marital status - Hispanic or Latino population 15 years and over
Males 15.9% Never married84.1% Now married0.0% Separated0.0% Widowed0.0% DivorcedFemales 46.5% Never married41.9% Now married0.0% Separated5.0% Widowed6.6% DivorcedWomen who gave birth in the past 12 months Now married:
100.0% (10)Unmarried:
0.0% (0)
Women who did not give birth in the past 12 months Now married:
23.0% (73)Unmarried:
77.0% (243)
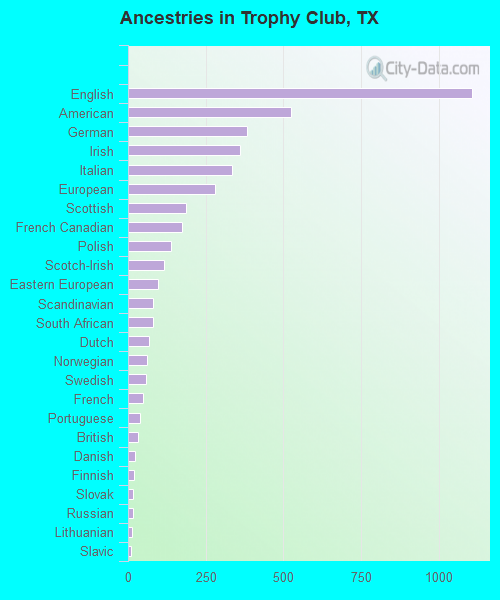
Ancestries in Trophy Club
1,106 19.3% English525 9.2% American382 6.7% German361 6.3% Irish333 5.8% Italian281 4.9% European187 3.3% Scottish174 3.0% French Canadian139 2.4% Polish116 2.0% Scotch-Irish95 1.7% Eastern European82 1.4% Scandinavian80 1.4% South African68 1.2% Dutch62 1.1% Norwegian59 1.0% Swedish49 0.9% French39 0.7% Portuguese31 0.5% British24 0.4% Danish20 0.3% Finnish16 0.3% Slovak15 0.3% Russian13 0.2% Lithuanian11 0.2% Slavic3 0.05% Northern European
Children Nativity (place of birth) in Trophy Club
Children under 6 years - Living with two parents Both parents native 603 100.0% NativeBoth parents foreign-born 24 100.0% NativeOne native, one foreign-born parent 49 100.0% NativeChildren under 6 years - Living with one parent Native parent 105 100.0% NativeChildren 6 to 17 years - Living with two parents Both parents native 2,261 100.0% NativeBoth parents foreign-born 79 100.0% NativeOne native, one foreign-born parent 57 100.0% NativeChildren 6 to 17 years - Living with one parent Native parent 199 93.3% Native14 6.7% Foreign-bornForeign-born parent 10 100.0% Native
Grandparents responsible for own grandchildren in Trophy Club
Grandparents (30 to 59 years) White / Caucasian 17 34.5% Responsible for grandchildren33 65.5% Not responsible for grandchildrenWhite alone, not Hispanic / Latino 19 32.2% Responsible for grandchildren39 67.8% Not responsible for grandchildren
Grandparents (60 years and over) White / Caucasian 5 100.0% Responsible for grandchildrenWhite alone, not Hispanic / Latino 5 100.0% Responsible for grandchildren