Races in Troutdale, Oregon (OR) Detailed Stats
Data:
Races - White alone (%)
Races - White alone (% change since 2000)
Races - Black alone (%)
Races - Black alone (% change since 2000)
Races - American Indian alone (%)
Races - American Indian alone (% change since 2000)
Races - Asian alone (%)
Races - Asian alone (% change since 2000)
Races - Hispanic (%)
Races - Hispanic (% change since 2000)
Races - Native Hawaiian and Other Pacific Islander alone (%)
Races - Native Hawaiian and Other Pacific Islander alone (% change since 2000)
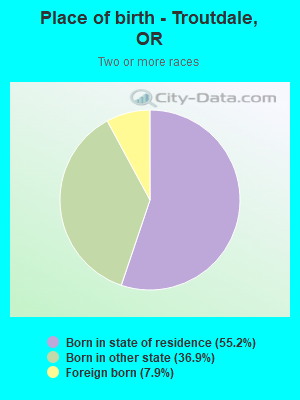
Races - Two or more races(%)
Races - Two or more races(% change since 2000)
Races - Other race alone (%)
Races - Other race alone (% change since 2000)
Racial diversity
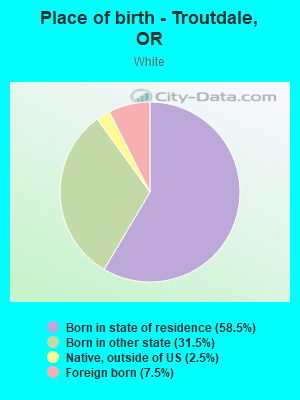
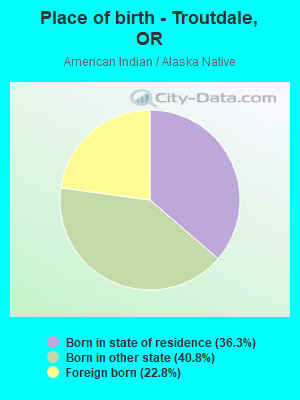
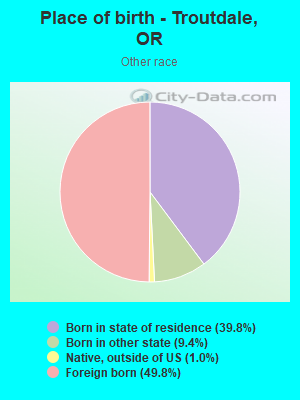
Place of birth - Born in state of residence (%)
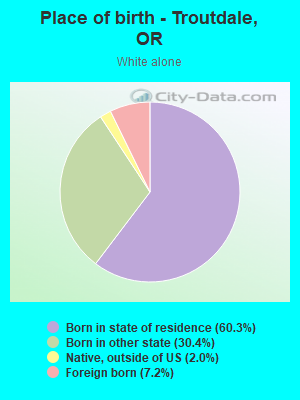
Place of birth - Born in state of residence (%) - White
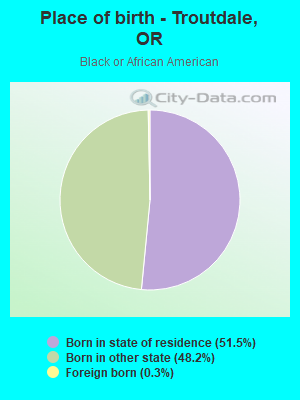
Place of birth - Born in state of residence (%) - Black or African American
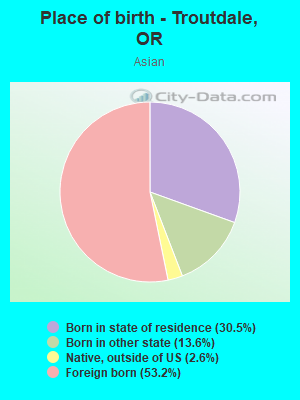
Place of birth - Born in state of residence (%) - Asian
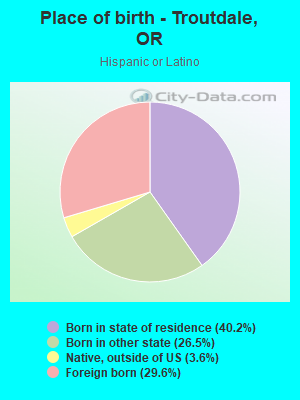
Place of birth - Born in state of residence (%) - Hispanic or Latino
Place of birth - Born in state of residence (%) - American Indian and Alaska Native
Place of birth - Born in state of residence (%) - Multirace
Place of birth - Born in state of residence (%) - Other Race
Place of birth - Born in other state (%)
Place of birth - Born in other state (%) - White
Place of birth - Born in other state (%) - Black or African American
Place of birth - Born in other state (%) - Asian
Place of birth - Born in other state (%) - Hispanic or Latino
Place of birth - Born in other state (%) - American Indian and Alaska Native
Place of birth - Born in other state (%) - Multirace
Place of birth - Born in other state (%) - Other Race
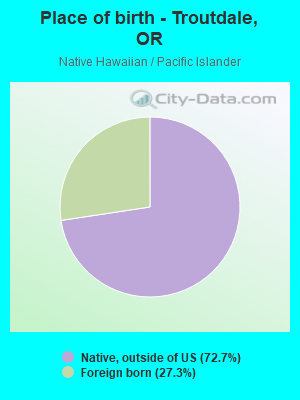
Place of birth - Native, outside of US (%)
Place of birth - Native, outside of US (%) - White
Place of birth - Native, outside of US (%) - Black or African American
Place of birth - Native, outside of US (%) - Asian
Place of birth - Native, outside of US (%) - Hispanic or Latino
Place of birth - Native, outside of US (%) - American Indian and Alaska Native
Place of birth - Native, outside of US (%) - Multirace
Place of birth - Native, outside of US (%) - Other Race
Place of birth - Foreign born (%)
Place of birth - Foreign born (%) - White
Place of birth - Foreign born (%) - Black or African American
Place of birth - Foreign born (%) - Asian
Place of birth - Foreign born (%) - Hispanic or Latino
Place of birth - Foreign born (%) - American Indian and Alaska Native
Place of birth - Foreign born (%) - Multirace
Place of birth - Foreign born (%) - Other Race
Residents speaking English at home (%)
Residents speaking English at home - Born in the United States (%)
Residents speaking English at home - Native, born elsewhere (%)
Residents speaking English at home - Foreign born (%)
Residents speaking Spanish at home (%)
Residents speaking Spanish at home - Born in the United States (%)
Residents speaking Spanish at home - Native, born elsewhere (%)
Residents speaking Spanish at home - Foreign born (%)
Residents speaking other language at home (%)
Residents speaking other language at home - Born in the United States (%)
Residents speaking other language at home - Native, born elsewhere (%)
Residents speaking other language at home - Foreign born (%)
Marital status - Never married (%)
Marital status - Now married (%)
Marital status - Separated (%)
Marital status - Widowed (%)
Marital status - Divorced (%)
Ancestries Reported - Arab (%)
Ancestries Reported - Czech (%)
Ancestries Reported - Danish (%)
Ancestries Reported - Dutch (%)
Ancestries Reported - English (%)
Ancestries Reported - French (%)
Ancestries Reported - French Canadian (%)
Ancestries Reported - German (%)
Ancestries Reported - Greek (%)
Ancestries Reported - Hungarian (%)
Ancestries Reported - Irish (%)
Ancestries Reported - Italian (%)
Ancestries Reported - Lithuanian (%)
Ancestries Reported - Norwegian (%)
Ancestries Reported - Polish (%)
Ancestries Reported - Portuguese (%)
Ancestries Reported - Russian (%)
Ancestries Reported - Scotch-Irish (%)
Ancestries Reported - Scottish (%)
Ancestries Reported - Slovak (%)
Ancestries Reported - Subsaharan African (%)
Ancestries Reported - Swedish (%)
Ancestries Reported - Swiss (%)
Ancestries Reported - Ukrainian (%)
Ancestries Reported - United States (%)
Ancestries Reported - Welsh (%)
Ancestries Reported - West Indian (%)
Ancestries Reported - Other (%)
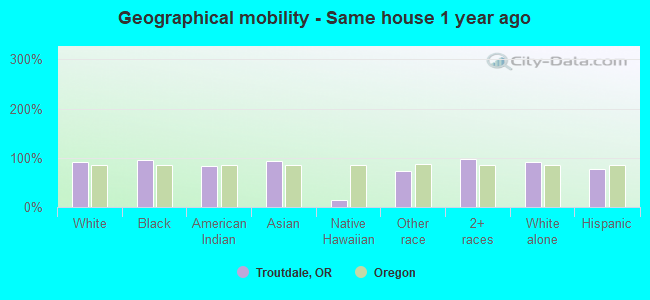
Geographical mobility - Same house 1 year ago (%)
Geographical mobility - Same house 1 year ago (%) - White
Geographical mobility - Same house 1 year ago (%) - Black or African American
Geographical mobility - Same house 1 year ago (%) - Asian
Geographical mobility - Same house 1 year ago (%) - Hispanic or Latino
Geographical mobility - Same house 1 year ago (%) - American Indian and Alaska Native
Geographical mobility - Same house 1 year ago (%) - Multirace
Geographical mobility - Same house 1 year ago (%) - Other Race
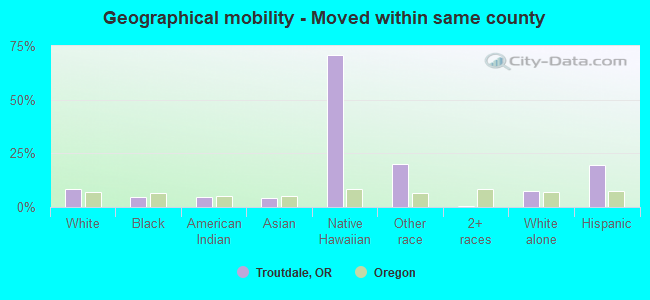
Geographical mobility - Moved within same county (%)
Geographical mobility - Moved within same county (%) - White
Geographical mobility - Moved within same county (%) - Black or African American
Geographical mobility - Moved within same county (%) - Asian
Geographical mobility - Moved within same county (%) - Hispanic or Latino
Geographical mobility - Moved within same county (%) - American Indian and Alaska Native
Geographical mobility - Moved within same county (%) - Multirace
Geographical mobility - Moved within same county (%) - Other Race
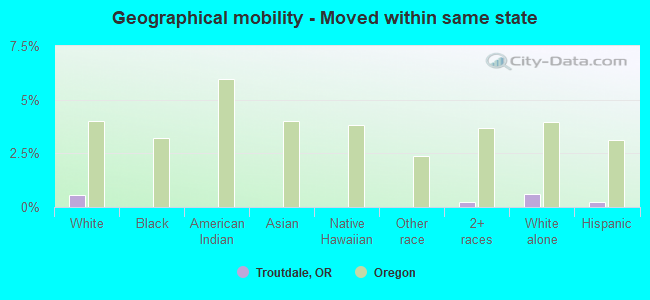
Geographical mobility - Moved from different county within same state (%)
Geographical mobility - Moved from different county within same state (%) - White
Geographical mobility - Moved from different county within same state (%) - Black or African American
Geographical mobility - Moved from different county within same state (%) - Asian
Geographical mobility - Moved from different county within same state (%) - Hispanic or Latino
Geographical mobility - Moved from different county within same state (%) - American Indian and Alaska Native
Geographical mobility - Moved from different county within same state (%) - Multirace
Geographical mobility - Moved from different county within same state (%) - Other Race
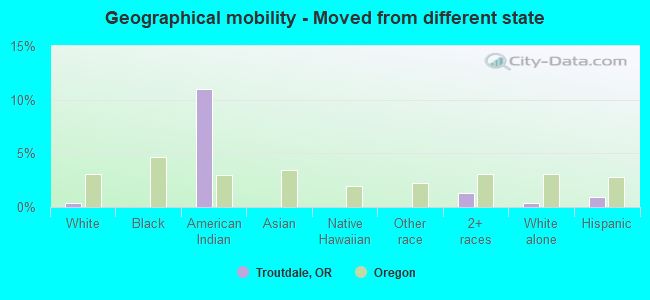
Geographical mobility - Moved from different state (%)
Geographical mobility - Moved from different state (%) - White
Geographical mobility - Moved from different state (%) - Black or African American
Geographical mobility - Moved from different state (%) - Asian
Geographical mobility - Moved from different state (%) - Hispanic or Latino
Geographical mobility - Moved from different state (%) - American Indian and Alaska Native
Geographical mobility - Moved from different state (%) - Multirace
Geographical mobility - Moved from different state (%) - Other Race
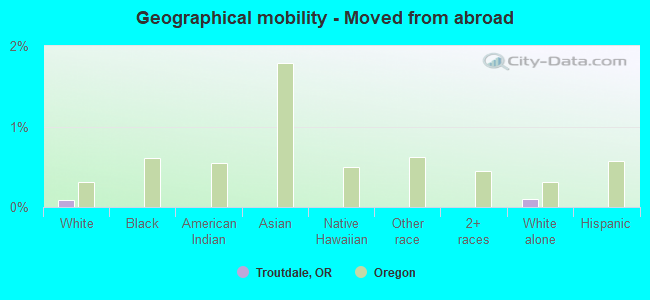
Geographical mobility - Moved from abroad (%)
Geographical mobility - Moved from abroad (%) - White
Geographical mobility - Moved from abroad (%) - Black or African American
Geographical mobility - Moved from abroad (%) - Asian
Geographical mobility - Moved from abroad (%) - Hispanic or Latino
Geographical mobility - Moved from abroad (%) - American Indian and Alaska Native
Geographical mobility - Moved from abroad (%) - Multirace
Geographical mobility - Moved from abroad (%) - Other Race
Place of birth for the foreign-born population - Ireland (%)
Place of birth for the foreign-born population - Denmark (%)
Place of birth for the foreign-born population - Norway (%)
Place of birth for the foreign-born population - Sweden (%)
Place of birth for the foreign-born population - United Kingdom (%)
Place of birth for the foreign-born population - England (%)
Place of birth for the foreign-born population - Scotland (%)
Place of birth for the foreign-born population - Other Northern Europe (%)
Place of birth for the foreign-born population - Austria (%)
Place of birth for the foreign-born population - Belgium (%)
Place of birth for the foreign-born population - France (%)
Place of birth for the foreign-born population - Germany (%)
Place of birth for the foreign-born population - Netherlands (%)
Place of birth for the foreign-born population - Switzerland (%)
Place of birth for the foreign-born population - Other Western Europe (%)
Place of birth for the foreign-born population - Greece (%)
Place of birth for the foreign-born population - Italy (%)
Place of birth for the foreign-born population - Portugal (%)
Place of birth for the foreign-born population - Spain (%)
Place of birth for the foreign-born population - Other Southern Europe (%)
Place of birth for the foreign-born population - Albania (%)
Place of birth for the foreign-born population - Belarus (%)
Place of birth for the foreign-born population - Bosnia and Herzegovina (%)
Place of birth for the foreign-born population - Bulgaria (%)
Place of birth for the foreign-born population - Croatia (%)
Place of birth for the foreign-born population - Czechoslovakia (%)
Place of birth for the foreign-born population - Hungary (%)
Place of birth for the foreign-born population - Latvia (%)
Place of birth for the foreign-born population - Lithuania (%)
Place of birth for the foreign-born population - North Macedonia (Macedonia) (%)
Place of birth for the foreign-born population - Moldova (%)
Place of birth for the foreign-born population - Poland (%)
Place of birth for the foreign-born population - Romania (%)
Place of birth for the foreign-born population - Russia (%)
Place of birth for the foreign-born population - Serbia (%)
Place of birth for the foreign-born population - Ukraine (%)
Place of birth for the foreign-born population - Other Eastern Europe (%)
Place of birth for the foreign-born population - China (%)
Place of birth for the foreign-born population - Hong Kong (%)
Place of birth for the foreign-born population - Taiwan (%)
Place of birth for the foreign-born population - Japan (%)
Place of birth for the foreign-born population - Korea (%)
Place of birth for the foreign-born population - Other Eastern Asia (%)
Place of birth for the foreign-born population - Afghanistan (%)
Place of birth for the foreign-born population - Bangladesh (%)
Place of birth for the foreign-born population - India (%)
Place of birth for the foreign-born population - Iran (%)
Place of birth for the foreign-born population - Kazakhstan (%)
Place of birth for the foreign-born population - Nepal (%)
Place of birth for the foreign-born population - Pakistan (%)
Place of birth for the foreign-born population - Sri Lanka (%)
Place of birth for the foreign-born population - Uzbekistan (%)
Place of birth for the foreign-born population - Other South Central Asia (%)
Place of birth for the foreign-born population - Burma (%)
Place of birth for the foreign-born population - Cambodia (%)
Place of birth for the foreign-born population - Indonesia (%)
Place of birth for the foreign-born population - Laos (%)
Place of birth for the foreign-born population - Malaysia (%)
Place of birth for the foreign-born population - Philippines (%)
Place of birth for the foreign-born population - Singapore (%)
Place of birth for the foreign-born population - Thailand (%)
Place of birth for the foreign-born population - Vietnam (%)
Place of birth for the foreign-born population - Other South Eastern Asia (%)
Place of birth for the foreign-born population - Armenia (%)
Place of birth for the foreign-born population - Iraq (%)
Place of birth for the foreign-born population - Israel (%)
Place of birth for the foreign-born population - Jordan (%)
Place of birth for the foreign-born population - Kuwait (%)
Place of birth for the foreign-born population - Lebanon (%)
Place of birth for the foreign-born population - Saudi Arabia (%)
Place of birth for the foreign-born population - Syria (%)
Place of birth for the foreign-born population - Turkey (%)
Place of birth for the foreign-born population - Yemen (%)
Place of birth for the foreign-born population - Other Western Asia (%)
Place of birth for the foreign-born population - Eritrea (%)
Place of birth for the foreign-born population - Ethiopia (%)
Place of birth for the foreign-born population - Kenya (%)
Place of birth for the foreign-born population - Somalia (%)
Place of birth for the foreign-born population - Uganda (%)
Place of birth for the foreign-born population - Zimbabwe (%)
Place of birth for the foreign-born population - Other Eastern Africa (%)
Place of birth for the foreign-born population - Cameroon (%)
Place of birth for the foreign-born population - Congo (%)
Place of birth for the foreign-born population - Democratic Republic of Congo (Zaire) (%)
Place of birth for the foreign-born population - Other Middle Africa (%)
Place of birth for the foreign-born population - Egypt (%)
Place of birth for the foreign-born population - Morocco (%)
Place of birth for the foreign-born population - Sudan (%)
Place of birth for the foreign-born population - Other Northern Africa (%)
Place of birth for the foreign-born population - South Africa (%)
Place of birth for the foreign-born population - Other Southern Africa (%)
Place of birth for the foreign-born population - Cabo Verde (%)
Place of birth for the foreign-born population - Ghana (%)
Place of birth for the foreign-born population - Liberia (%)
Place of birth for the foreign-born population - Nigeria (%)
Place of birth for the foreign-born population - Senegal (%)
Place of birth for the foreign-born population - Sierra Leone (%)
Place of birth for the foreign-born population - Other Western Africa (%)
Place of birth for the foreign-born population - Australia (%)
Place of birth for the foreign-born population - New Zealand (%)
Place of birth for the foreign-born population - Fiji (%)
Place of birth for the foreign-born population - Micronesia (%)
Place of birth for the foreign-born population - Bahamas (%)
Place of birth for the foreign-born population - Barbados (%)
Place of birth for the foreign-born population - Cuba (%)
Place of birth for the foreign-born population - Dominica (%)
Place of birth for the foreign-born population - Dominican Republic (%)
Place of birth for the foreign-born population - Grenada (%)
Place of birth for the foreign-born population - Haiti (%)
Place of birth for the foreign-born population - Jamaica (%)
Place of birth for the foreign-born population - St. Vincent and the Grenadines (%)
Place of birth for the foreign-born population - Trinidad and Tobago (%)
Place of birth for the foreign-born population - West Indies (%)
Place of birth for the foreign-born population - Other Caribbean (%)
Place of birth for the foreign-born population - Belize (%)
Place of birth for the foreign-born population - Costa Rica (%)
Place of birth for the foreign-born population - El Salvador (%)
Place of birth for the foreign-born population - Guatemala (%)
Place of birth for the foreign-born population - Honduras (%)
Place of birth for the foreign-born population - Mexico (%)
Place of birth for the foreign-born population - Nicaragua (%)
Place of birth for the foreign-born population - Panama (%)
Place of birth for the foreign-born population - Other Central America (%)
Place of birth for the foreign-born population - Argentina (%)
Place of birth for the foreign-born population - Bolivia (%)
Place of birth for the foreign-born population - Brazil (%)
Place of birth for the foreign-born population - Chile (%)
Place of birth for the foreign-born population - Colombia (%)
Place of birth for the foreign-born population - Ecuador (%)
Place of birth for the foreign-born population - Guyana (%)
Place of birth for the foreign-born population - Peru (%)
Place of birth for the foreign-born population - Uruguay (%)
Place of birth for the foreign-born population - Venezuela (%)
Place of birth for the foreign-born population - Other South America (%)
Place of birth for the foreign-born population - Canada (%)
Place of birth for the foreign-born population - Other Northern America (%)
Place of birth for the foreign-born population - Other (%)
Latest news about races in Troutdale, OR collected exclusively by city-data.com from local newspapers, TV, and radio stations
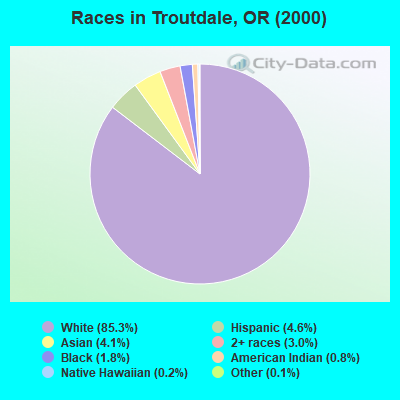
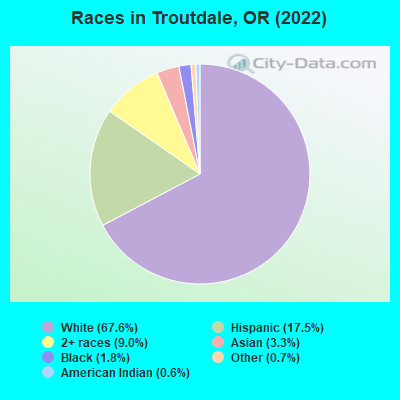
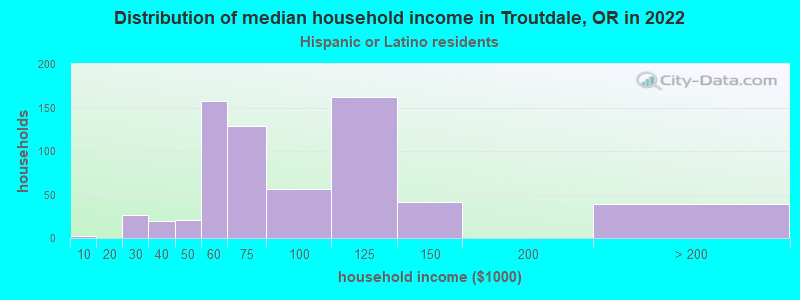
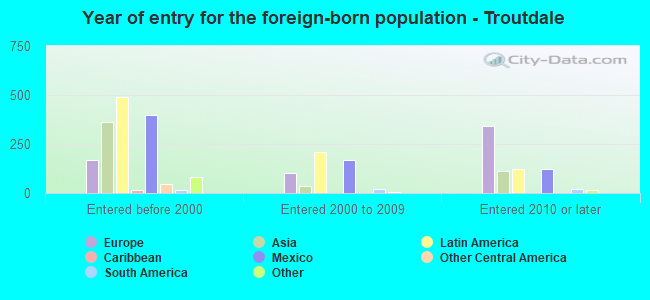
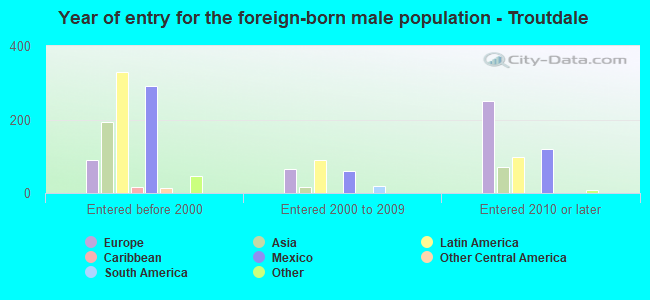
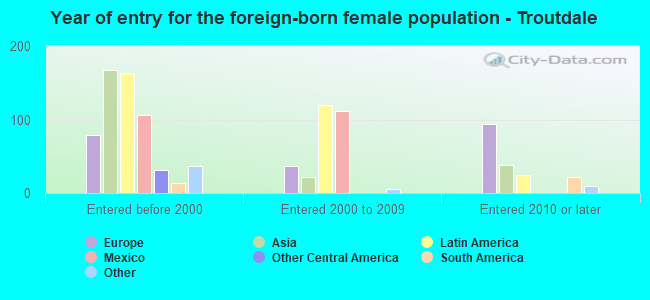
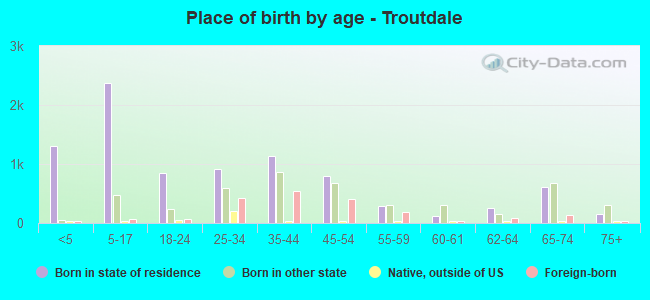
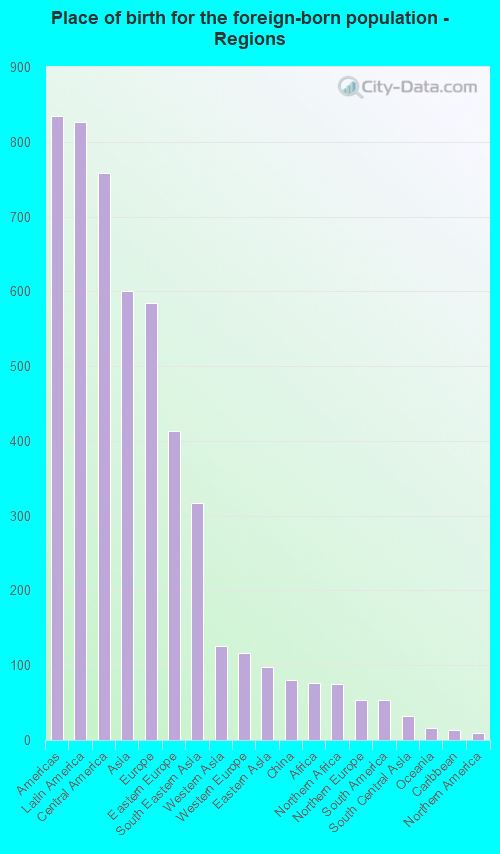
According to 2022 data, the most numerous races in Troutdale, OR are White alone (10,745 residents), Hispanic (2,777 residents), and Two or more races (1,431 residents). 78.4% of Troutdale residents speak English at home. 13.3% of Troutdale, OR residents are foreign-born (5.0% born in Latin America, 3.7% born in Asia, 3.5% born in Europe), which is 32.4% greater than the foreign-born rate of 9.0% across the entire state of Oregon.
Race distribution in Troutdale
2000 2022
2,857,616 83.5% White alone 275,314 8.0% Hispanic 100,333 2.9% Asian alone 82,733 2.4% Two or more races 53,325 1.6% Black alone 40,130 1.2% American Indian alone 7,398 0.2% Native Hawaiian and Other 4,550 0.1% Other race alone
3,037,571 71.6% White alone 609,538 14.4% Hispanic 252,744 6.0% Two or more races 191,283 4.5% Asian alone 78,228 1.8% Black alone 29,399 0.7% American Indian alone 25,731 0.6% Other race alone 15,643 0.4% Native Hawaiian and Other
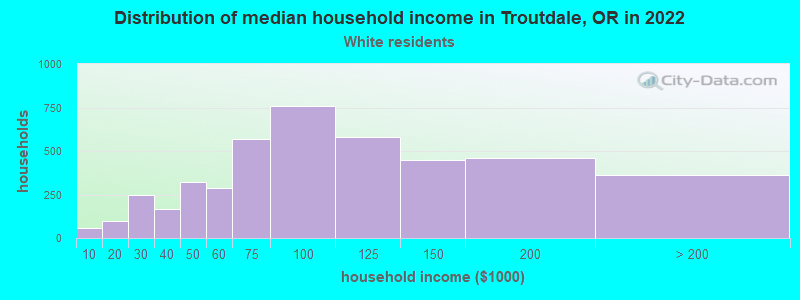
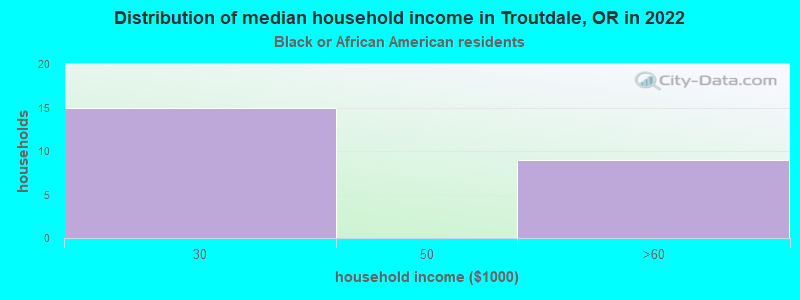
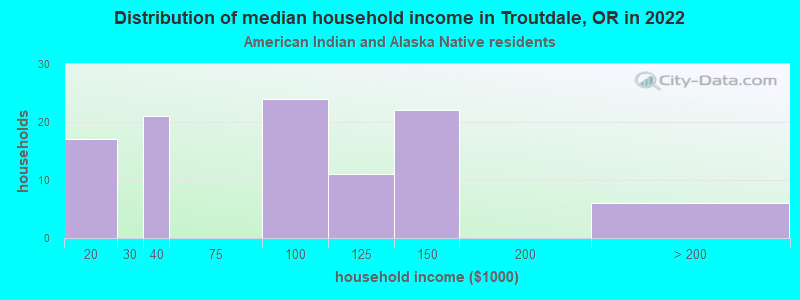
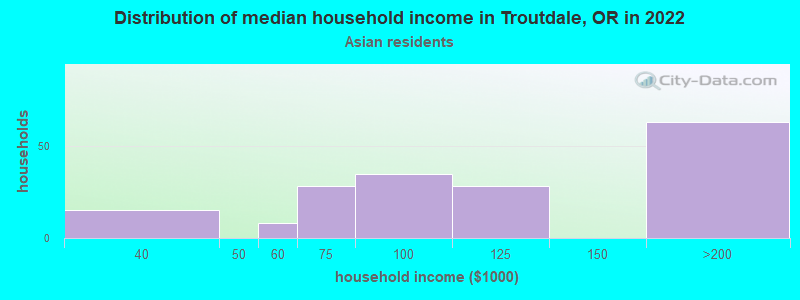
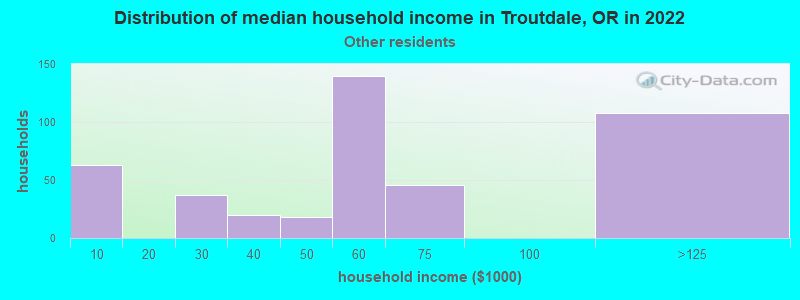
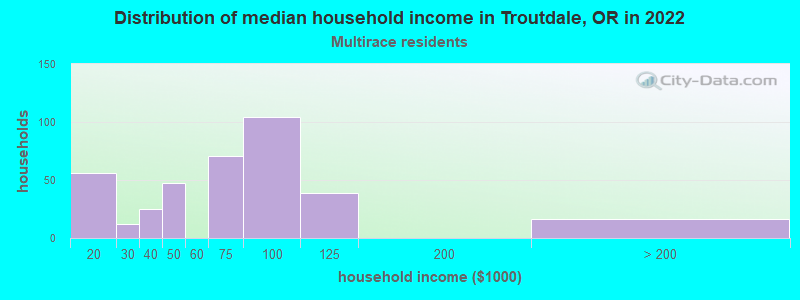
Income and house value in Troutdale Median household income in 2022 $89,178 White non-Hispanic householders$67,172 American Indian and Alaska Native householders$95,805 Asian householders$46,535 Some other race householders$73,584 Two or more races householders$73,006 Hispanic or Latino race householdersMedian 2022 house value $448,145 White Non-Hispanic householders$304,814 Black or African American householders$588,496 American Indian or Alaska Native householders $474,156 Asian householders$497,457 Native Hawaiian and other Pacific Islander householders$486,891 Some other race householders$410,755 Two or more races householders$462,776 Hispanic or Latino householders
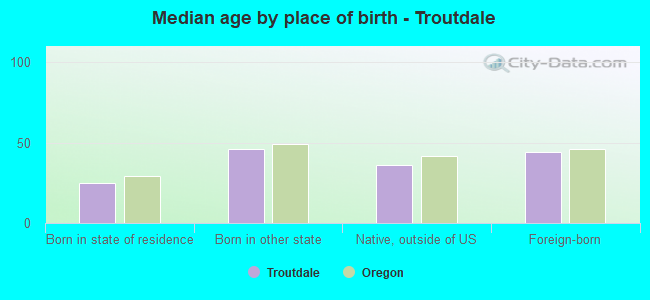
Median age by race in Troutdale
39.9 Median age for White residents39.6 40.4 24.3 Median age for Black or African American residents-689,161,553.5 21.8 56.8 Median age for American Indian / Alaska Native residents57.9 40.0 42.5 Median age for Asian residents35.0 44.1 13.1 Median age for Native Hawaiian / Pacific Islander residents-677,852,348.3 -573,295,984.5 28.3 Median age for Other race residents27.5 32.7 18.0 Median age for Two or more races residents12.2 31.1 41.6 Median age for White alone residents41.6 41.6 23.2 Median age for Hispanic or Latino residents23.1 24.7
Owner/renter occupied households by race in Troutdale
House owners and renters - White residents 3,187 71.8% Owner occupied1,249 28.2% Renter occupiedHouse owners and renters - Black or African American residents 38 100.0% Renter occupiedHouse owners and renters - American Indian / Alaska Native residents 65 55.3% Owner occupied53 44.7% Renter occupiedHouse owners and renters - Asian residents 132 70.8% Owner occupied54 29.2% Renter occupiedHouse owners and renters - Other race residents 212 59.6% Owner occupied143 40.4% Renter occupiedHouse owners and renters - Two or more races residents 146 38.8% Owner occupied231 61.2% Renter occupiedHouse owners and renters - White alone residents 3,066 73.5% Owner occupied1,107 26.5% Renter occupiedHouse owners and renters - Hispanic or Latino residents 316 47.8% Owner occupied346 52.2% Renter occupied
Language usage in Troutdale
English speakers - Total 78.4% of residents of Troutdale speak English at home.
12.1% of residents speak Spanish at home 1,141 65.3% Speak English very well606 34.7% Speak English less than very well9.7% of residents speak other language at home 606 42.9% Speak English very well805 57.1% Speak English less than very well
English speakers - Born in the United States 87.3% of residents of Troutdale speak English at home.
9.8% of residents speak Spanish at home 459 100.0% Speak English very well2.5% of residents speak other language at home 81 69.2% Speak English very well36 30.8% Speak English less than very well
English speakers - Native, born elsewhere 77.7% of residents of Troutdale speak English at home.
8.4% of residents speak Spanish at home 23 76.7% Speak English very well7 23.3% Speak English less than very well5.6% of residents speak other language at home 20 100.0% Speak English very well
English speakers - Foreign-born 18.0% of residents of Troutdale speak English at home.
38.7% of residents speak Spanish at home 229 30.0% Speak English very well535 70.0% Speak English less than very well45.6% of residents speak other language at home 219 24.4% Speak English very well680 75.6% Speak English less than very well
White (Caucasian) - Speak only English Native:
91.0% (8,978)Foreign-born:
15.7% (137)
White (Caucasian) - Speak another language Native:
7.9% (782)Foreign-born:
78.2% (678)
American Indian / Alaska Native - Speak only English Native:
77.8% (129)Foreign-born:
15.1% (7)
American Indian / Alaska Native - Speak another language Native:
18.4% (30)Foreign-born:
83.1% (39)
Asian - Speak only English Native:
25.1% (60)Foreign-born:
22.9% (64)
Asian - Speak another language Native:
73.1% (175)Foreign-born:
77.5% (215)
Native Hawaiian / Pacific Islander - Speak only English Native:
100.0% (19)Foreign-born:
100.0% (4)
Other race - Speak only English Native:
38.9% (208)Foreign-born:
10.2% (64)
Other race - Speak another language Native:
60.6% (324)Foreign-born:
89.1% (561)
Two or more races - Speak only English Native:
94.8% (1,355)Foreign-born:
82.9% (122)
Two or more races - Speak another language Native:
3.4% (49)Foreign-born:
17.2% (25)
White alone - Speak only English Native:
96.9% (8,785)Foreign-born:
18.1% (140)
White alone - Speak another language Native:
3.1% (283)Foreign-born:
81.0% (624)
Hispanic or Latino - Speak another language Native:
60.9% (1,047)Foreign-born:
95.8% (790)
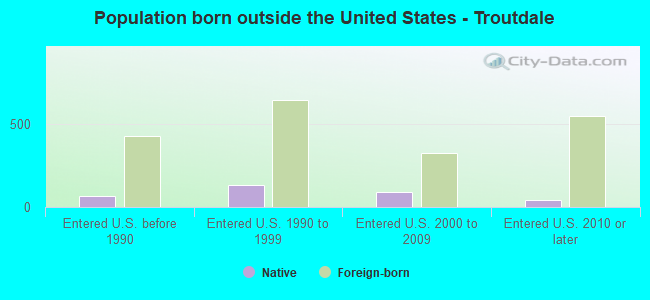
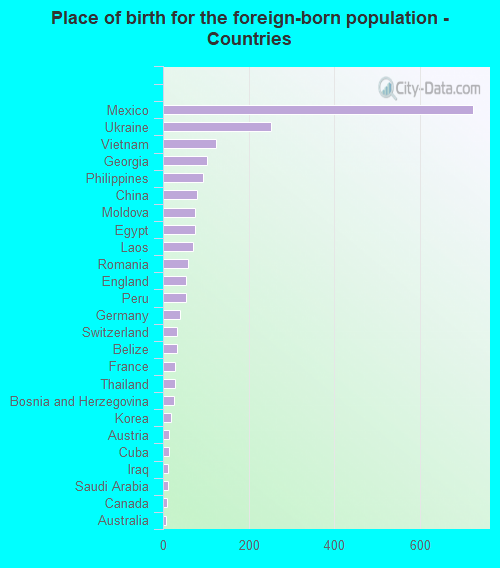
Foreign-born residents in Troutdale 2,114 residents are foreign born (5.0% Latin America , 3.7% Asia , 3.5% Europe ).
This city:
13.3%Oregon:
9.8%
Marital status for residents in Troutdale Marital status - White (Caucasian) population 15 years and over
Males 28.5% Never married58.2% Now married1.4% Separated1.0% Widowed10.9% DivorcedFemales 26.6% Never married55.3% Now married0.9% Separated6.7% Widowed10.5% DivorcedWomen who gave birth in the past 12 months Now married:
100.0% (39)Unmarried:
0.0% (0)
Women who did not give birth in the past 12 months Now married:
52.1% (1,405)Unmarried:
47.9% (1,293)
Marital status - Black or African American population 15 years and over
Males 78.8% Never married0.0% Now married0.0% Separated0.0% Widowed21.2% DivorcedFemales 94.4% Never married5.6% Now married0.0% Separated0.0% Widowed0.0% DivorcedWomen who did not give birth in the past 12 months Now married:
0.6% (1)Unmarried:
99.4% (176)
Marital status - American Indian / Alaska Native population 15 years and over
Males 21.3% Never married29.2% Now married0.0% Separated0.0% Widowed49.4% DivorcedFemales 15.8% Never married60.5% Now married0.0% Separated0.0% Widowed23.7% DivorcedWomen who gave birth in the past 12 months Now married:
100.0% (11)Unmarried:
0.0% (0)
Women who did not give birth in the past 12 months Now married:
66.7% (26)Unmarried:
33.3% (13)
Marital status - Asian population 15 years and over
Males 47.1% Never married36.2% Now married0.0% Separated0.0% Widowed16.7% DivorcedFemales 45.9% Never married45.9% Now married0.0% Separated8.2% Widowed0.0% DivorcedWomen who did not give birth in the past 12 months Now married:
48.8% (57)Unmarried:
51.2% (60)
Marital status - Other race population 15 years and over
Males 62.9% Never married24.2% Now married0.0% Separated0.0% Widowed12.9% DivorcedFemales 60.0% Never married33.6% Now married6.4% Separated0.0% Widowed0.0% DivorcedWomen who gave birth in the past 12 months Now married:
0.0% (0)Unmarried:
100.0% (38)
Women who did not give birth in the past 12 months Now married:
52.7% (136)Unmarried:
47.3% (122)
Marital status - Two or more races population 15 years and over
Males 46.2% Never married42.3% Now married2.1% Separated2.3% Widowed7.0% DivorcedFemales 39.3% Never married57.9% Now married0.0% Separated0.0% Widowed2.7% DivorcedWomen who did not give birth in the past 12 months Now married:
53.1% (214)Unmarried:
46.9% (189)
Marital status - White alone, not Hispanic / Latino population 15 years and over
Males 26.6% Never married58.8% Now married1.5% Separated1.1% Widowed12.1% DivorcedFemales 20.8% Never married59.2% Now married1.1% Separated7.9% Widowed11.1% DivorcedWomen who gave birth in the past 12 months Now married:
100.0% (25)Unmarried:
0.0% (0)
Women who did not give birth in the past 12 months Now married:
59.0% (1,280)Unmarried:
41.0% (891)
Marital status - Hispanic or Latino population 15 years and over
Males 52.8% Never married38.1% Now married0.0% Separated0.0% Widowed9.0% DivorcedFemales 56.4% Never married36.0% Now married1.8% Separated0.0% Widowed5.8% DivorcedWomen who gave birth in the past 12 months Now married:
37.2% (17)Unmarried:
62.8% (29)
Women who did not give birth in the past 12 months Now married:
36.5% (325)Unmarried:
63.5% (566)
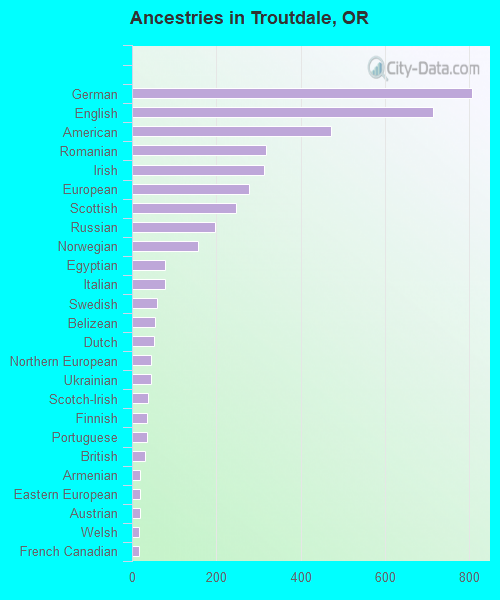
Ancestries in Troutdale
807 10.6% German714 9.4% English472 6.2% American319 4.2% Romanian313 4.1% Irish278 3.6% European247 3.2% Scottish198 2.6% Russian157 2.1% Norwegian78 1.0% Egyptian78 1.0% Italian60 0.8% Swedish54 0.7% Belizean53 0.7% Dutch45 0.6% Northern European44 0.6% Ukrainian37 0.5% Scotch-Irish35 0.5% Finnish35 0.5% Portuguese30 0.4% British19 0.2% Armenian19 0.2% Eastern European18 0.2% Austrian17 0.2% Welsh16 0.2% French Canadian15 0.2% Arab11 0.1% Belgian10 0.1% Hungarian9 0.1% Lebanese6 0.08% French5 0.07% Iraqi5 0.07% Swiss4 0.05% African
Children Nativity (place of birth) in Troutdale
Children under 6 years - Living with two parents Both parents native 879 100.0% NativeBoth parents foreign-born 120 100.0% NativeOne native, one foreign-born parent 96 100.0% NativeChildren under 6 years - Living with one parent Native parent 264 100.0% NativeForeign-born parent 22 100.0% NativeChildren 6 to 17 years - Living with two parents Both parents native 1,293 99.6% Native5 0.4% Foreign-bornBoth parents foreign-born 307 87.4% Native45 12.6% Foreign-bornOne native, one foreign-born parent 430 100.0% NativeChildren 6 to 17 years - Living with one parent Native parent 477 100.0% NativeForeign-born parent 199 50.0% Native199 50.0% Foreign-born
Grandparents responsible for own grandchildren in Troutdale
Grandparents (30 to 59 years) White / Caucasian 95 48.3% Responsible for grandchildren101 51.7% Not responsible for grandchildrenAsian 66 100.0% Not responsible for grandchildrenTwo or more races 34 100.0% Responsible for grandchildrenWhite alone, not Hispanic / Latino 99 84.3% Responsible for grandchildren18 15.7% Not responsible for grandchildrenHispanic or Latino 101 100.0% Not responsible for grandchildrenGrandparents (60 years and over) White / Caucasian 66 34.6% Responsible for grandchildren125 65.4% Not responsible for grandchildrenWhite alone, not Hispanic / Latino 69 37.3% Responsible for grandchildren116 62.7% Not responsible for grandchildrenHispanic or Latino 34 100.0% Not responsible for grandchildren